

Effects of typhoon and the mesoscale warm eddy on the near-inertial oscillations in the northern of the South China Sea
-
摘要: 基于2014年8−9月南海北部东沙群岛附近海域两个临近站位(站位A,20.736°N,117.745°E,水深1 249 m;站位B,20.835°N,117.56°E,水深848 m)的潜标数据,研究了台风过境所激发的近惯性振荡的特征,分析了中尺度暖涡对近惯性频率的调制及其对近惯性动能分布和传播的影响。站位A(B)142(175) m以浅,近惯性频率由0.710 1(0.713 3) 周/d红移至0.659 2 周/d,频率减小了7.2%(7.6%),观测结果与两个站位所处的背景涡度相吻合。中尺度暖涡改变了水体层结状态,两个站位的近惯性动能在不同层结中被改变了0.5~3倍。水体层结对能量的折射作用使得站位B的近惯性动能在深度158~223 m之间衰减较少,而站位A的近惯性动能则随着深度的增加快速减小。站位A和站位B近惯性内波的垂向群速度分别约为15.2 m/d和14.1 m/d。如果忽略近惯性动能的水平辐散,近惯性内波的垂向传播分别造成了两个站位垂向上约47%和38%的近惯性动能衰减。Abstract: Two moorings (Station A, 20.736°N, 117.745°E, 1 249 m; Station B, 20.835°N, 117.56°E, 848 m) were located near the Dongsha Islands in the northern of the South China Sea from August to September 2014. Based on the measured data, we have studied the characteristics of near-inertial oscillations (NIOs) induced by typhoons, and analyzed the modulation of mesoscale warm eddy on the near-inertial frequency and its influence on the distribution and propagation of near-inertial kinetic energy (NIKE).The frequency of the NIOs at Station A (B) is 0.659 2 circle per day< at depths shallower than 142 (175) m with a redshift of 7.2% (7.6%) from the local initial frequency of 0.710 1 (0.713 3) circle per day, which is consistent with their background vorticities. The mesoscale warm eddy changes the stratification, which causes the NIKE of the two stations modified by 0.5−3 times in different stratifications. The refraction effect of stratification on energy makes the NIKE relatively concentrate with small decay between 158 and 223 m at Station B but rapidly decrease at Station A. The vertical group velocities of near-inertial internal waves at Station A and Station B are approximately 15.2 m/d and 14.1 m/d. Ignore the loss of NIKE in horizontal direction, their vertical propagation causes approximately 47% and 38% of NIKE decay in vertical direction, respectively.spectively.
-
Key words:
- northern South China Sea /
- typhoon /
- near-inertial oscillations /
- mesoscale warm eddy /
- stratification
-
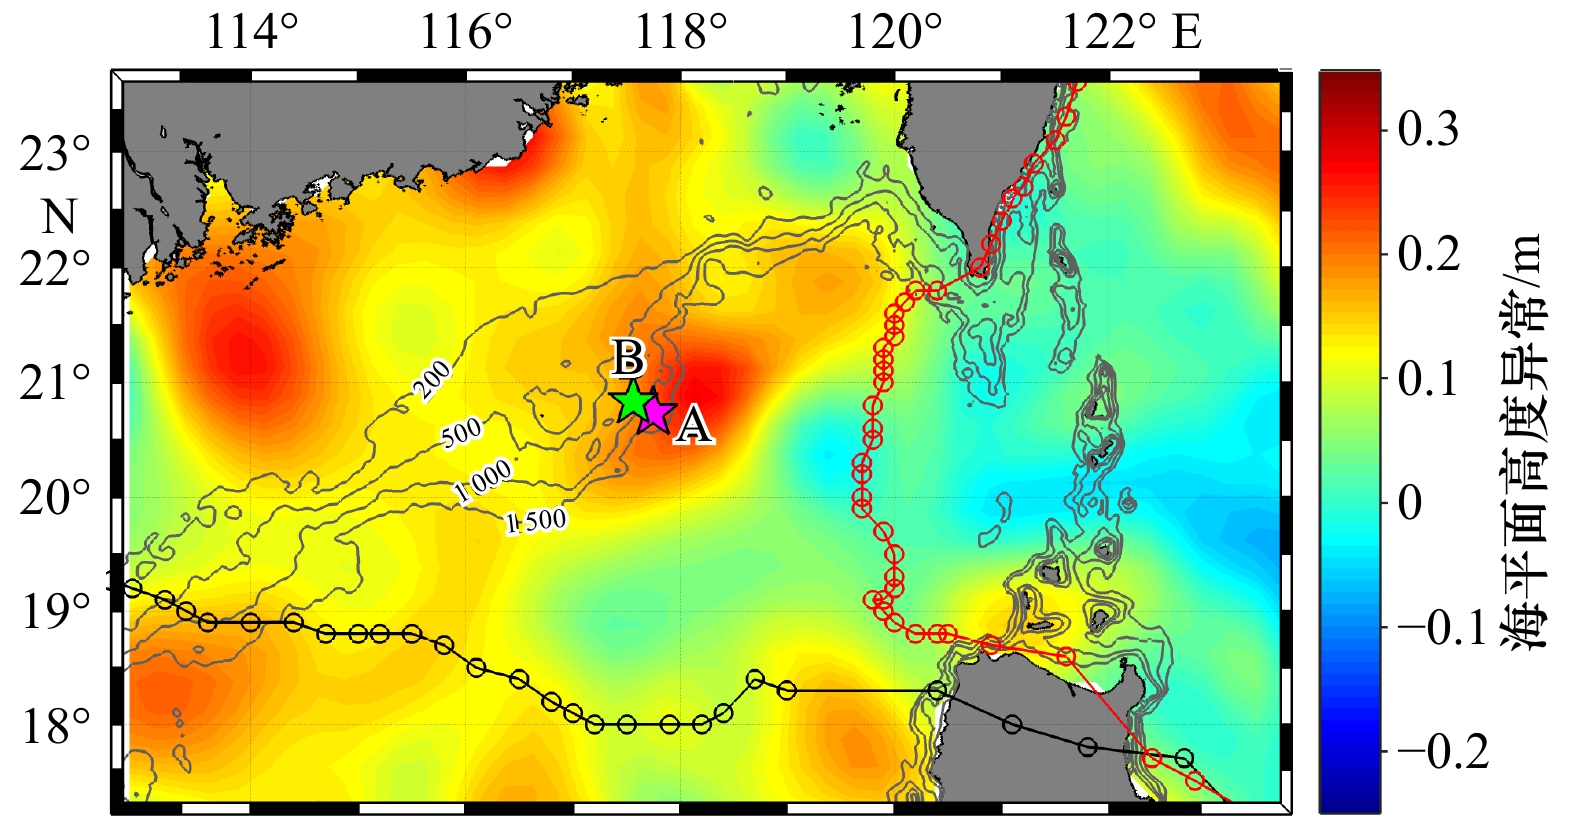
图 1 南海北部2014年9月19日海平面高度异常的分布
A(粉色☆)和B(绿色☆)分别为两个潜标锚定点。黑色实线为台风“海鸥”的移动路径,黑色○代表台风“海鸥”逐时的具体位置。红色实线为台风“凤凰”的移动路径,红色○代表台风“凤凰”逐时的具体位置
Fig. 1 Sea level anomaly in the northern of South China Sea on September 19th, 2014
Two mooring stations A and B marked with pink and green pentagrams, respectively. The black solid line with circles is the path of Typhoon Kalmaegi. The red solid line with circles is the path of Typhoon Fung-wong

图 2 2014年9月10−27日期间站位A(a,b)和站位B(c,d)近惯性流东西向(a,c)、南北向(b,d)分量随时间和深度的分布
东向和北向的流速定义为正值。红色和蓝色的竖线分别表示为9月15日0时和9月19日0时
Fig. 2 The distribution of the near-inertial current zonal (a, c) and meridional (b, d) velocity at Station A (a, b) and Station B (c, d) from September 10th to 27th, 2014
Eastward and northward are positive value. The red and blue vertical lines denote 0:00 on September 15th and 0:00 on September 19th, respectivily

图 3 整个观测期间站位A和B上空10 m处的风速大小(a)和两个站位深度(50 m≤d≤350 m)积分后的近惯性动能(b)随时间变化的分布
红色和蓝色的竖线分别表示9月15日0时和9月19日0时
Fig. 3 Time evolution of the 10 m wind speed (a) and the integrated near-inertial kinetic energy between 50 m and 350 m (b) at Station A and Station B during the entire observational period
The red and blue vertical lines denote 0:00 on September 15th and 0:00 on September 19th, respectivily
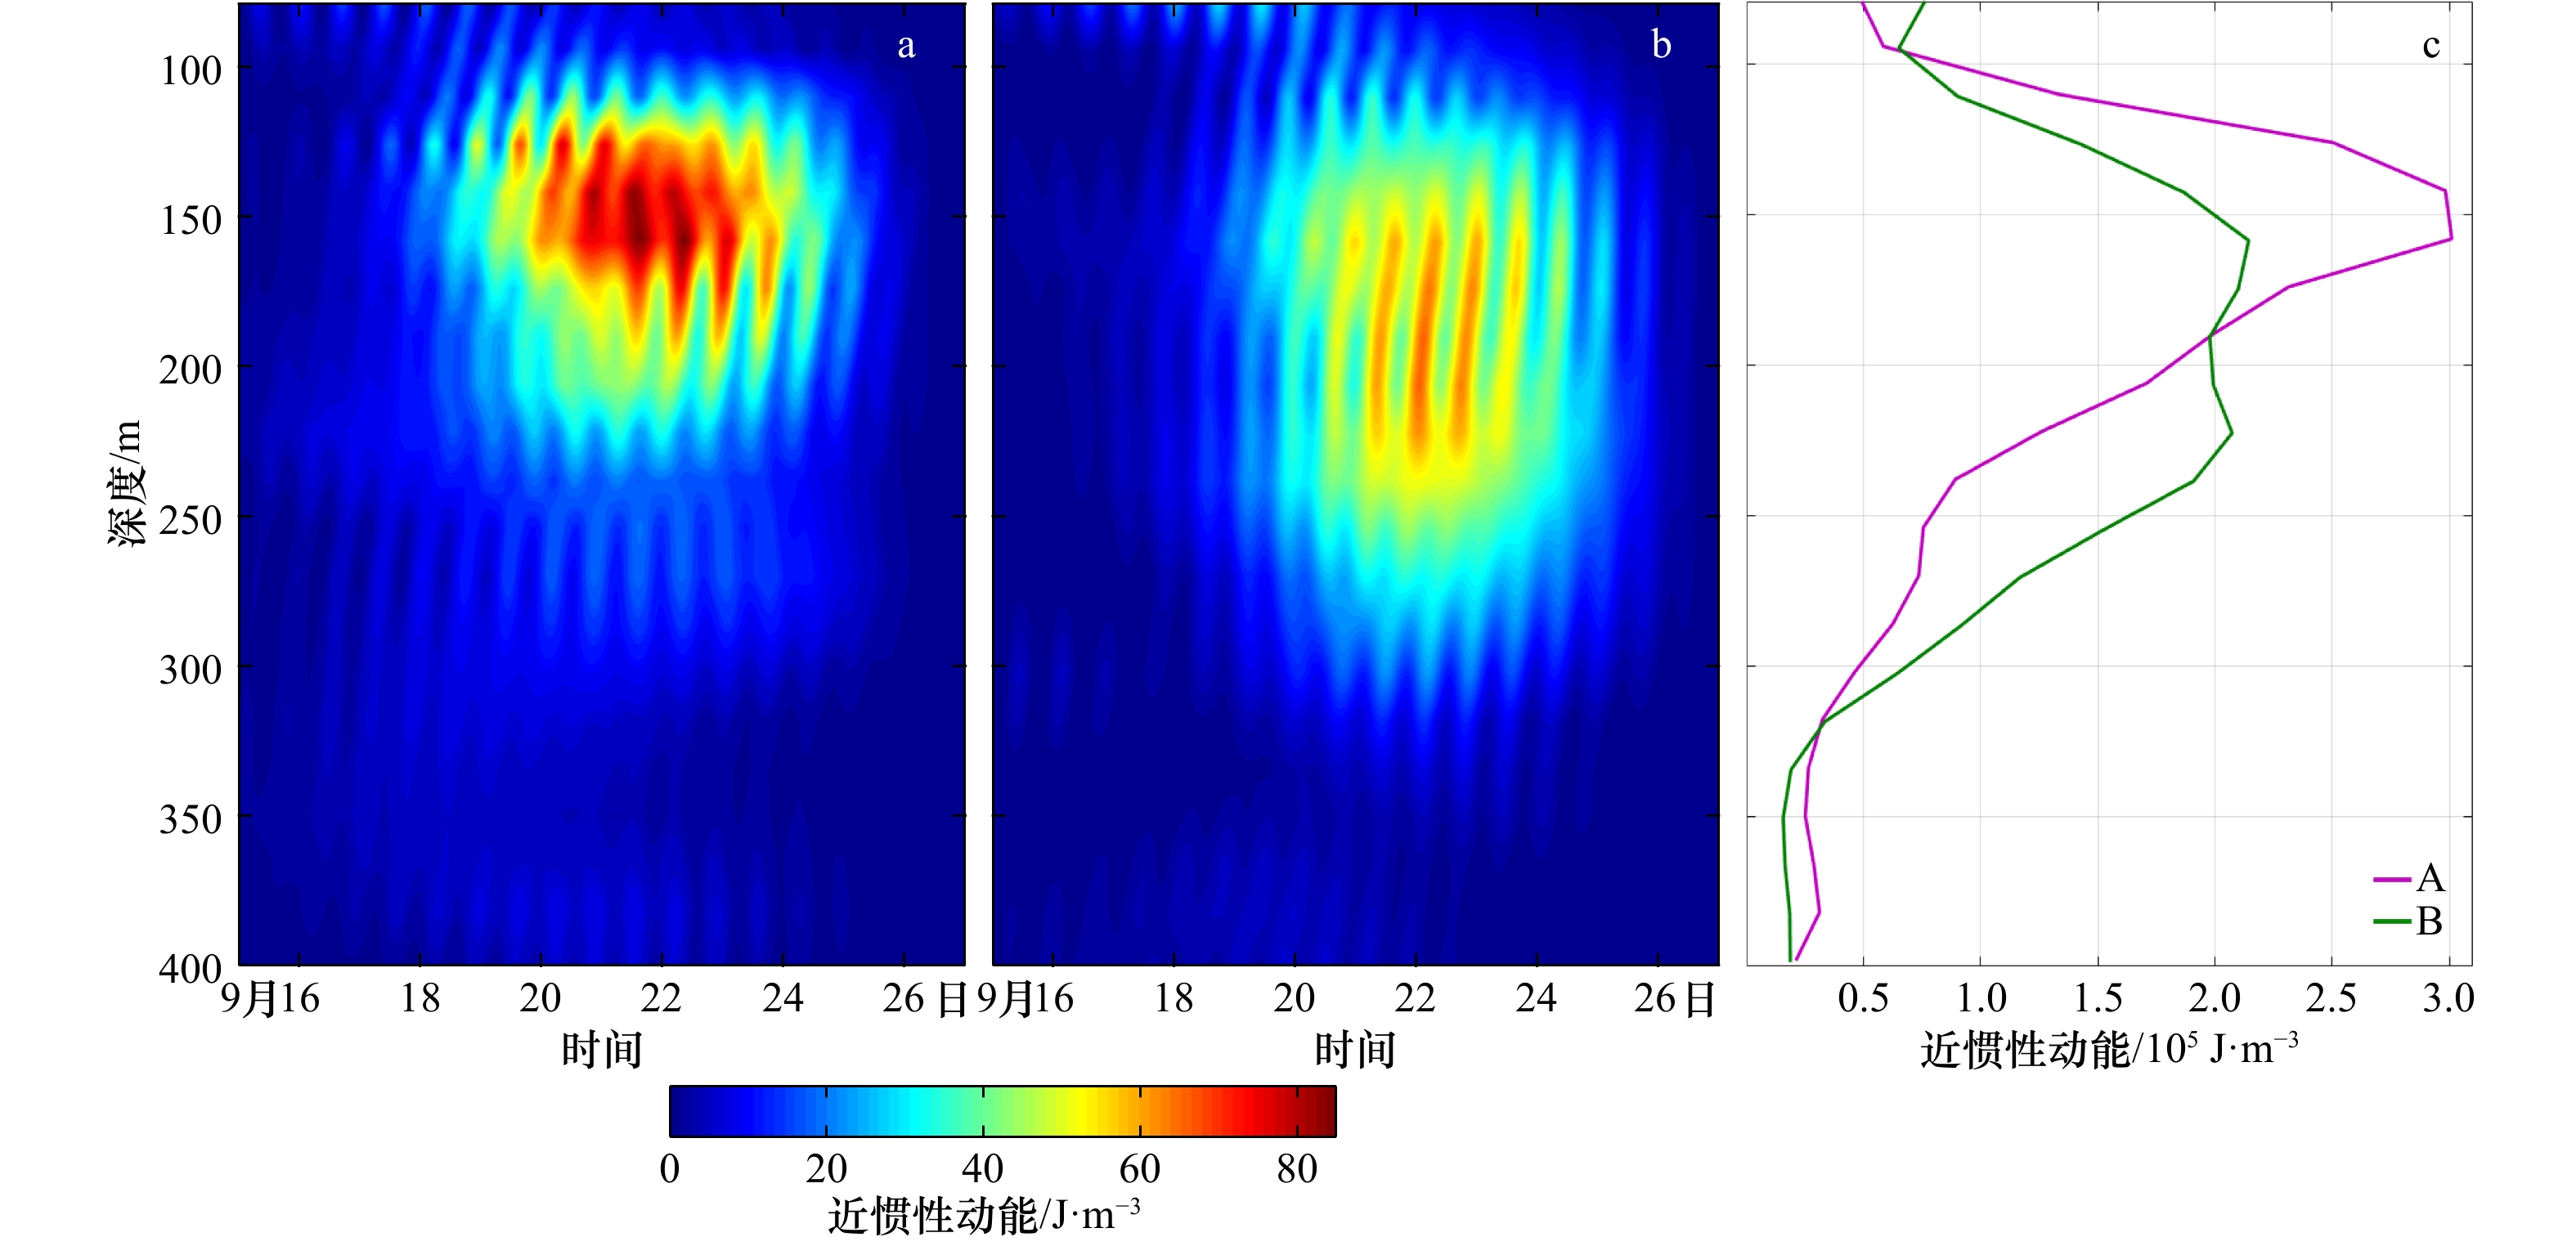
图 4 2014年9月15−27日期间站位A(a)和站位B(b)近惯性动能随时间的分布和两站位15−27日时间积分后的近惯性动能在垂向上的分布(c)
Fig. 4 The time evolutions of near-inertial kinetic energy from September 15th to 27th, 2014 at Station A (a) and StationB (b), and the vertical profiles of time integrated near-inertial kinetic energy of them during this period (c)
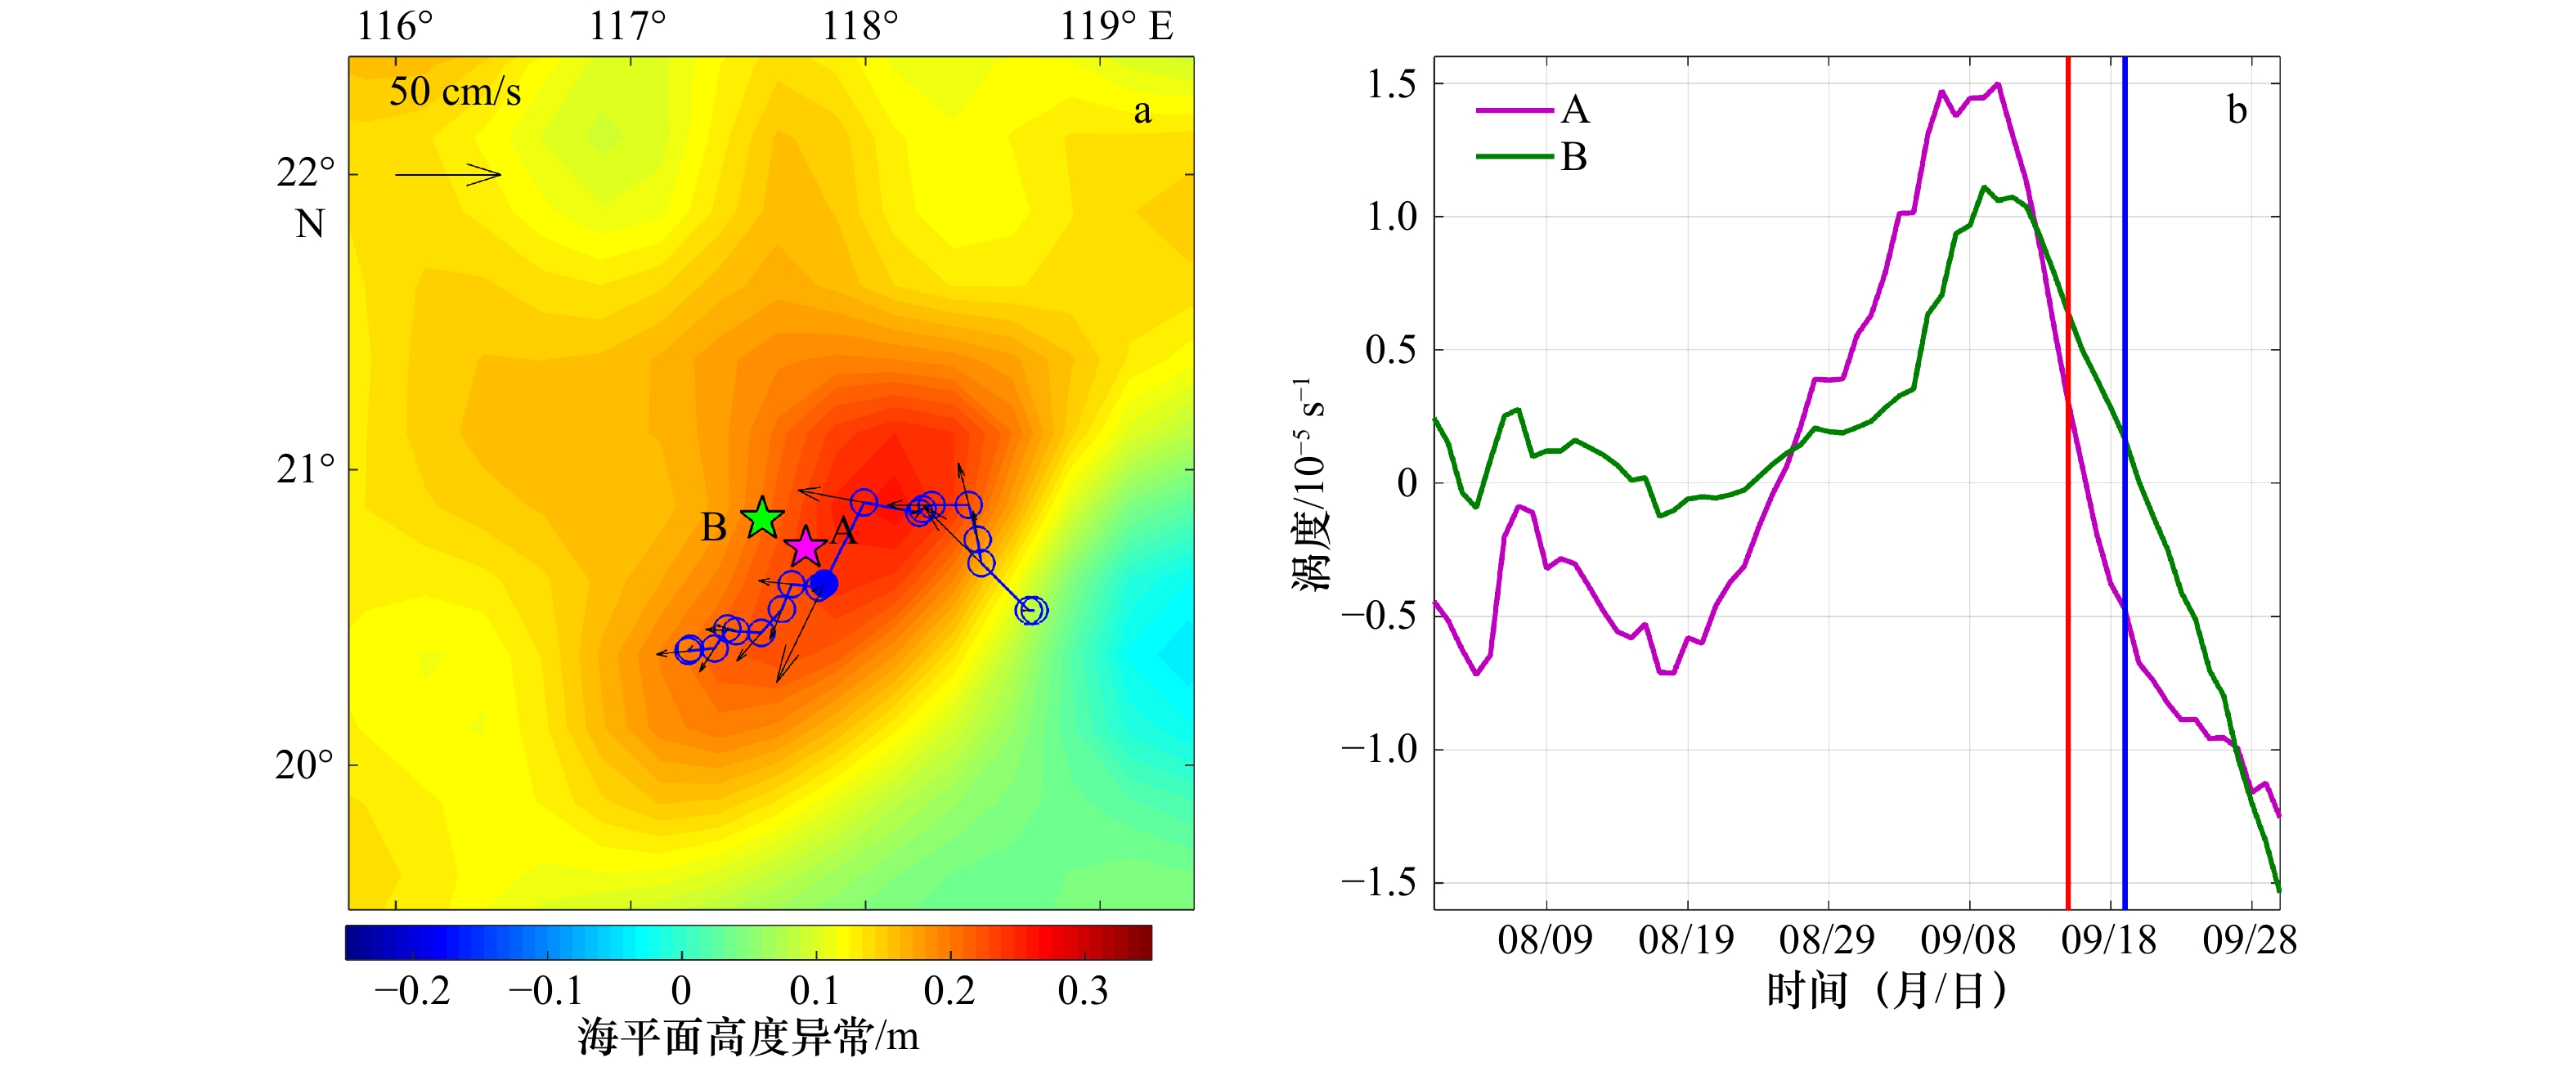
图 5 2014年9月21日海平面高度异常的分布(a)及观测期间站位A和B的涡度分布(b)
a图中黑线和蓝色空心○代表暖涡的移动轨迹以及中心位置,蓝色实心○为9月21日暖涡的中心,黑色箭头表示暖涡中心移动速度的大小和方向。红色和蓝色的竖线分别表示为9月15日0时和9月19日0时
Fig. 5 The distribution of sea level anomaly on September 21st, 2014 (a), and variation of vortices at A and B stations during the observation period (b)
Black line and blue empty circles represent the trajectory and the center positions of the warm eddy, and the blue solid circle is the center of the warm eddy on September 21st. The black arrows indicate the magnitude and direction of the moving speed of the centers of the warm eddy. The red and blue vertical lines denote 0:00 on September 15th and 0:00 on September 19th, respectivily
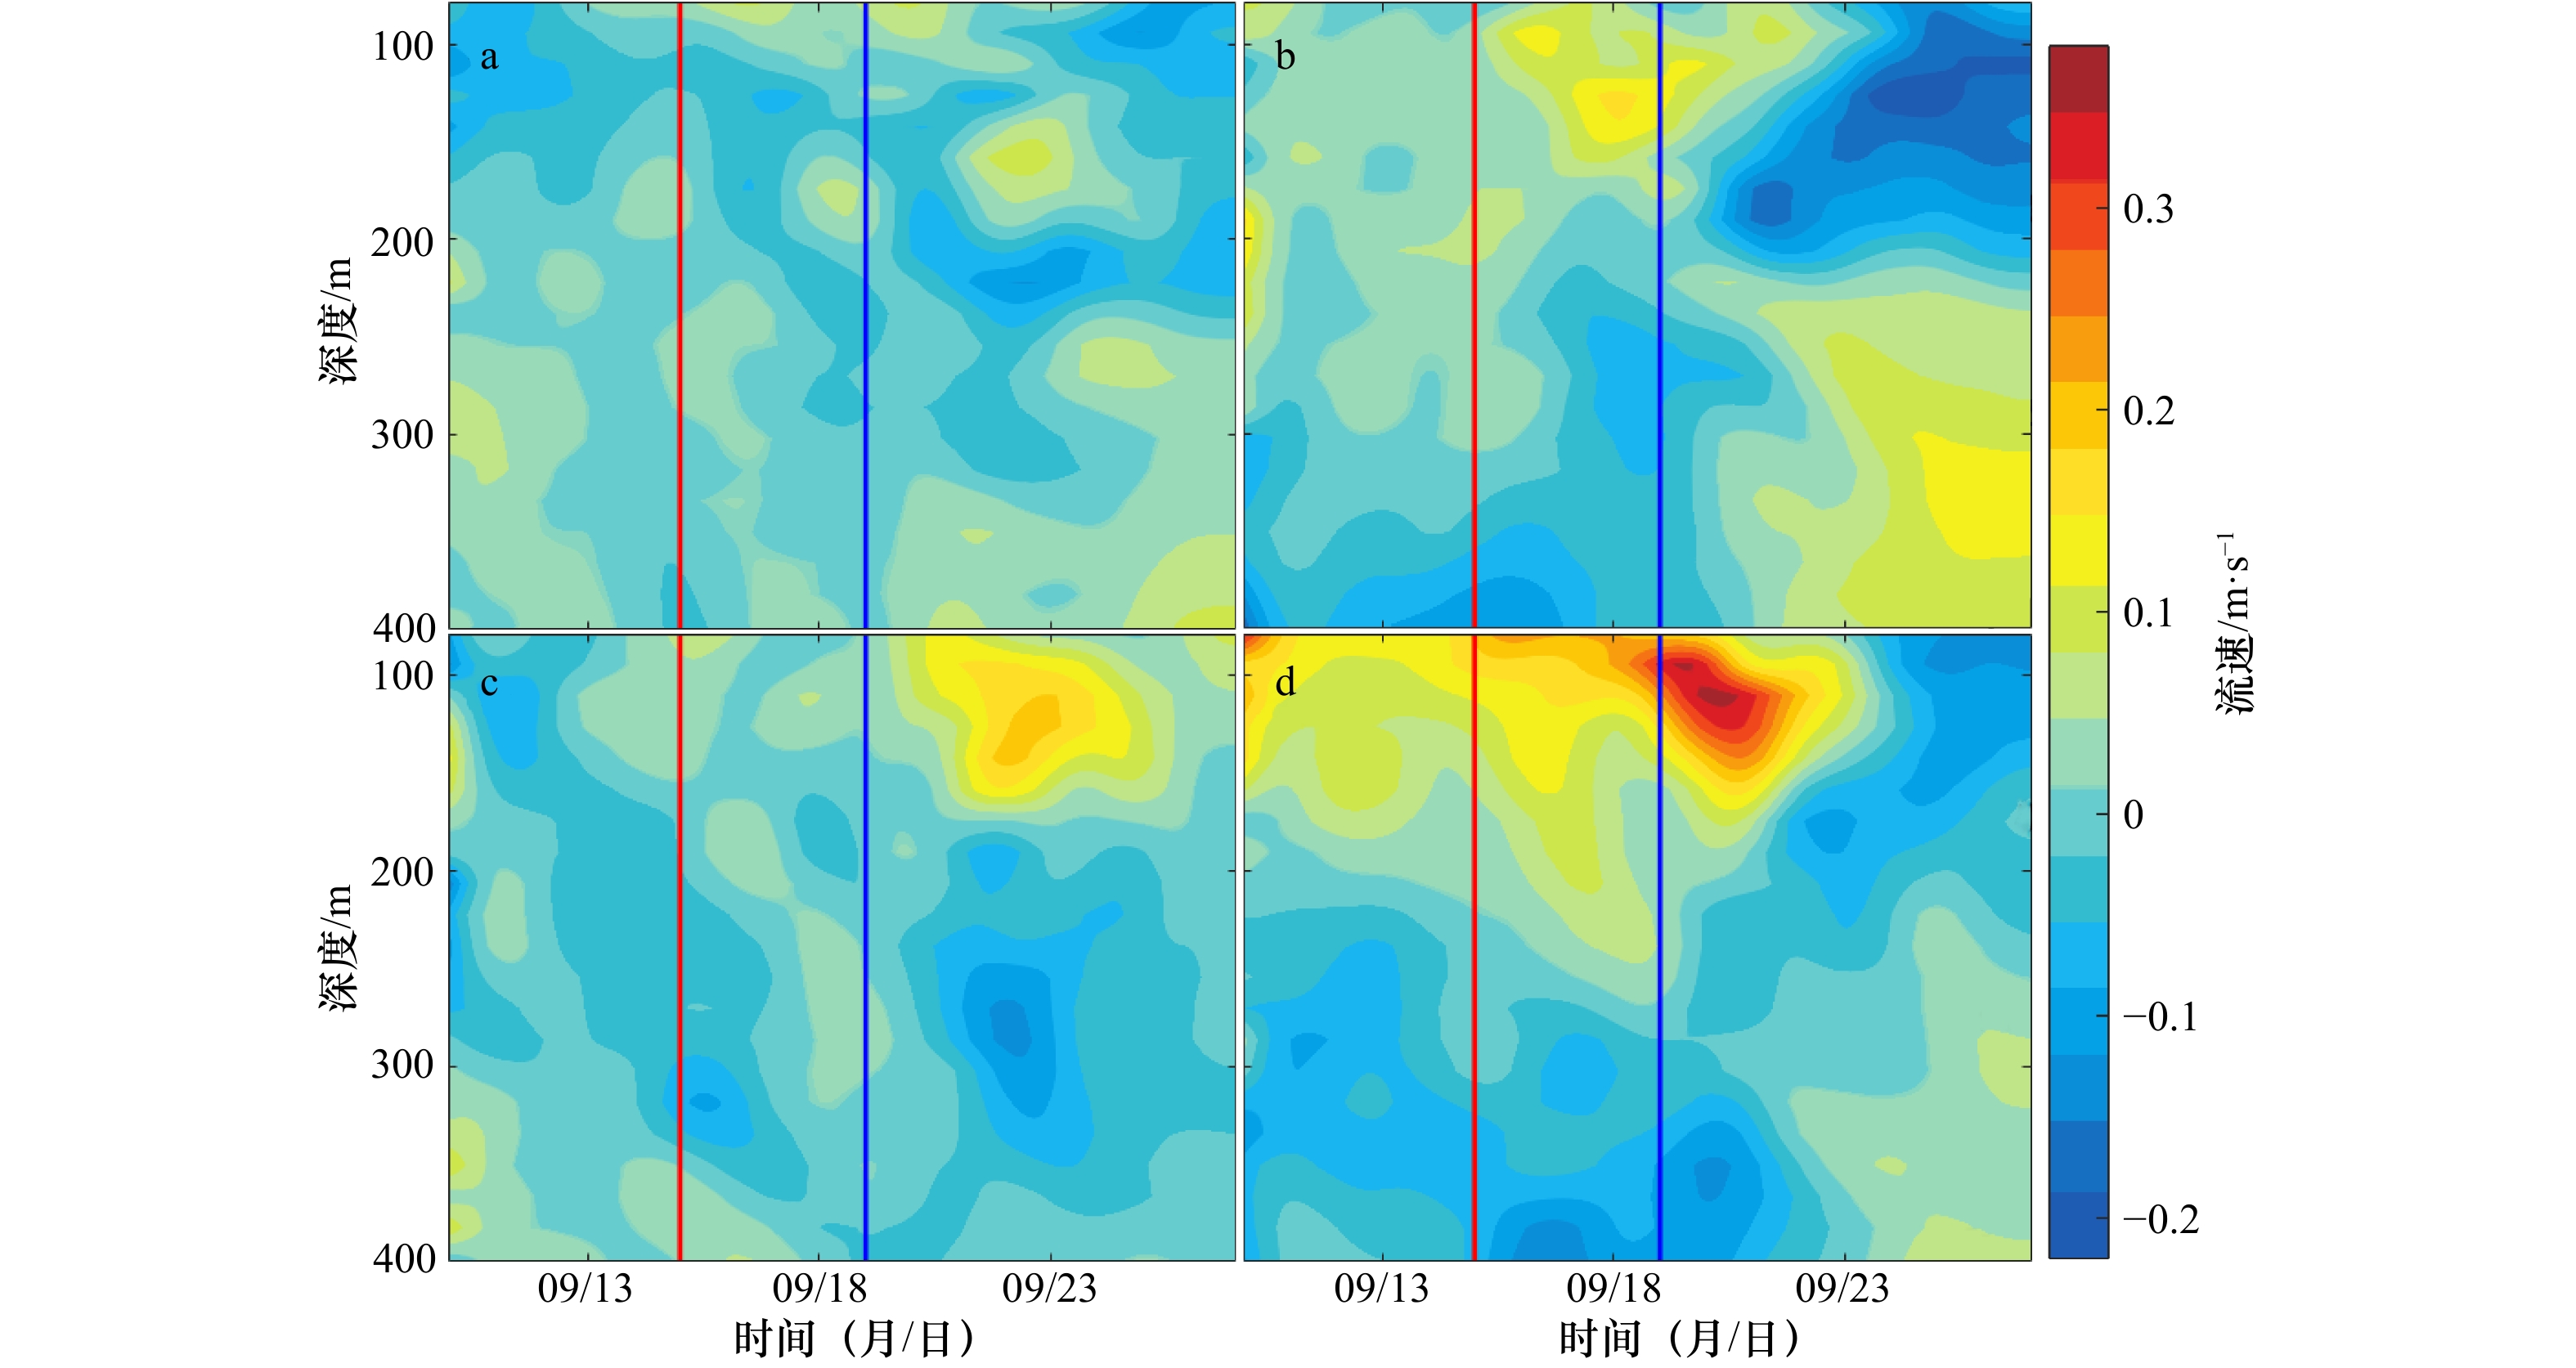
图 6 2014年9月10−27日期间站位A(a,b)和站位B(c,d)72 h低通滤波后的低频流速随时间和深度的分布
a和c为东西向流速,b和d为南北向流速,定义东向和北向的流速为正值。红色和蓝色的竖线分别表示为9月15日0时和9月19日0时
Fig. 6 The distribution of low-frequency flow (filtered by 72 h low-pass filter) over time and depth at Station A and Station B during Sptember 15th to 27th, 2014
a and c are zonal velocity, b and d are meridional velocity. Both of the eastward and northward components are defined as the plus directions. The red and blue vertical lines denote 0:00 on September 15th and 0:00 on September 19th, respectivily
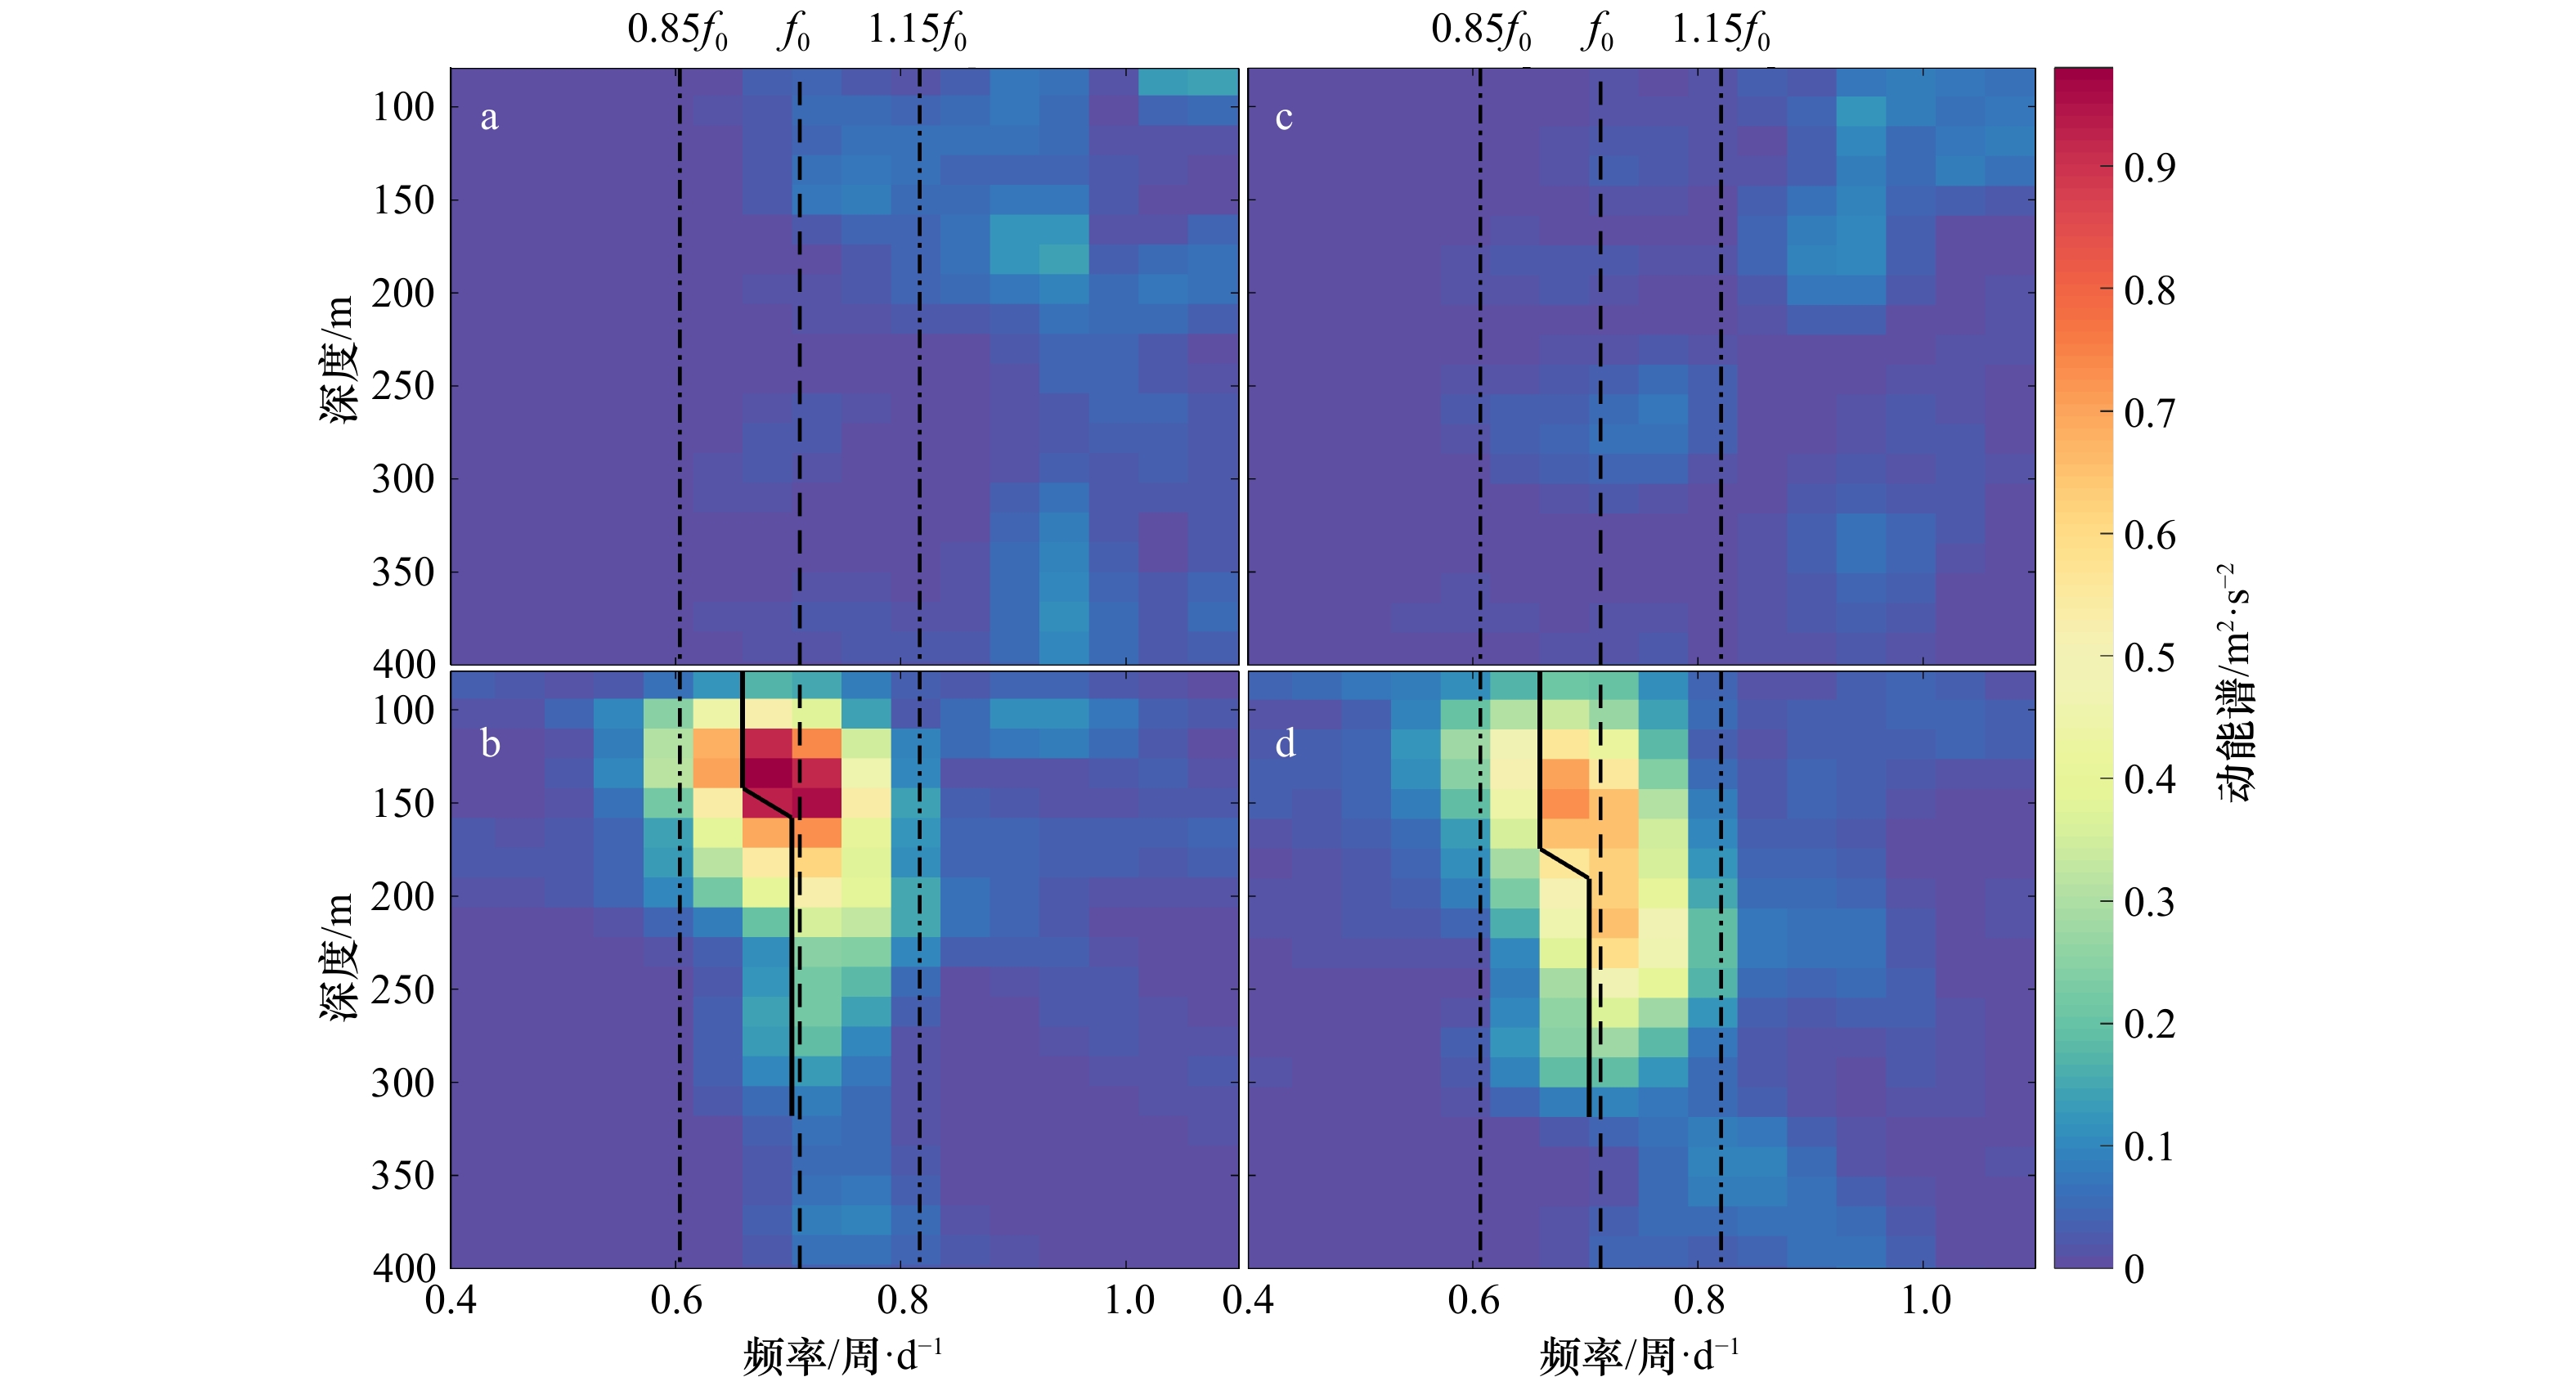
图 7 站位A(a,b)和B(c,d)台风之前(a,c)和之后(b,d)的动能谱断面分布
虚线和点虚线分别表示局地的惯性频率f0,0.85f0和1.15f0。实线为最大的近惯性频率,即近惯性振荡的有效频率fe
Fig. 7 Power spectra before (a,c) and after (b,d) typhoon of Station A (a,b) and Station B(c,d)
The dash lines and dash-dotted lines represent the local inertial frequency f0, 0.85f0, and 1.15f0, respectively. The solid line denotes the peak near-inertial frequency, fe, which is the effective frequency of near-inertial oscillations

图 8 WKB因子
$\dfrac{{N\left( z \right)}}{{\bar N}}$ (a),垂向上两个站位原始的近惯性动能(实线)和WKB近似后的近惯性动能(虚线)(b)Fig. 8 The WKB scaling factor
$\dfrac{{N\left( z \right)}}{{\bar N}}$ (a), raw near-inertial kinetic energy (solid lines) and WKB-scaled near-inertial kinetic energy (dash lines) of Station A and Station B (b)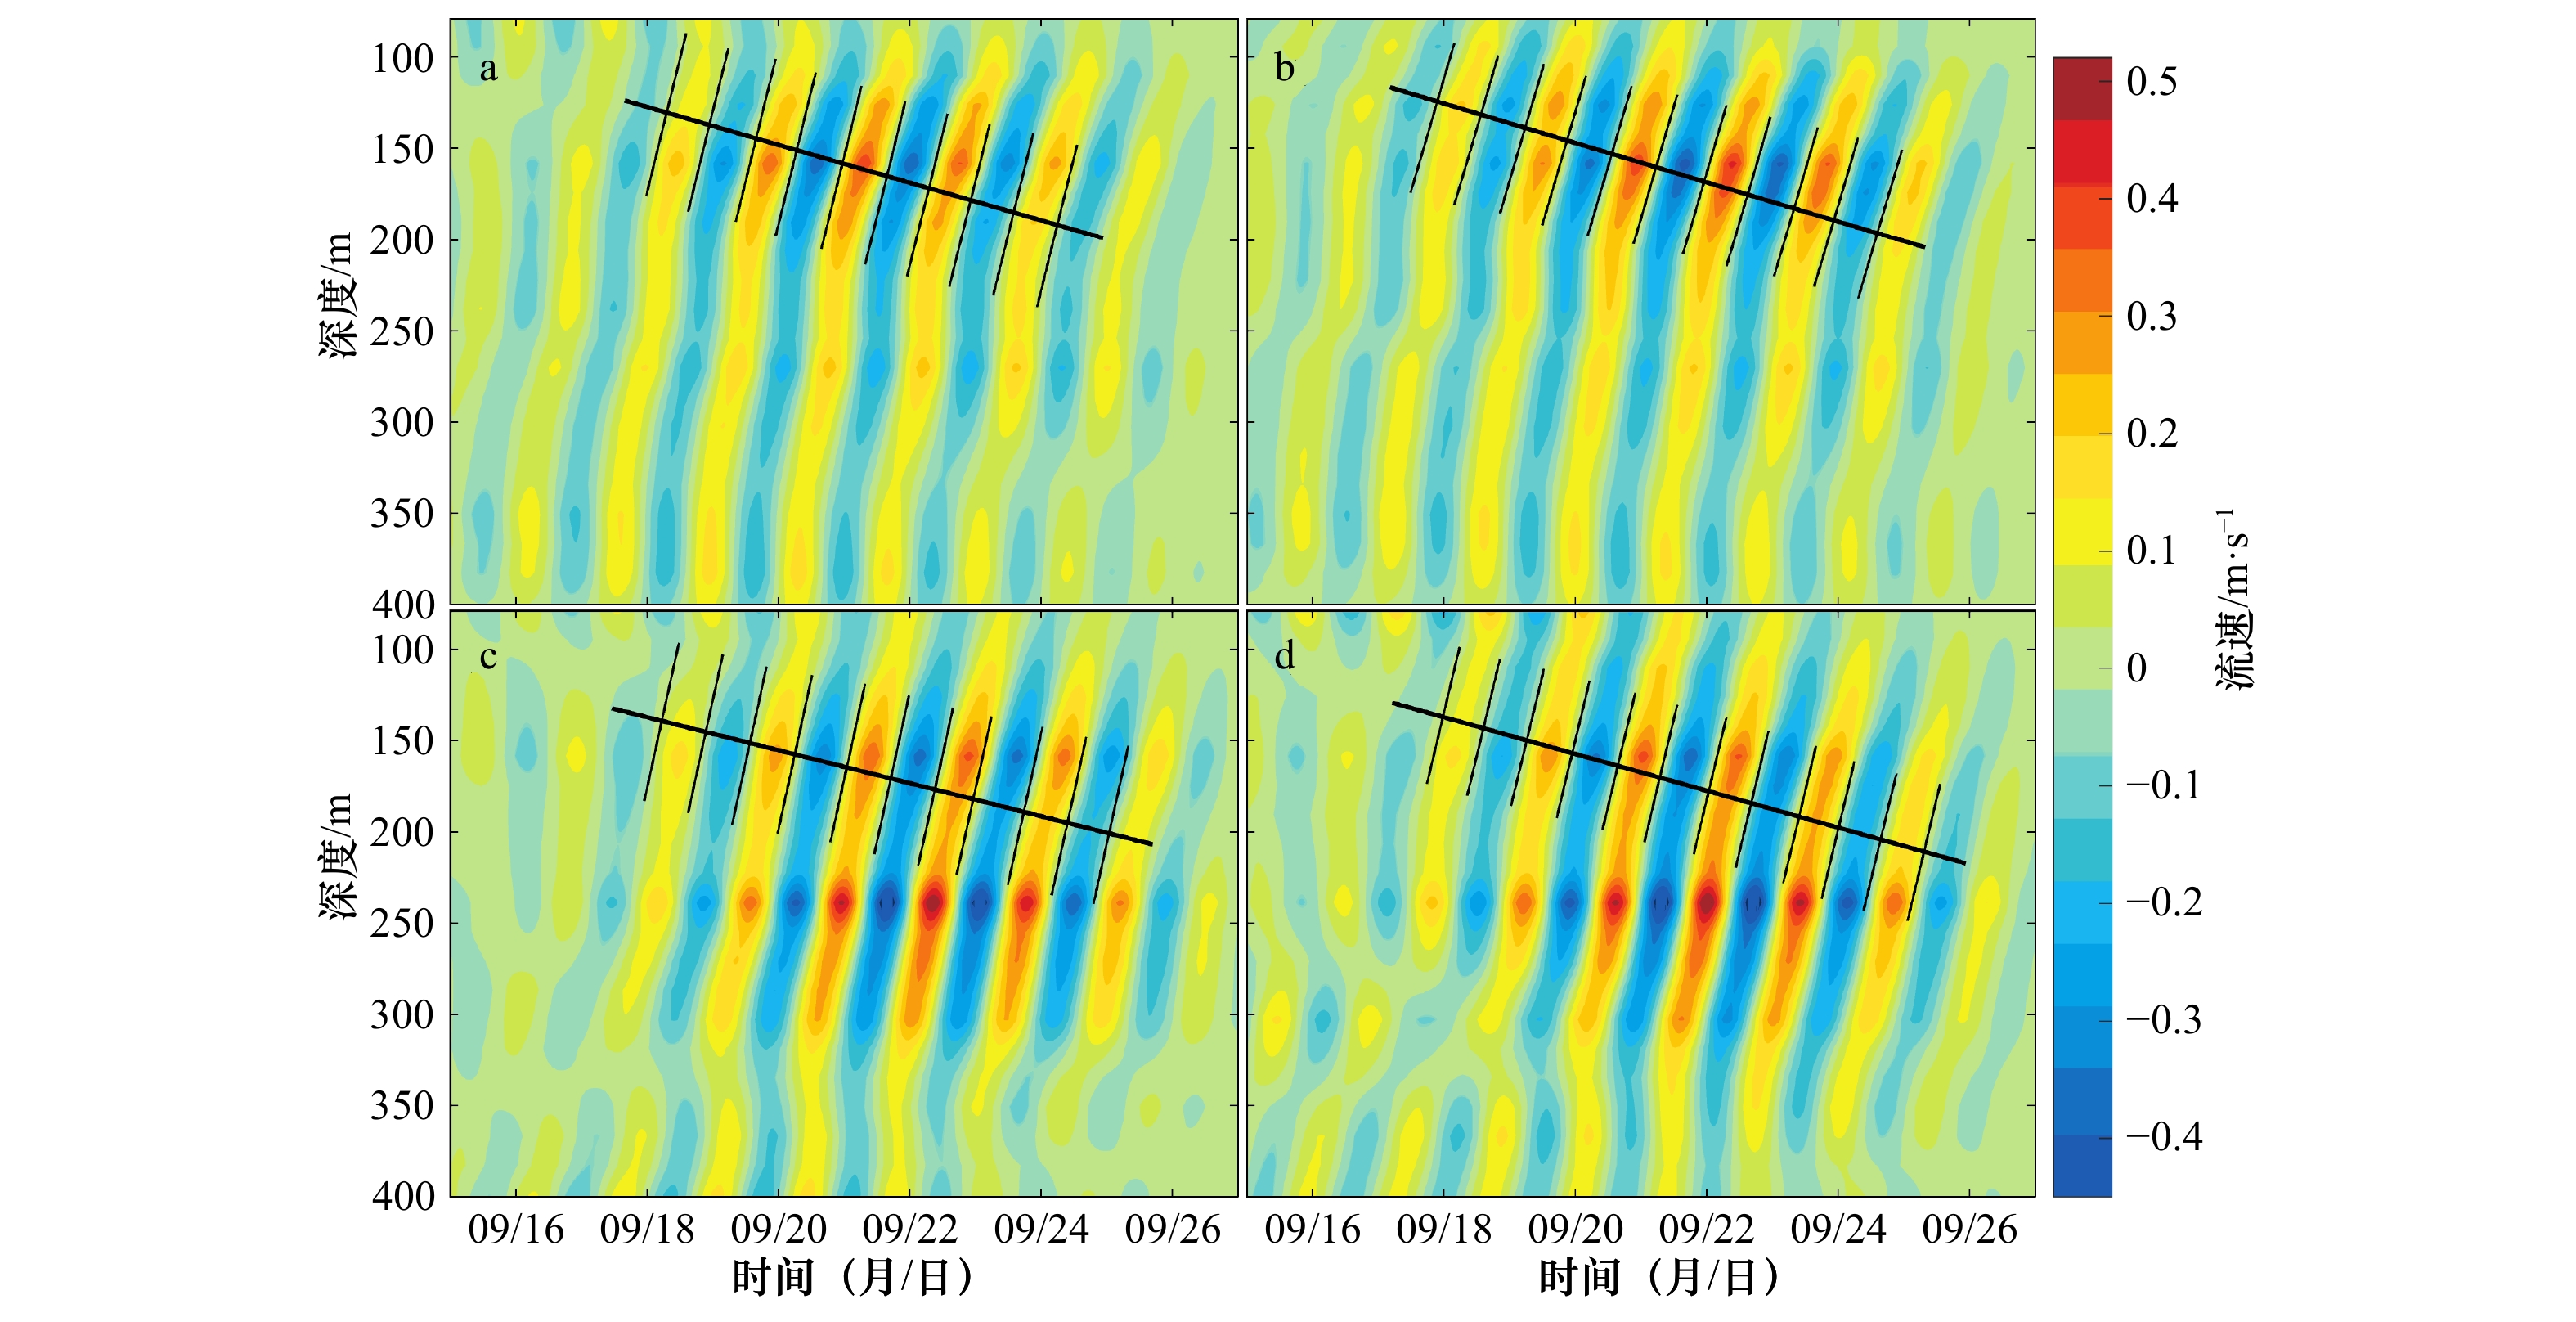
图 9 2014年9月15−27日期间站位A(a,b)和站位B(c,d)WKB近似后近惯性振荡东西向(a,c)和南北向(b,d)流速随时间和深度的分布
东向和北向的流速定义为正值。图中黑色倾斜实线表示近惯性动能的传播方向,用于估算垂向群速度Cg(z)
Fig. 9 The distribution of the WKB-scaled near-inertial current (a, c) and meridional (b, d) velocity at Station A (a, b) and Station B (c, d) from September 10th to 27th, 2014
Eastward and northward are positive value. Sloping black lines represent the downward migration of near-inertial kinetic energy, which are fitted to estimate the vertical group velocity Cg(z)
-
[1] 管守德. 南海北部近惯性振荡研究[D]. 青岛: 中国海洋大学, 2014.Guan Shoude. Near inertial oscillations in the northern South China Sea[D]. Qingdao: Ocean University of China, 2014. [2] 梁辉. 南海北部内潮与近惯性内波观测研究[D]. 青岛: 中国海洋大学, 2015.Liang Hui. Observational study on the internal tides and near-inertial internal waves in the northern South China Sea[D]. Qingdao: Ocean University of China, 2015. [3] 方欣华, 杜涛. 海洋内波基础和中国海内波[M]. 青岛: 中国海洋大学出版社, 2005.Fang Xinhua, Du Tao. The Basis of Internal Ocean Waves and China Internal Ocean Waves[M]. Qingdao: China Ocean University Press, 2005. [4] Chen Gengxin, Xue Huijie, Wang Dongxiao, et al. Observed near-inertial kinetic energy in the northwestern South China Sea[J]. Journal of Geophysical Research: Oceans, 2013, 118(10): 4965−4977. doi: 10.1002/jgrc.20371 [5] Sun Zhenyu, Hu Jianyu, Zheng Quanan, et al. Strong near-inertial oscillations in geostrophic shear in the northern South China Sea[J]. Journal of Oceanography, 2011, 67(4): 377−384. doi: 10.1007/s10872-011-0038-z [6] Kunze E. Near-inertial wave propagation in geostrophic shear[J]. Journal of Physical Oceanography, 1985, 15(5): 544−565. doi: 10.1175/1520-0485(1985)015<0544:NIWPIG>2.0.CO;2 [7] Elipot S, Lumpkin R, Prieto G. Modification of inertial oscillations by the mesoscale eddy field[J]. Journal of Geophysical Research: Oceans, 2010, 115(C9): C09010. [8] Byun S S, Park J J, Chang K I, et al. Observation of near-inertial wave reflections within the thermostad layer of an anticyclonic mesoscale eddy[J]. Geophysical Research Letters, 2010, 37(1): L01606. [9] Park J H, Watts D R. Near-inertial oscillations interacting with mesoscale circulation in the southwestern Japan/East Sea[J]. Geophysical Research Letters, 2005, 32(10): L10611. doi: 10.1029/2005GL022936 [10] Young W R, Jelloul M B. Propagation of near-inertial oscillations through a geostrophic flow[J]. Journal of Marine Research, 1997, 55(4): 735−766. doi: 10.1357/0022240973224283 [11] Lee D K, Niiler P P. The inertial chimney: the near-inertial energy drainage from the ocean surface to the deep layer[J]. Journal of Geophysical Research: Oceans, 1998, 103(C4): 7579−7591. doi: 10.1029/97JC03200 [12] Zhai Xiaoming, Greatbatch R J, Zhao Jun. Enhanced vertical propagation of storm-induced near-inertial energy in an eddying ocean channel model[J]. Geophysical Research Letters, 2005, 32(18): L18602. [13] Sun Lu, Zheng Quanan, Wang Dongxiao, et al. A case study of near-inertial oscillation in the South China Sea using mooring observations and satellite altimeter data[J]. Journal of Oceanography, 2011, 67(6): 677−687. doi: 10.1007/s10872-011-0081-9 [14] Gonella J. A rotary-component method for analysing meteorological and oceanographic vector time series[J]. Deep Sea Research and Oceanographic Abstracts, 1972, 19(12): 833−846. doi: 10.1016/0011-7471(72)90002-2 [15] Halo I F M. The Mozambique Channel eddies: characteristics and mechanisms of formation[D]. Cape Town: University of Cape Town, 2012. [16] Halo I, Backeberg B, Penven P, et al. Eddy properties in the Mozambique Channel: a comparison between observations and two numerical ocean circulation models[J]. Deep Sea Research Part II: Topical Studies in Oceanography, 2014, 100: 38−53. doi: 10.1016/j.dsr2.2013.10.015 [17] Chelton D B, Schlax M G, Samelson R M. Global observations of nonlinear mesoscale eddies[J]. Progress in Oceanography, 2011, 91(2): 167−216. doi: 10.1016/j.pocean.2011.01.002 [18] Isern-Fontanet J, García-Ladona E, Font J. Vortices of the Mediterranean Sea: an altimetric perspective[J]. Journal of Physical Oceanography, 2006, 36(1): 87−103. doi: 10.1175/JPO2826.1 [19] Chelton D B, Schlax M G, Samelson R M, et al. Global observations of large oceanic eddies[J]. Geophysical Research Letters, 2007, 34(15): L15606. [20] Zhao Jing, Wu Lixin, Ma Xiaohui. Energy exchange between the mesoscale oceanic eddies and wind-forced near-inertial oscillations[J]. Journal of Physical Oceanography, 2017, 47(3): 721−733. doi: 10.1175/JPO-D-16-0214.1 [21] Chavanne C P, Firing E, Ascani F. Inertial oscillations in geostrophic flow: is the inertial frequency shifted by ζ/2 or by ζ?[J]. Journal of Physical Oceanography, 2012, 42(5): 884−888. doi: 10.1175/JPO-D-12-031.1 [22] Whitt D B, Thomas L N. Resonant generation and energetics of wind-forced near-inertial motions in a geostrophic flow[J]. Journal of Physical Oceanography, 2014, 45(1): 181−208. [23] Leaman K D, Sanford T B. Vertical energy propagation of inertial waves: a vector spectral analysis of velocity profiles[J]. Journal of Geophysical Research, 1975, 80(15): 1975−1978. doi: 10.1029/JC080i015p01975 [24] Qi Hongbo, De Szoeke R A, Paulson C A, et al. The structure of near-inertial waves during ocean storms[J]. Journal of Physical Oceanography, 1995, 25(11): 2853−2871. doi: 10.1175/1520-0485(1995)025<2853:TSONIW>2.0.CO;2 -

 下载:
下载:


 点击查看大图
计量
- 文章访问数: 463
- HTML全文浏览量: 89
- PDF下载量: 163
- 被引次数: 0
