

Remote estimation of total suspended matter concentration in the Hangzhou Bay based on OLCI and its water color product applicability analysis
-
摘要: 悬浮物含量及其时空分布是河口海岸环境中关心的热点问题。2016年2月16日,欧洲航天局发射了新一代海洋水色传感器(OLCI),该传感器具有良好的时空及光谱分辨率。本研究结合2017年7月杭州湾同步采样数据,对比了6种大气校正算法和8种悬浮物浓度(TSM)估算模型,遴选和分析了适宜于杭州湾和OLCI数据的大气校正方法和TSM估算模型,验证了OLCI数据二级产品精度和适用性。结果表明:(1)基于紫外光谱的大气校正算法(UVAC)精度最高,同步4个采样点的大气校正平均相对误差(MAPE)分别为34.21%、13.11%、5.92%和20.28%。在除Oa1以外的14个波段的MAPE均值为15.23%,Oa4至Oa10波段的MAPE低于8%;(2)基于Oa16/Oa5的波段比值模型,具有良好的建模(MAPE为16.49%,RMSE为50.92 mg/L)和验证(MAPE为19.08%,RMSE为19.29 mg/L)精度及模型稳健性;(3)基于C2RCC算法的固有光学量和TSM含量产品及OLCI二级TSM含量产品在杭州湾精度较差,不适用于杭州湾TSM和固有光学量遥感监测应用;(4)空间上,TSM在杭州湾中部区域含量较低,在杭州湾南岸和湾口区域含量较高。Abstract: As a main carrier of nutrients and pollutants, total suspended matter (TSM) has a significant influence on water environment, especially on estuary water environment. The Ocean and Land Colour Instrument (OLCI) was onboard ESA Sentinel-3A satellite and launched in February 16, 2016, with fine spatial, temporal and spectral resolution. To find the best atmospheric correction method and TSM retrieval model for the application of OLCI in Hangzhou Bay (HZB), six atmospheric correction methods and eight TSM retrieval models were test based on in situ water color data collected from HZB on July 2017. In addition, the OLCI Level 2 product (e.g. TSM and inherent optical properties (IOP) data) was compared with in situ data to evaluate the accuracy and applicability of OLCI Level 2 product. The results show that the method of atmospheric correction based on ultraviolet wavelength (UVAC) and the TSM retrieval model based on band ratio have best performance. Specifically, the mean absolute percentage error (MAPE) of atmospheric correction in four match-up sites is 34.21%, 13.11%, 5.92% and 20.28%, respectively. In addition, the averaged MAPE of atmospheric correction in band Oa2 to Oa12 and Oa16 to Oa18 is 15.23%, and in band Oa4 to Oa10 is less than 8%. The band ratio (Oa16/Oa5) model has the best performance, with a MAPE of 16.49% and root mean square error (RMSE) of 50.92 mg/L in calibration stage, and a MAPE of 19.08% and RMSE of 19.29 mg/L in validation stage. However, the TSM and IOP product derived from C2RCC (case 2 regional coast colour) algorithm and the TSM product derived from OLCI Level 2 product has no linear relationship with in situ data. These results indicate that the above Level 2 product is unsuitable for HZB TSM and IOP remote estimation. Finally, the UVAC method and band ratio model are applied to OLCI imagery that is collected on July 23, 2017. Spatially, TSM shows a relative low value in the center of HZB and relative high value in the south and east part of HZB.
-
Key words:
- Hangzhou Bay /
- OLCI data /
- total suspended matter /
- applicability analysis /
- atmospheric correction
-

图 1 研究区及采样点分布示意
Fig. 1 The location of study area and the spatial distribution of sampling stations
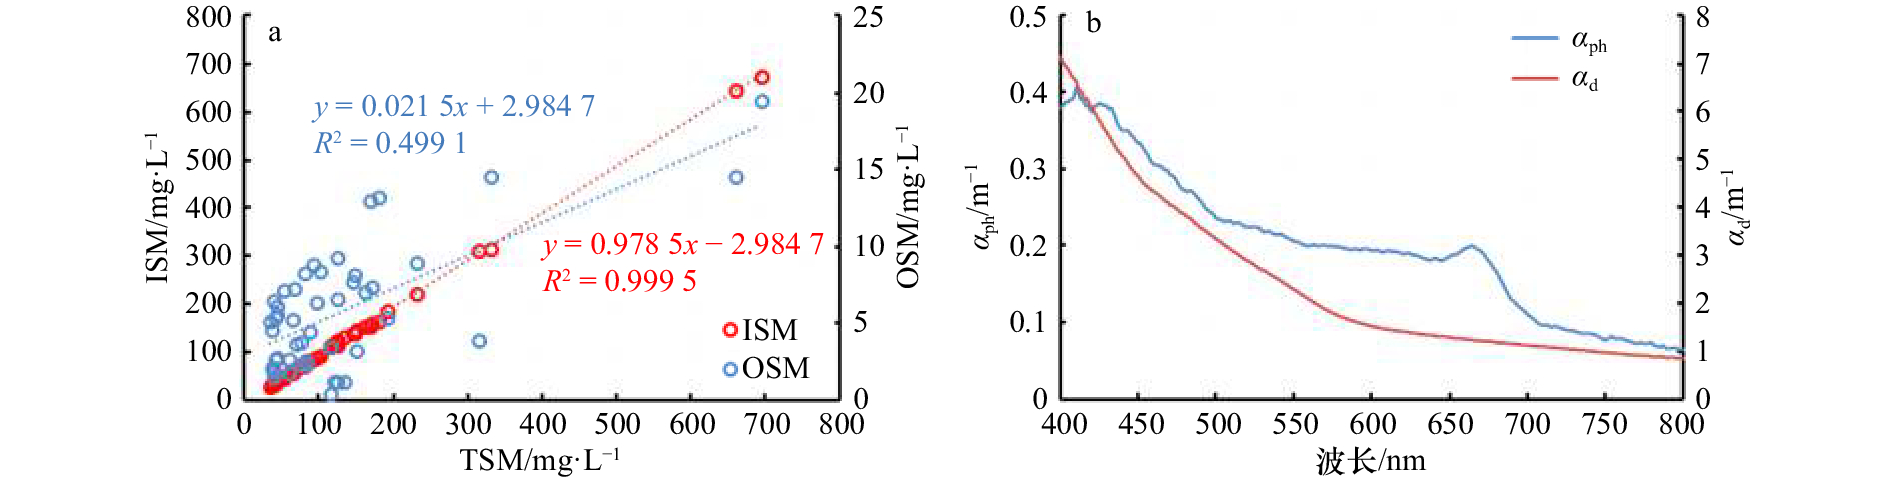
图 2 杭州湾悬浮物浓度特征(a)及颗粒物吸收特性分析(b)
Fig. 2 Characteristics of TSM (a) and absorption of suspended matter (b)
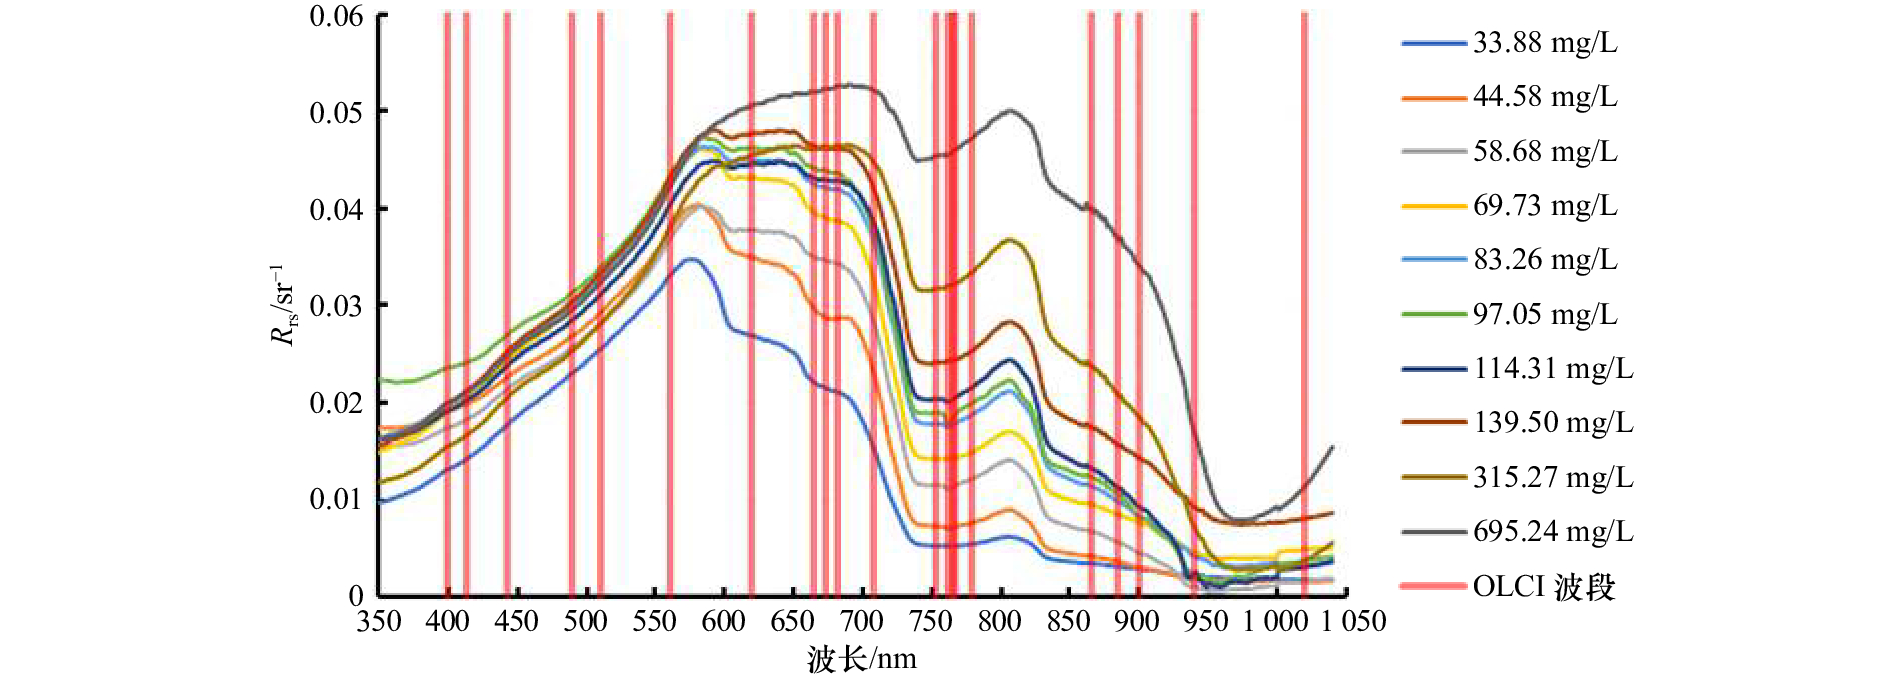
图 3 遥感反射率与悬浮物浓度关系示意
Fig. 3 The relationship between remote sensing reflectance and TSM

图 4 不同方法大气校正精度评价
Fig. 4 Evaluation of the accuracy of different atmospheric correction method
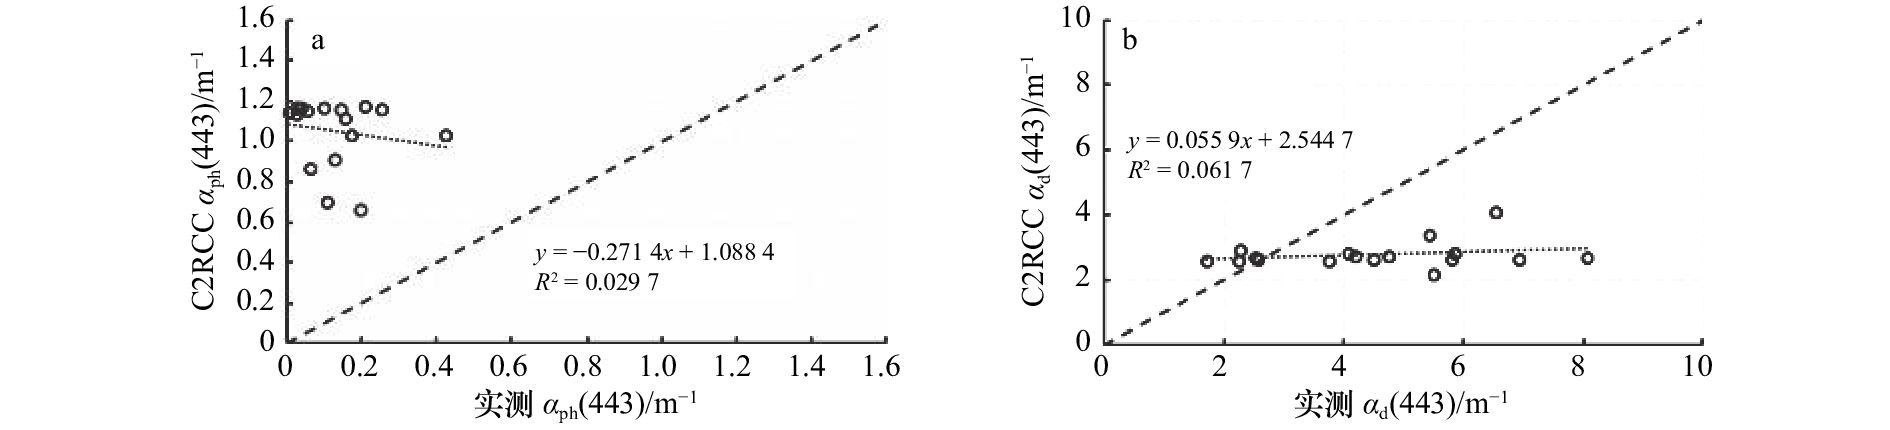
图 5 基于C2RCC算法所得aph(443) (a)和ad(443) (b)的估算结果与实测值对比
Fig. 5 The C2RCC-derived aph(443) (a) and ad(443) (b) are compared with in situ value, respectively

图 6 基于C2RCC算法和OLCI Level 2产品的TSM估算结果与实测值对比
Fig. 6 The C2RCC-derived TSM and OLCI Level 2 TSM are compared with measured TSM

图 7 基于UVAC和C2RCC算法的TSM空间分布
Fig. 7 Spatial distribution of TSM based on UVAC and C2RCC algorithm
表 1 不同大气校正方法逐波段MAPE误差统计
Tab. 1 Error statistics in each band of different atmospheric correction method
波段(中心波长) 6S Flaash C2RCC MUMM BPAC UVAC Oa1(400 nm) 174.43% 118.94% 61.67% 70.46% 56.30% 62.39% Oa2(413 nm) 96.66% 53.00% 59.45% 72.68% 54.33% 32.88% Oa3(443 nm) 77.79% 64.59% 58.32% 55.37% 44.26% 20.95% Oa4(490 nm) 46.07% 31.41% 53.83% 43.93% 34.07% 7.67% Oa5(510 nm) 37.06% 23.53% 52.09% 41.24% 30.31% 4.81% Oa6(560 nm) 18.02% 10.56% 48.45% 28.25% 21.97% 4.93% Oa7(620 nm) 16.22% 13.77% 38.58% 21.45% 18.55% 6.09% Oa8(665 nm) 23.08% 18.11% 50.24% 18.45% 17.46% 6.85% Oa9(674 nm) 23.08% 18.53% 55.52% 17.47% 17.40% 6.69% Oa10(681 nm) 23.83% 19.14% 53.93% 28.23% 17.05% 7.06% Oa11(709 nm) 28.64% 26.72% 27.51% 29.95% 18.65% 16.89% Oa12(754 nm) 78.99% 70.45% 45.68% 30.47% 37.70% 14.66% Oa16(779 nm) 70.60% 62.73% 42.46% 29.17% 39.26% 16.24% Oa17(865 nm) 116.25% 114.58% 64.91% 39.70% 57.22% 31.13% Oa18(885 nm) 128.84% 137.43% 66.74% 47.37% 62.38% 36.43%  下载: 导出CSV
表 2 SERT模型中的参数α和β
Tab. 2 The value of parameters α and β in SERT model
波长/nm α β 560 0.042 2 35.334 8 620 0.064 3 0.147 6 709 0.074 9 0.036 7 779 0.086 7 0.007 6
下载: 导出CSV
表 3 基于实测数据构建的各类最优反演模型及精度评价
Tab. 3 The various developed TSM retrieval algorithms and its accuracy assessment
模型 公式 自变量 R2 MAPE/% RMSE/mg·L−1 单波段 TSM = 10(27.761x + 1.421 2) Oa16 0.81 18.16 72.73 波段比值 TSM = 10(1.057 5x + 1.327 5) Oa16/Oa5 0.90 16.49 50.92 三波段 TSM = 10[2.049 2 + 9.686 4(x2 + x3)−0.149 8(x1/x2)] Oa1、Oa17、Oa18 0.87 18.87 65.88 多元回归 TSM=10(1.860 1 − 36.829 3x1 + 17.577 2x2 + 27.753 4x3) Oa5、Oa7、Oa12 0.91 17.79 42.87 SAI光谱指数 TSM = 10(1.827 7SAI + 1.007 2) Oa4、Oa6、Oa16 0.89 16.29 49.19 SERT — — — 24.56 62.07 3S TSM = −1 911.7x + 26.924 [Oa11−1−Oa12−1]−1 0.92 18.68 52.17 Nechad TSM = 910.02x − 7.624 7 Oa18/(0.093 − Oa18) 0.84 25.54 65.17
下载: 导出CSV
表 4 基于OLCI数据的模型精度评价
Tab. 4 The accuracy assessment of various developed TSM retrieval algorithms based on OLCI data
模型 斜率 截距 R2 MAPE/% RMSE/mg·L−1 单波段 0.58 21.97 0.93 23.43 31.02 波段比值 0.82 11.86 0.91 19.08 19.29 三波段 0.66 −11.78 0.85 53.39 49.94 多元回归 0.72 14.88 0.92 19.74 23.07 SAI光谱指数 0.93 12.07 0.91 22.23 18.68 SERT 0.78 −6.31 0.84 31.10 35.32 3S 0.82 23.45 0.87 30.84 22.41 Nechad 0.79 −3.53 0.83 33.73 33.83
下载: 导出CSV
表 5 模型在不同TSM浓度等级上的精度评价
Tab. 5 The performance of various developed TSM retrieval algorithms on different TSM level
模型 TSM<80 mg/L 80 mg/L≤TSM≤150 mg/L TSM>150 mg/L MAPE/% RMSE/mg·L−1 MAPE/% RMSE/mg·L−1 MAPE/% RMSE/mg·L−1 单波段 16.25 12.38 22.54 45.70 34.29 107.20 波段比值 14.71 10.97 14.60 22.94 21.35 68.46 三波段 18.23 12.60 17.73 31.76 24.52 77.42 多元回归 14.99 10.75 15.72 23.57 19.63 45.76 SAI光谱指数 17.26 13.19 14.49 23.24 20.94 51.45 SERT 25.53 17.22 26.07 59.43 34.67 81.86 3S 26.83 16.47 16.73 31.61 22.61 58.70 Nechad 26.74 16.71 26.79 51.70 31.58 78.43
下载: 导出CSV
表 6 模型敏感性分析
Tab. 6 The sensitivity analysis of three developed TSM retrieval algorithms
模型 MAPE/% RMSE/mg·L−1 范围 均值 范围 均值 波段比值 16.34~16.62 16.50 50.14~51.83 51.02 多元回归 50.99~62.23 55.88 108.66~182.18 141.75 SAI光谱指数 16.20~16.66 16.43 48.74~50.22 49.42
下载: 导出CSV
-
[1] Sun Deyong, Li Yunmei, Le Chengfeng, et al. A semi-analytical approach for detecting suspended particulate composition in complex turbid inland waters (China)[J]. Remote Sensing of Environment, 2013, 134: 92−99. doi: 10.1016/j.rse.2013.02.024 [2] Shi Kun, Zhang Yunlin, Zhu Guangwei, et al. Long-term remote monitoring of total suspended matter concentration in Lake Taihu using 250 m MODIS-Aqua data[J]. Remote Sensing of Environment, 2015, 164: 43−56. doi: 10.1016/j.rse.2015.02.029 [3] 刘王兵, 于之锋, 周斌, 等. 杭州湾HJ CCD影像悬浮泥沙遥感定量反演[J]. 遥感学报, 2013, 17(4): 905−918.Liu Wangbing, Yu Zhifeng, Zhou Bin, et al. Assessment of suspended sediment concentration at the Hangzhou Bay using HJ CCD imagery[J]. Journal of Remote Sensing, 2013, 17(4): 905−918. [4] 高永强, 高磊, 朱礼鑫, 等. 长江口及其邻近海域悬浮颗粒物浓度和粒径的时空变化特征[J]. 海洋学报, 2018, 40(3): 62−73. doi: 10.3969/j.issn.0253-4193.2018.03.006Gao Yongqiang, Gao Lei, Zhu Lixin, et al. Spatiotemporal variations in concentration and size of suspended particulate matter in the Changjiang (Yangtze River) Estuary and its adjacent sea[J]. Haiyang Xuebao, 2018, 40(3): 62−73. doi: 10.3969/j.issn.0253-4193.2018.03.006 [5] Xie Dongfeng, Gao Shu, Wang Zhengbing, et al. Numerical modeling of tidal currents, sediment transport and morphological evolution in Hangzhou Bay, China[J]. International Journal of Sediment Research, 2013, 28(3): 316−328. doi: 10.1016/S1001-6279(13)60042-6 [6] Shen Fang, Verhoef W, Zhou Yunxuan, et al. Satellite estimates of wide-range suspended sediment concentrations in Changjiang (Yangtze) estuary using MERIS data[J]. Estuaries and Coasts, 2010, 33(6): 1420−1429. doi: 10.1007/s12237-010-9313-2 [7] He Xianqiang, Bai Yan, Pan Delu, et al. Using geostationary satellite ocean color data to map the diurnal dynamics of suspended particulate matter in coastal waters[J]. Remote Sensing of Environment, 2013, 133: 225−239. doi: 10.1016/j.rse.2013.01.023 [8] 毕顺, 李云梅, 吕恒, 等. 基于OLCI数据的洱海叶绿素a浓度估算[J]. 湖泊科学, 2018, 30(3): 701−712.Bi Shun, Li Yunmei, Lv Heng, et al. Estimation of chlorophyll-a concentration in Lake Erhai based on OLCI data[J]. Journal of Lake Science, 2018, 30(3): 701−712. [9] 吴志明, 李建超, 王睿, 等. 基于随机森林的内陆湖泊水体有色可溶性有机物(CDOM)浓度遥感估算[J]. 湖泊科学, 2018, 30(4): 979−991.Wu Zhiming, Li Jianchao, Wang Rui, et al. Estimation of CDOM concentration in inland lake based on random forest using Sentinel-3A OLCI[J]. Journal of Lake Science, 2018, 30(4): 979−991. [10] 崔廷伟, 张杰, 马毅, 等. 渤海悬浮物分布的遥感研究[J]. 海洋学报, 2009, 31(5): 10−18.Cui Tingwei, Zhang Jie, Ma Yi, et al. The study on the distribution of suspended particulate matter in the Bohai Sea by remote sensing[J]. Haiyang Xuebao, 2009, 31(5): 10−18. [11] 余丹, 于之锋, 窦文洁, 等. 杭州湾冬季表层水体悬浮泥沙质量浓度的逐时变异[J]. 杭州师范大学学报: 自然科学版, 2014, 13(4): 373−379.Yu Dan, Yu Zhifeng, Dou Wenjie, et al. Hourly variability of surface suspended sediment concentration in Hangzhou Bay in winter[J]. Journal of Hangzhou Normal University: Natural Science Edition, 2014, 13(4): 373−379. [12] Li Yuan, Zhang Yunlin, Shi Kun, et al. Monitoring spatiotemporal variations in nutrients in a large drinking water reservoir and their relationships with hydrological and meteorological conditions based on Landsat 8 imagery[J]. Science of the Total Environment, 2017, 599−600: 1705−1717. doi: 10.1016/j.scitotenv.2017.05.075 [13] Mitchell B G. Algorithms for determining the absorption coefficient for aquatic particulates using the quantitative filter technique[J]. Proceedings of SPIE, 1990, 1302: 137−149. doi: 10.1117/12.21440 [14] 唐军武, 田国良, 汪小勇, 等. 水体光谱测量与分析Ⅰ: 水面以上测量法[J]. 遥感学报, 2004, 8(1): 37−44.Tang Junwu, Tian Guoliang, Wang Xiaoyong, et al. The methods of water spectra measurement and analysis I: above-water method[J]. Journal of Remote Sensing, 2004, 8(1): 37−44. [15] Li Yuan, Zhang Yunlin, Shi Kun, et al. Spatiotemporal dynamics of chlorophyll-a in a large reservoir as derived from Landsat 8 OLI data: understanding its driving and restrictive factors[J]. Environmental Science and Pollution Research, 2018, 25(2): 1359−1374. doi: 10.1007/s11356-017-0536-7 [16] Zheng Zhubin, Li Yunmei, Guo Yulong, et al. Landsat-based long-term monitoring of total suspended matter concentration pattern change in the wet season for Dongting Lake, China[J]. Remote Sensing, 2015, 7(10): 13975−13999. doi: 10.3390/rs71013975 [17] Ruddick K G, Ovidio F, Rijkeboer M. Atmospheric correction of SeaWiFS imagery for turbid coastal and inland waters[J]. Applied Optics, 2000, 39(6): 897−912. doi: 10.1364/AO.39.000897 [18] He Xianqiang, Bai Yan, Pan Delu, et al. Atmospheric correction of satellite ocean color imagery using the ultraviolet wavelength for highly turbid waters[J]. Optics Express, 2012, 20(18): 20754−20770. doi: 10.1364/OE.20.020754 [19] Toming K, Kutser T, Uiboupin R, et al. Mapping water quality parameters with Sentinel-3 ocean and land colour instrument imagery in the Baltic Sea[J]. Remote Sensing, 2017, 9(10): 1070. doi: 10.3390/rs9101070 [20] Moore G F, Aiken J, Lavender S J. The atmospheric correction of water colour and the quantitative retrieval of suspended particulate matter in Case II waters: Application to MERIS[J]. International Journal of Remote Sensing, 1999, 20(9): 1713−1733. doi: 10.1080/014311699212434 [21] Tassan S. An improved in-water algorithm for the determination of chlorophyll and suspended sediment concentration from Thematic Mapper data in coastal waters[J]. International Journal of Remote Sensing, 1993, 14(6): 1221−1229. doi: 10.1080/01431169308904406 [22] Zhang Minwei, Tang Junwu, Dong Qing, et al. Retrieval of total suspended matter concentration in the Yellow and East China Seas from MODIS imagery[J]. Remote Sensing of Environment, 2010, 114(2): 392−403. doi: 10.1016/j.rse.2009.09.016 [23] Mao Zhihua, Chen Jianyu, Pan Delu, et al. A regional remote sensing algorithm for total suspended matter in the East China Sea[J]. Remote Sensing of Environment, 2012, 124: 819−831. doi: 10.1016/j.rse.2012.06.014 [24] Liu Jia, Liu Jiahang, He Xianqiang, et al. Diurnal dynamics and seasonal variations of total suspended particulate matter in highly turbid Hangzhou Bay waters based on the geostationary ocean color imager[J]. IEEE Journal of Selected Topics in Applied Earth Observations and Remote Sensing, 2018, 11(7): 2170−2180. doi: 10.1109/JSTARS.2018.2830335 [25] Chen Jun, D'Sa E, Cui Tingwei, et al. A semi-analytical total suspended sediment retrieval model in turbid coastal waters: a case study in Changjiang River Estuary[J]. Optics Express, 2013, 21(11): 13018−13031. doi: 10.1364/OE.21.013018 [26] Nechad B, Ruddick K G, Park Y. Calibration and validation of a generic multisensor algorithm for mapping of total suspended matter in turbid waters[J]. Remote Sensing of Environment, 2010, 114(4): 854−866. doi: 10.1016/j.rse.2009.11.022 [27] 马骅. 高浊度长江河口水色三要素的光学特征及其对TSM反演的影响[D]. 上海: 华东师范大学, 2015.Ma Hua. The optical characteristics of the three elements in high turbidity water of the Yangtze River Estuary and its influence on the inversion of TSM[D]. Shanghai: East China Normal University, 2015. [28] 王珊珊, 王永波, 扶卿华, 等. 珠江口水体组分的吸收特性分析[J]. 环境科学, 2014, 35(12): 4511−4521.Wang Shanshan, Wang Yongbo, Fu Qinghua, et al. Spectral absorption properties of the water constituents in the estuary of Zhujiang River[J]. Environmental Science, 2014, 35(12): 4511−4521. [29] 乐成峰, 李云梅, 查勇, 等. 太湖梅梁湾水体组分吸收特性季节差异分析[J]. 环境科学, 2008, 29(9): 2448−2455. doi: 10.3321/j.issn:0250-3301.2008.09.011Le Chengfeng, Li Yunmei, Zha Yong, et al. Seasonal variation of in water constituents’ absorption properties in Meiliang Bay of Taihu Lake[J]. Environmental Science, 2008, 29(9): 2448−2455. doi: 10.3321/j.issn:0250-3301.2008.09.011 [30] Bai Yan, He Xianqiang, Pan Delu, et al. The extremely high concentration of suspended particulate matter in Changjiang Estuary detected by MERIS data[J]. Proceedings of SPIE, 2010, 7858: 78581D−78588D. doi: 10.1117/12.869632 [31] Bi Shun, Li Yunmei, Wang Qiao, et al. Inland water atmospheric correction based on turbidity classification using olci and slstr synergistic observations[J]. Remote Sensing, 2018, 10(7): 1002. doi: 10.3390/rs10071002 [32] Sun Deyong, Hu Chuanmin, Qiu Zhongfeng, et al. Reconstruction of hyperspectral reflectance for optically complex turbid inland lakes: test of a new scheme and implications for inversion algorithms[J]. Optics Express, 2015, 23(11): A718−A740. doi: 10.1364/OE.23.00A718 [33] Qiu Zhongfeng. A simple optical model to estimate suspended particulate matter in Yellow River Estuary[J]. Optics Express, 2013, 21(23): 27891−27904. doi: 10.1364/OE.21.027891 [34] 刘猛, 沈芳, 葛建忠, 等. 静止轨道卫星观测杭州湾悬浮泥沙浓度的动态变化及动力分析[J]. 泥沙研究, 2013(1): 7−13. doi: 10.3969/j.issn.0468-155X.2013.01.002Liu Meng, Shen Fang, Ge Jianzhong, et al. Diurnal variation of suspended sediment concentration in Hangzhou Bay from geostationary satellite observation and its hydrodynamic analysis[J]. Journal of Sediment Research, 2013(1): 7−13. doi: 10.3969/j.issn.0468-155X.2013.01.002 -

 点击查看大图
计量
- 文章访问数: 408
- HTML全文浏览量: 31
- PDF下载量: 312
- 被引次数: 0
