

Temporal and spatial properties of short-life oceanic eddies
-
摘要: 中尺度涡旋在海洋中分布广泛,是海洋动力、营养物质等混合和输运的重要途径。统计发现海洋中超过80%的涡旋生命周期不超过1个月,属于本文定义的短生命周期涡旋。本研究采用统计、对比等方法,对全球尺度,较短生命周期涡旋的时空分布特征进行了分析。研究表明,短生命周期涡旋与大洋中环流系统密切相关,其最易发生在暖流和寒流的交汇处以及运动方向相反的两种环流的交汇处,且在除30°S~30°N的热带地区外均表现为气旋式略多于反气旋式。低纬地区,短生命周期涡旋在每年的冷季数量较多,而高纬地区与之相反。除存在大规模东向环流的海域,短生命周期涡旋一般向西迁移,同时气旋式涡旋略倾向于赤道偏转,反气旋式略倾向于极地偏转。短生命周期涡旋的平均位移和平均迁移速率呈相似的赤道对称分布规律。Abstract: Mesoscale eddies are widely distributed in the ocean and play a significant role in the mixing and transporting of momentum and nutrients. Statistics suggest that more than 80% eddies’ lifetime are less than 1 month, belonging to the defined “short-life eddies” in this paper. This design adopt statistics and comparison, commit to having a earlier reasearch of global scale, short-life eddies. Results show that short-life eddies have a close correlation with ocean current. The most productive places for short-life eddies are those where warm and cold currents or two currents with opposite directions meet, and except in tropical areas of 30°S–30°N, the short-life eddies in other areas have a slight preference for cyclonic. Seasons with low temperature are favorable for short-life eddies in low latitudes, while seasons with high temperature are favorable in high latitudes. Short-life eddies tend to propagate westward in most of areas, however, they notable propagate eastward in eastward currents areas. Meridional deflection is quite messy, but with a tiny preference for equatorward and poleward deflections of cyclones and anticyclones, respectively. The distribution of average displacement and propagation velocity have similar regulation.
-
Key words:
- mesoscale eddies /
- short-life /
- spatial and temporal properties /
- propagation
-
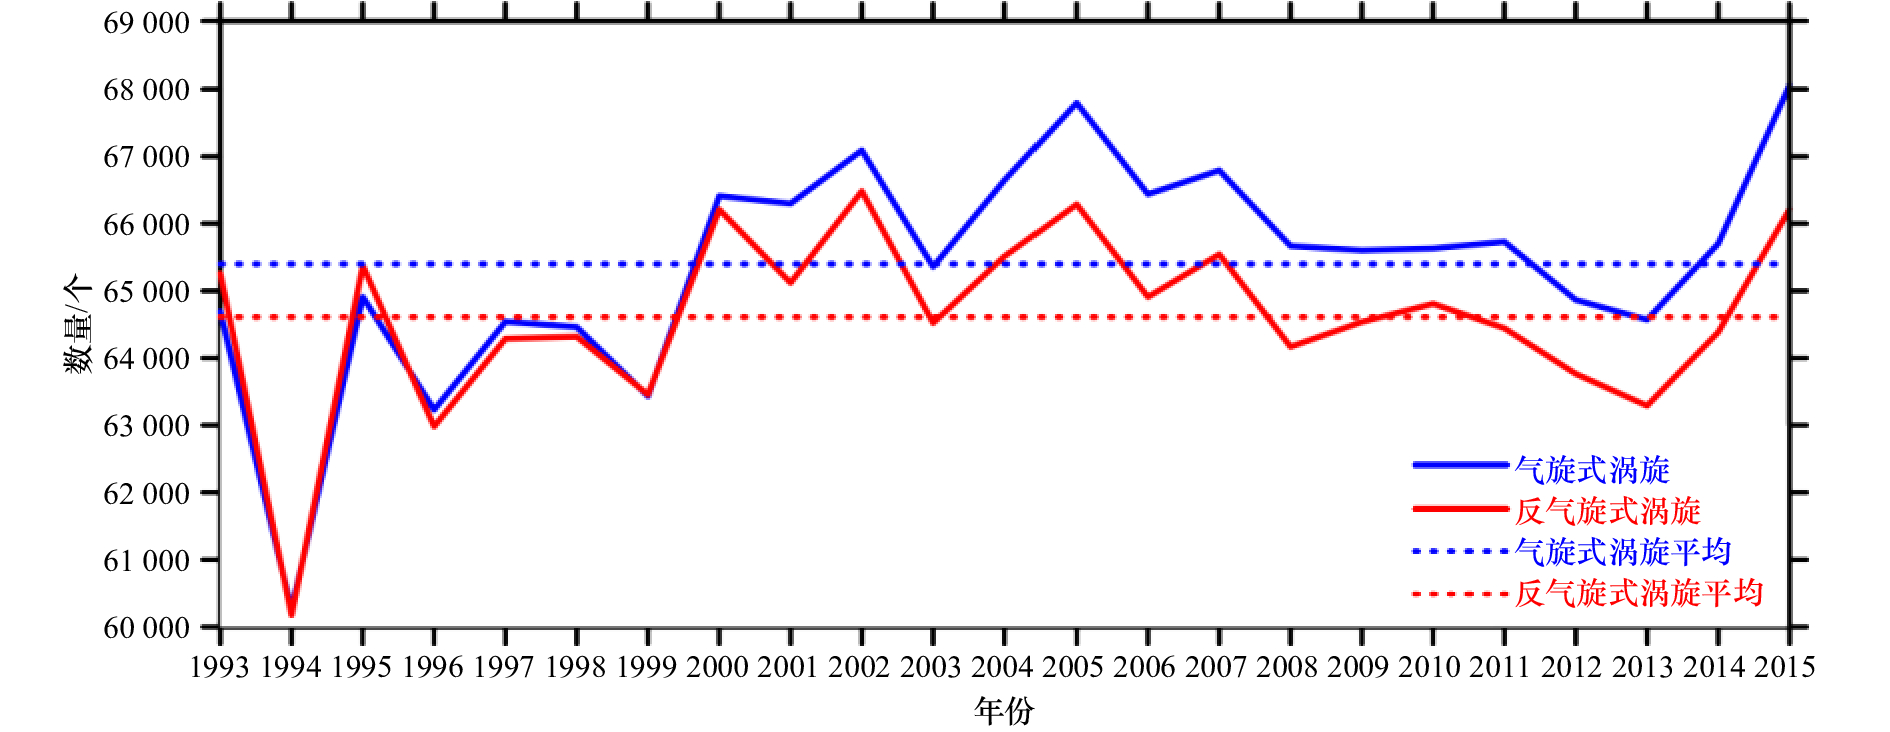
图 1 短生命周期涡旋数量
蓝色实线代表气旋式涡旋数量,红色实线代表反气旋式涡旋数量,蓝色虚线代表1993–2015年气旋式涡旋平均数量,红色虚线代表 1993–2015年反气旋式涡旋平均数量
Fig. 1 Numbers of short-life eddies
Blue solid line for numbers of cyclones, red solid line for numbers of anticyclones, blue dotted line for average number of cyclones from 1993 to 2015, red dotted line for average number of anticyclones from 1993 to 2015
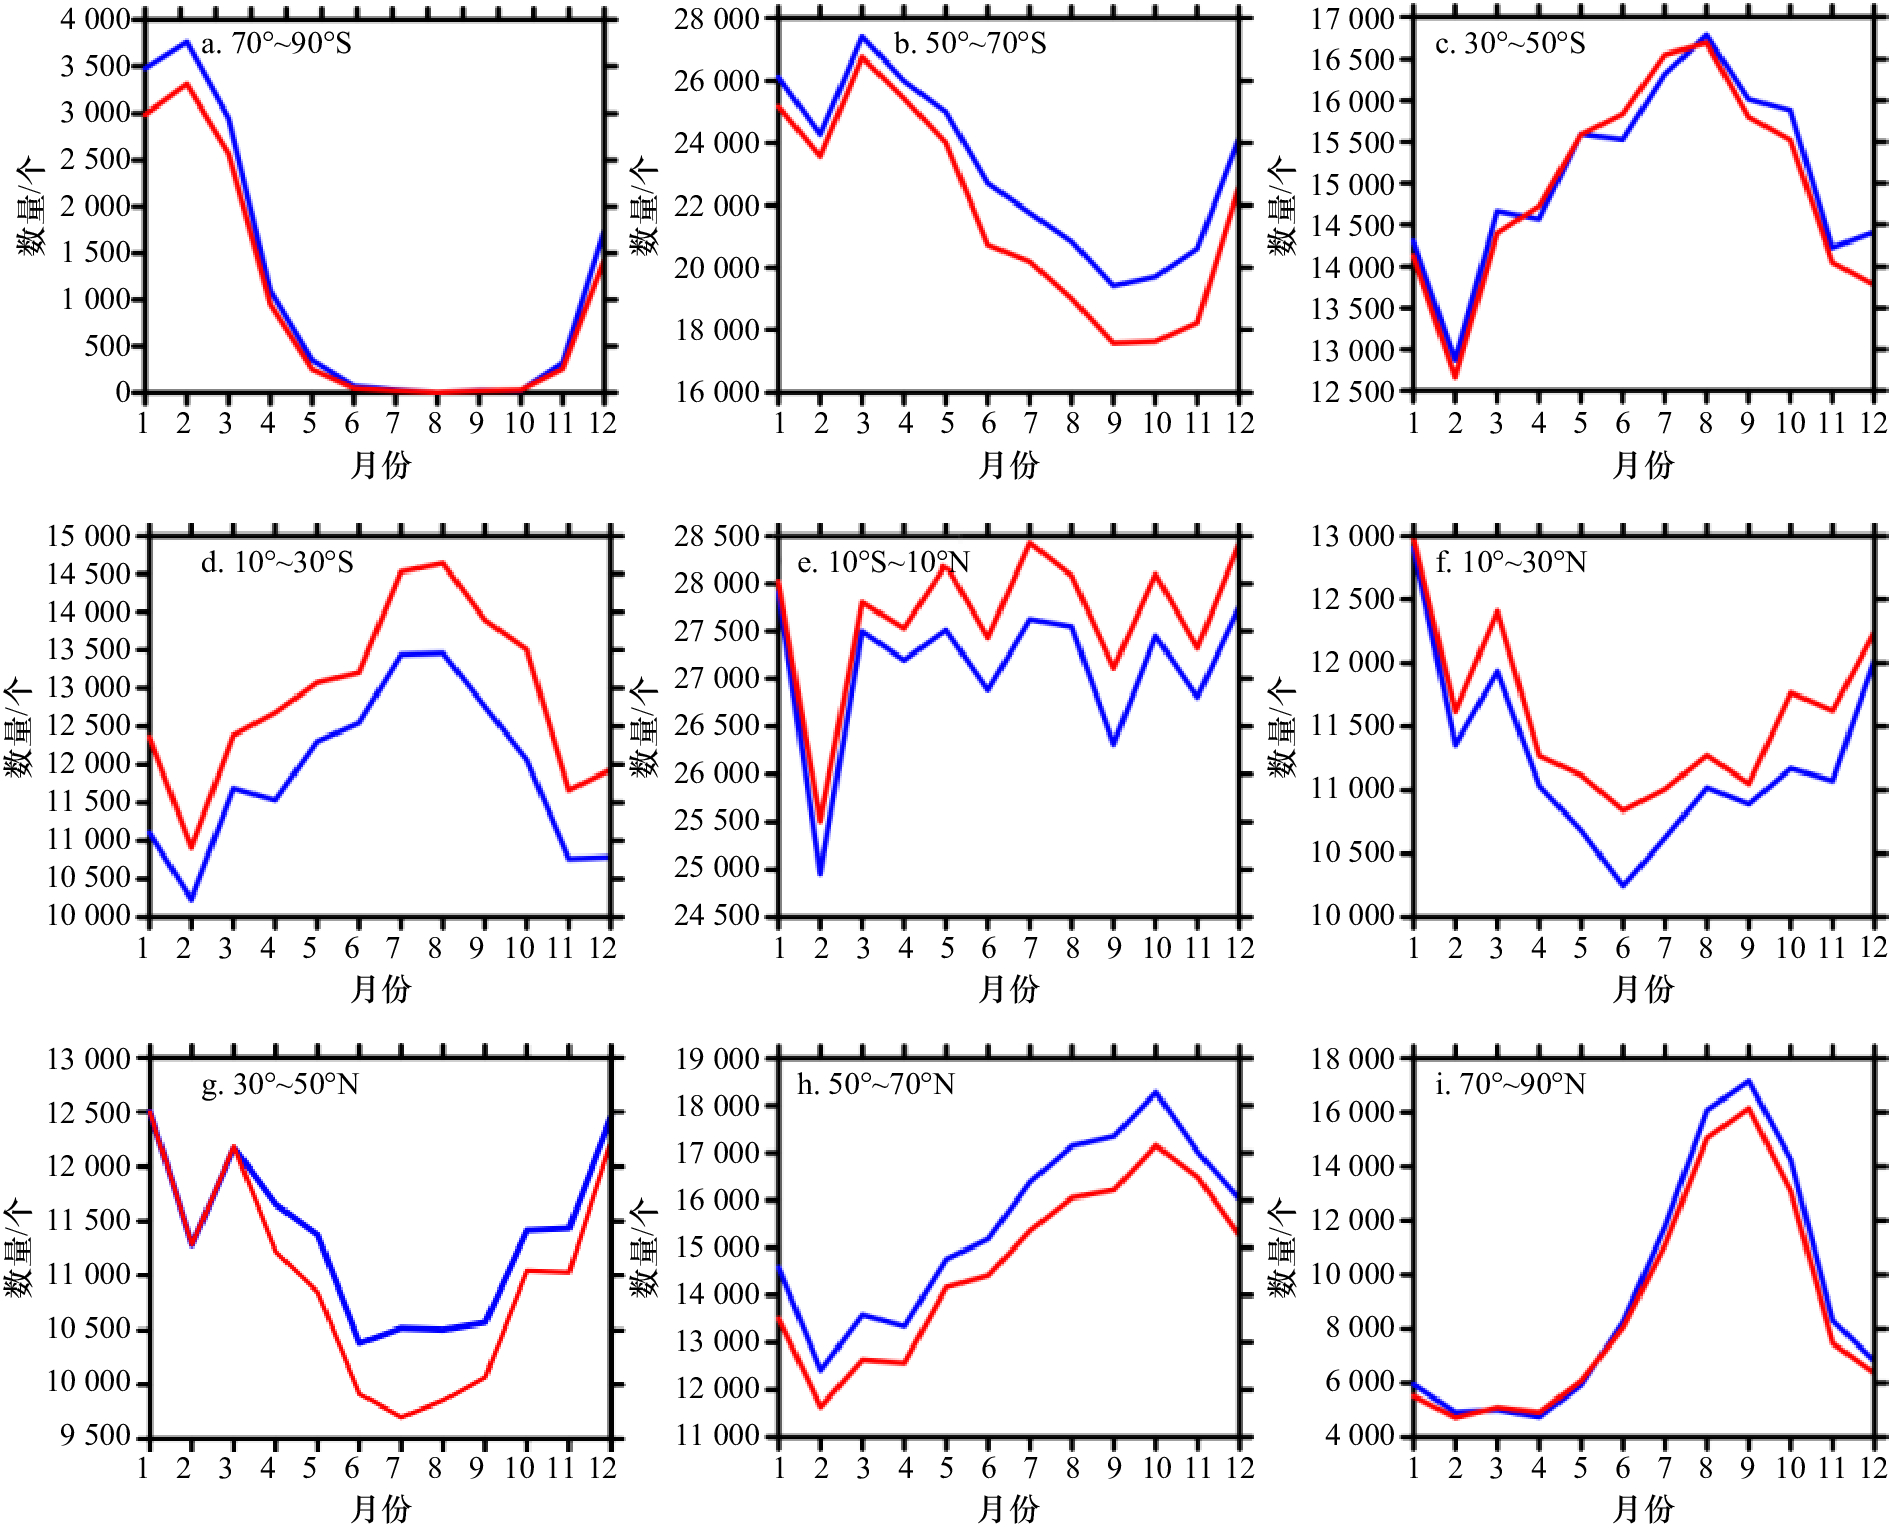
图 2 不同纬度带海域逐月产生短生命周期涡旋数量
蓝线代表气旋式涡旋数量,红线代表反气旋式涡旋数量。以涡旋产生时间、产生地点计数各个月份、各纬度带涡旋数量
Fig. 2 Short-life eddy numbers of different months or latitudes
Blue line for numbers of cyclones, red line for numbers of anticyclones. Eddy numbers counted by when and where it generated

图 3 涡旋全球发生地分布
a–d分别表示短生命周期气旋式、短生命周期反气旋式、长生命周期气旋式、长生命周期反气旋式涡旋发生地分布。采用5°×5°经纬度格网, 颜色柱代表每个格网中产生的涡旋数量占全球产生的涡旋总数百分比
Fig. 3 Generated distribution of eddies
a–d represent short-life cyclones, short-life anticyclones, long-life cyclones, and long-life anticyclones generated distribution, respectively. Using 5°×5° grid, color bar represents the percentage of eddies in each grid to total number
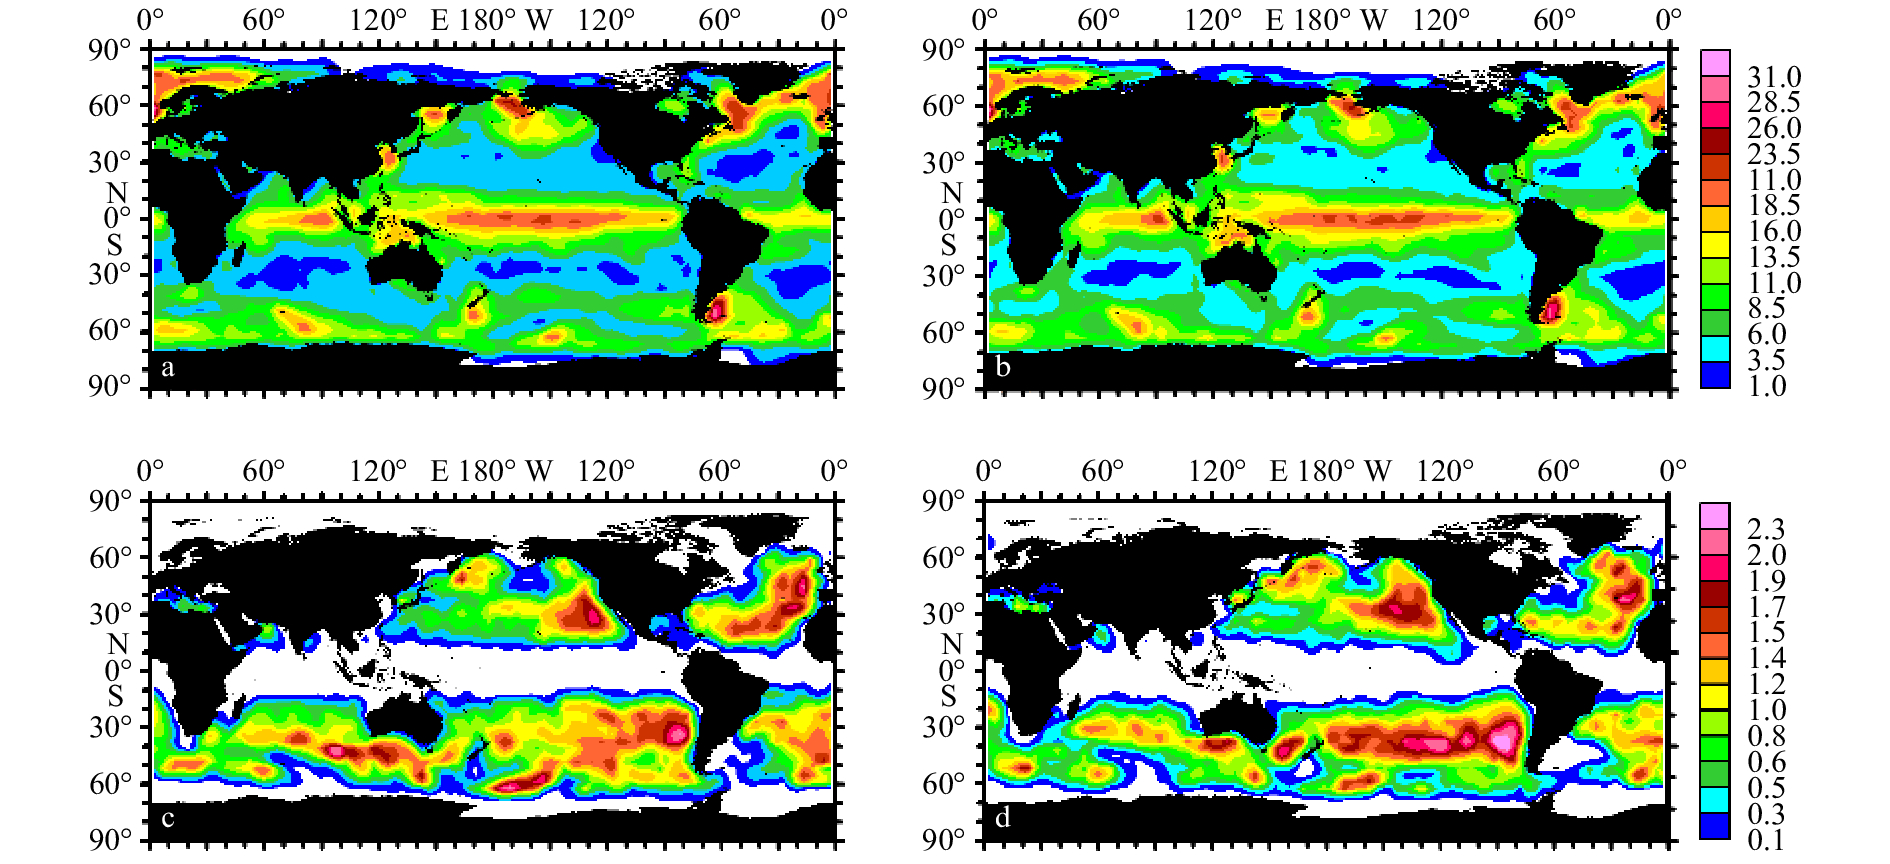
图 4 涡旋全球消散地分布
a–d分别表示短生命周期气旋式、短生命周期反气旋式、长生命周期气旋式、长生命周期反气旋式涡旋消散地分布。采用5°×5°经纬度格网, 颜色柱代表每个格网中消散的涡旋数量占全球消散的涡旋总数百分比
Fig. 4 Dissipated distribution of eddies
a–d represent short-life cyclones, short-life anticyclones, long-life cyclones, and long-life anticyclones dissipated distribution, respectively. Using 5°×5° grid, color bar represents the percentage of eddies in each grid to total number
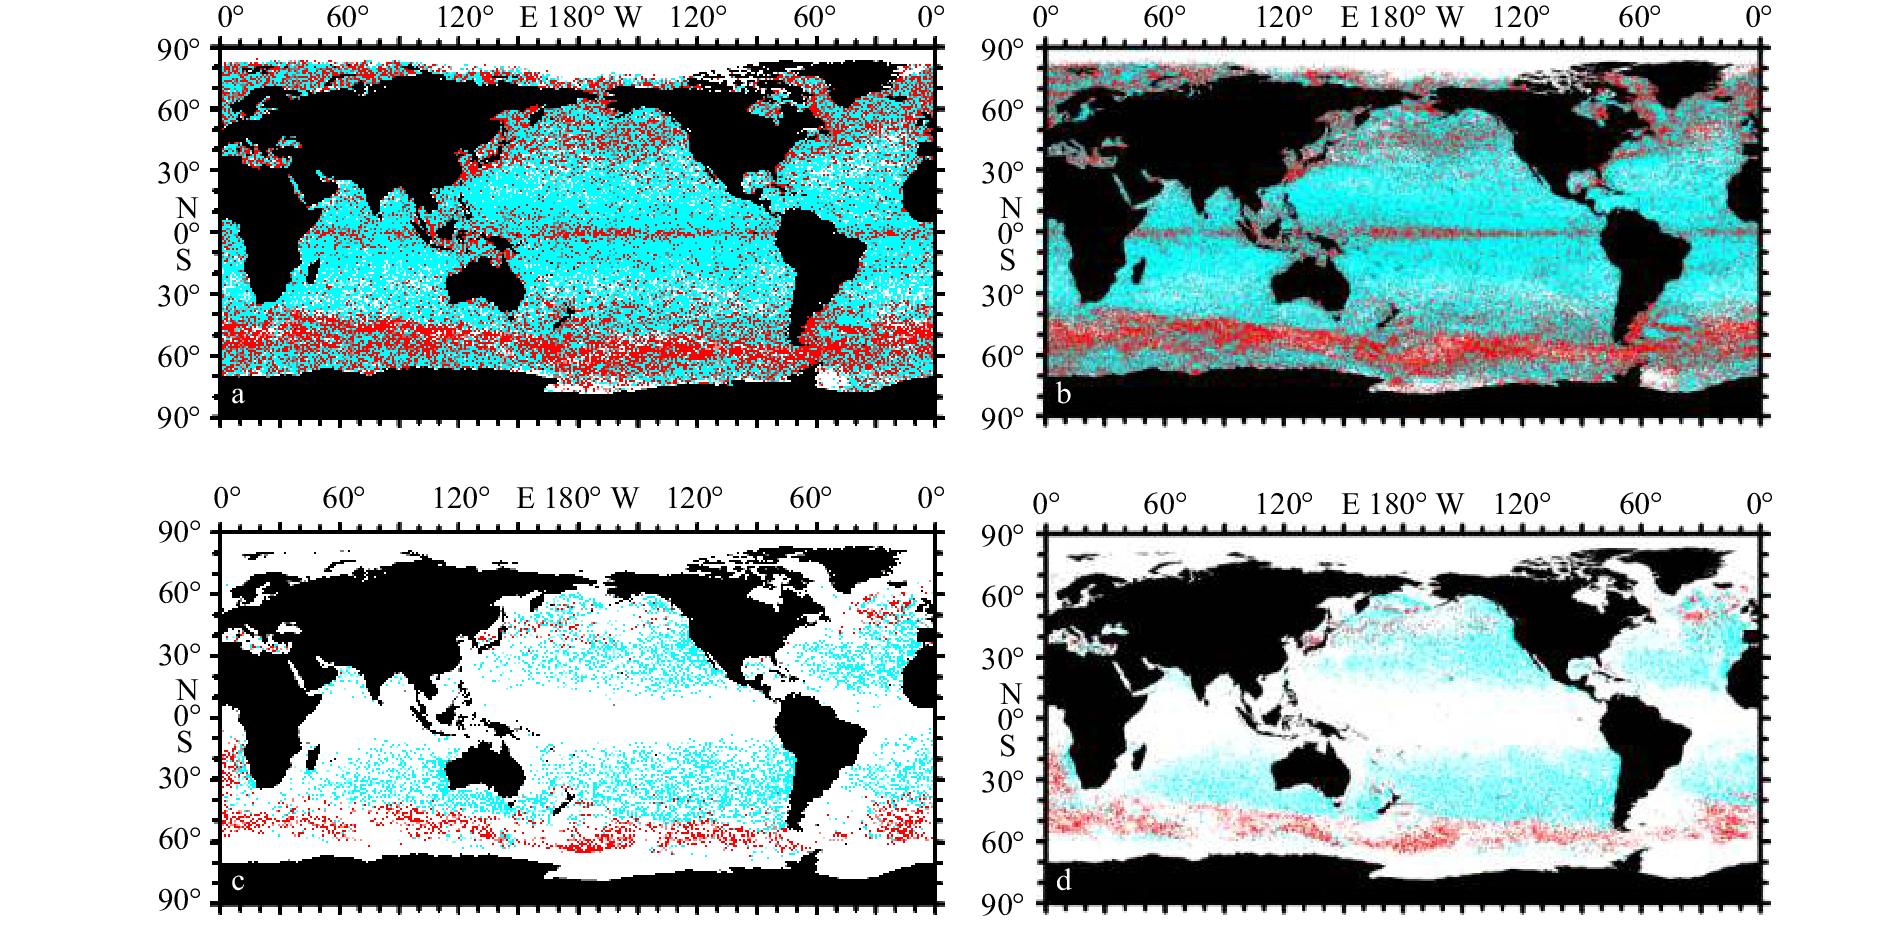
图 5 涡旋纬向迁移
每个蓝、红点分别代表1条向西、向东迁移涡旋的发生地。a–d分别表示短生命周期气旋式、短生命周期反气旋式、长生命周期气旋式、长生 命周期反气旋式涡旋纬向迁移
Fig. 5 Zonal propagation of eddies
Each blue or red dot represents the generated place for eddies of westward or eastward propagation, respectively. a–d represent short-life cyclones, short-life anticyclones, long-life cyclones, and long-life anticyclones zonal propagation, respectively

图 6 涡旋经向偏转
每个蓝、红点分别代表1条向极地、赤道偏转涡旋的发生地。a–d分别表示短生命周期气旋式、短生命周期反气旋式、长生命周期气旋式、长 生命周期反气旋式涡旋经向偏转
Fig. 6 Meridional propagation of eddies
Each blue or red dot represents the generated place for eddies of poleward or equatorward propagation, respectively. a–d represent short-life cyclones, short-life anticyclones, long-life cyclones, and long-life anticyclones meridional propagation, respectively

图 7 涡旋位移
a–d分别表示短生命周期气旋式、短生命周期反气旋式、长生命周期气旋式、长生命周期反气旋式涡旋位移量。采用5°×5°经纬度格网,颜色柱代表格网 中单个所有涡旋的平均位移量,以涡旋发生地计数单个格网中涡旋数量
Fig. 7 Eddy displacement
a–d represent short-life cyclones, short-life anticyclones, long-life cyclones, and long-life anticyclones generated displacement, respectively. Using 5°×5° grid, color bar represents the average displacement of each grid, eddy number in each grid is counted by its generation place

图 8 涡旋迁移速率
a–d分别表示短生命周期气旋式、短生命周期反气旋式、长生命周期气旋式、长生命周期反气旋式涡旋速率。采用5°×5°经纬度格网,颜色柱 代表单个格网中所有涡旋的平均迁移速率,以涡旋发生地计数单个格网中涡旋数量
Fig. 8 Eddy velocity
a–d represent short-life cyclones, short-life anticyclones, long-life cyclones, and long-life anticyclones velocity, respectively. Using 5°×5° grid, color bar represents the average velocity of each grid, eddy number in each grid is counted by its generation place
表 1 不同生命周期涡旋数量
Tab. 1 Eddy numbers of different lifetime
涡旋极性 短生命周期
(0~30 d)数量/个长生命周期
(>180 d)数量/个总量/个 气旋式 1 554 661 22 222 1 924 032 反气旋式 1 535 103 22 083 1 888 986  下载: 导出CSV
表 2 不同年际西、东向迁移涡旋所占比例
Tab. 2 Percentage of westward and eastward eddies in different years
旋涡类型 年际 西向/% 东向/% 气旋式涡旋 1993–1998年短生命周期 64.2 35.8 1999–2004年短生命周期 64.0 36.0 2005–2010年短生命周期 63.9 36.1 2011–2015年短生命周期 63.5 36.5 1993–2015年长生命周期 74.7 25.3 反气旋式涡旋 1993–1998年短生命周期 64.8 35.2 1999–2004年短生命周期 64.8 35.2 2005–2010年短生命周期 64.7 35.3 2011–2015年短生命周期 64.5 35.5 1993–2015年长生命周期 77.1 22.9
下载: 导出CSV
表 3 不同年际分别向赤道、向极地偏转涡旋所占比例
Tab. 3 Percentage of equatorward and poleward eddies in different years
涡旋类型 年际 向赤道方向/% 向极地方向/% 气旋式涡旋 1993–1998年短生命周期 50.5 49.5 1999–2004年短生命周期 50.6 49.4 2005–2010年短生命周期 50.5 49.5 2011–2015年短生命周期 50.7 49.3 1993–2015年长生命周期 56.8 43.2 反气旋式涡旋 1993–1998年短生命周期 49.9 50.1 1999–2004年短生命周期 49.9 50.1 2005–2010年短生命周期 49.8 50.2 2011–2015年短生命周期 49.9 50.1 1993–2015年长生命周期 64.8 35.2
下载: 导出CSV
表 4 不同年际涡旋平均位移
Tab. 4 Average displacement of eddies in different years
年际 气旋式涡旋
位移/km反气旋式涡旋
位移/km1993–1998年短生命周期涡旋 51.69 52.63 1999–2004年短生命周期涡旋 51.64 52.83 2005–2010年短生命周期涡旋 51.30 52.52 2011–2015年短生命周期涡旋 49.96 51.42 1993–2015年长生命周期涡旋 583.16 545.72 注:涡旋位移定义为涡旋发生地到消散地之间的直线距离。
下载: 导出CSV
表 5 不同年际涡旋平均迁移速率
Tab. 5 Average velocity of eddies in different years
年际 气旋式涡旋
迁移速率/km·d–1反气旋式涡旋
迁移速率/km·d–11993–1998年短生命周期涡旋 7.58 7.69 1999–2004年短生命周期涡旋 7.58 7.72 2005–2010年短生命周期涡旋 7.55 7.68 2011–2015年短生命周期涡旋 7.35 7.51 1993–2015年长生命周期涡旋 2.18 1.97 注:涡旋迁移速率定义为涡旋位移与其存活天数之比。
下载: 导出CSV
-
[1] Faghmous J H, Frenger I, Yao Y, et al. A daily global mesoscale ocean eddy dataset from satellite altimetry[J]. Scientific Data, 2015, 2: 150028. doi: 10.1038/sdata.2015.28 [2] 程旭华, 齐义泉. 基于卫星高度计观测的全球中尺度涡的分布和传播特征[J]. 海洋科学进展, 2008(4): 447−453. doi: 10.3969/j.issn.1671-6647.2008.04.005Cheng Xuhua, Qi Yiquan. Distribution and propagation of mesoscale eddies in the global oceans learnt from altimetric data[J]. Advances in Marine Science, 2008(4): 447−453. doi: 10.3969/j.issn.1671-6647.2008.04.005 [3] Sun M, Tian F, Liu Y, et al. An improved automatic algorithm for global eddy tracking using satellite altimeter data[J]. Remote Sensing, 2017, 9(3): 206. doi: 10.3390/rs9030206 [4] Liu Y, Chen G, Sun M, et al. A parallel SLA-Based algorithm for global mesoscale eddy identification[J]. Journal of Atmospheric and Oceanic Technology, 2016, 33(12): 2743−2754. doi: 10.1175/JTECH-D-16-0033.1 [5] Chelton D B, Schlax M G, Samelson R M, et al. Global observations of large oceanic eddies[J]. Geophysical Research Letters, 2007, 34(15): L15606. [6] Chelton D B, Schlax M G, Samelson R M. Global observations of nonlinear mesoscale eddies[J]. Progress in Oceanography, 2011, 91(2): 167−216. doi: 10.1016/j.pocean.2011.01.002 [7] 郑全安. 遥感在海洋中尺度涡漩研究中的应用及卫星照片实例解译[J]. 海洋学报, 1979, 1(2): 342−357.Zheng Quanan. The application of remote sensing to mesoscale eddies and satellite photos’ interpretation[J]. Haiyang Xuebao, 1979, 1(2): 342−357. [8] 李佳讯, 陈奕德, 陈符森. AVISO卫星高度计新版产品改进对南海海洋学研究的影响[J]. 海洋预报, 2016, 33(2): 74−80. doi: 10.11737/j.issn.1003-0239.2016.02.011Li Jiaxun, Chen Yide, Chen Fusen. Impact of the new version of AVISO satellite altimeter data on the study of physical oceanography in the South China Sea[J]. Marine Forecasts, 2016, 33(2): 74−80. doi: 10.11737/j.issn.1003-0239.2016.02.011 [9] Sandery P A, Sakov P. Ocean forecasting of mesoscale features can deteriorate by increasing model resolution towards the submesoscale[J]. Nature Communications, 2017, 8(1): 1566. doi: 10.1038/s41467-017-01595-0 [10] 林鹏飞, 王凡, 陈永利, 等. 南海中尺度涡的时空变化规律Ⅰ. 统计特征分析[J]. 海洋学报, 2007, 29(3): 14−22. doi: 10.3321/j.issn:0253-4193.2007.03.002Lin Pengfei, Wang Fan, Chen Yongli, et al. Temporal and spatial variation characteristics on eddies in the South China Sea Ⅰ. Statistical analyses[J]. Haiyang Xuebao, 2007, 29(3): 14−22. doi: 10.3321/j.issn:0253-4193.2007.03.002 [11] 杜云艳, 王丽敬, 樊星, 等. 基于GIS的南海中尺度涡旋典型过程的特征分析[J]. 海洋科学, 2014, 38(1): 1−9. doi: 10.3969/j.issn.1671-6647.2014.01.001Du Yunyan, Wang Lijing, Fan Xing, et al. GIS-based analysis on temporal-spatial features of typical process of meso-scale eddies in the South China Sea[J]. Marine Science, 2014, 38(1): 1−9. doi: 10.3969/j.issn.1671-6647.2014.01.001 [12] Zhang Z, Wang W, Qiu B. Oceanic mass transport by mesoscale eddies[J]. Science, 2014, 345(6194): 322−324. doi: 10.1126/science.1252418 [13] Benitez-Nelson C R, Bidigare R R, Dickey T D, et al. Mesoscale eddies drive increased silica export in the subtropical Pacific Ocean[J]. Science, 2007, 316: 1017−1022. doi: 10.1126/science.1136221 [14] Dong C, Mcwilliams J C, Liu Y, et al. Global heat and salt transports by eddy movement[J]. Nature Communications, 2014, 5: 3294. doi: 10.1038/ncomms4294 [15] Zhang Y, Liu Z, Zhao Y, et al. Mesoscale eddies transport deep-sea sediments[J]. Scientific Reports, 2015, 4(1): 5937. doi: 10.1038/srep05937 [16] Xu C, Shang X D, Huang R X. Horizontal eddy energy flux in the world oceans diagnosed from altimetry data[J]. Scientific Reports, 2014, 4: 5316. [17] Zhong Y, Bracco A, Tian J, et al. Observed and simulated submesoscale vertical pump of an anticyclonic eddy in the South China Sea[J]. Scientific Reports, 2017, 7: 44011. doi: 10.1038/srep44011 [18] Zhang Z, Tian J, Qiu B, et al. Observed 3D structure, generation, and dissipation of oceanic mesoscale eddies in the South China Sea[J]. Scientific Reports, 2016, 6(1): 24349. doi: 10.1038/srep24349 [19] Dufois F, Hardman-Mountford N J, Greenwood J, et al. Anticyclonic eddies are more productive than cyclonic eddies in subtropical gyres because of winter mixing[J]. Science Advances, 2016, 2(5): e1600282. doi: 10.1126/sciadv.1600282 -

 点击查看大图
计量
- 文章访问数: 347
- HTML全文浏览量: 23
- PDF下载量: 182
- 被引次数: 0
