

Research on the variability of Brazil-Malvinas Confluence and its cause
-
摘要: 西南大西洋的马尔维纳斯寒流(Malvinas Current,MC)和巴西暖流(Brazil Current,BC)交汇点(the Brazil-Malvinas Confluence,BMC)的南移是很多影响因子共同作用的结果。本文从海流流量的变化和风场的变化来分析交汇点变动的原因。利用1993年1月至2016年12月的月平均流场计算截面流量,分析得到MC流量呈现递减趋势,而BC流量则出现递增趋势。2014–2016年的Argo浮标的轨迹线表明MC的水体主要来自于南极绕极流(Antarctic Circumpolar Current,ACC)经过德雷克海峡的3个极锋中的其中之一—亚南极锋(the Subantarctic Front,SAF)。计算SAF的流量,得到其也表现出递减的趋势,这是MC流量减少的重要原因。而和SAF相邻位于其南边的极锋(the Polar Front,PF)的流量出现递增趋势。利用1993–2016年月平均风场数据分析得到南半球盛行西风风应力增加且有向南极偏移的趋势,这会使得ACC也有向南极收缩的趋势,这解释了SAF流量减少而PF的流量增加的原因,故得到南半球盛行西风的南移和BC流量的增加是BMC南移的原因。Abstract: The Brazil-Malvinas Confluence (BMC) may have a southward shift in a long time trend and many marine factors’ change may cause this drift. We analysis this phenomenon from two aspects: the changes of currents’ volume transport, and the winds’ alternation. Using the monthly mean flow field between 1993 and 2016 to calculate the cross-sectional water transport volume, the results show that the transport change trend of the Malvinas Current (MC) is decreasing and the transport change trend of the Brazil Current (BC) is increasing. The trajectory of the Argo buoy during 2014–2016 indicates that the MC’s water mainly comes from one of the three polar fronts of ACC (Antarctic Circumpolar Current) when passing through the Drake Passage: SAF (the Subantactic Front). Calculating and analyzing the transport of SAF, we find that the transport’s trend of SAF is lessened, which is an important reason caused the reduce of MC’s transport. We also find that the PF’s transport on the south SAF has incremental trend. Based on the monthly mean wind field data during year 1993–2016, we find that the prevailing westerly wind stress in the Southern Hemisphere is growing and moves toward to Antarctic which will make ACC contract to Antarctica. So we can explain that the transport of SAF reduces while the transport of PF increases. Therefore, it is found that the southward movement of the prevailing westerly winds in the Southern Hemisphere and the increase of BC transport are the reasons for the southward drift of BMC.
-
Key words:
- wind stress /
- confluence /
- transport /
- Argo
-

图 1 研究区范围及水深地形图
蓝色实线代表–300 m等深线,绿色实线代表–1 500 m等深线,黄色 实线代表–3 000 m等深线
Fig. 1 Study area and bathymetric topography
The blue lines mean –300 m depth contour, the green lines mean –1 500 m depth contour, the yellow lines mean –3 000 m depth contour
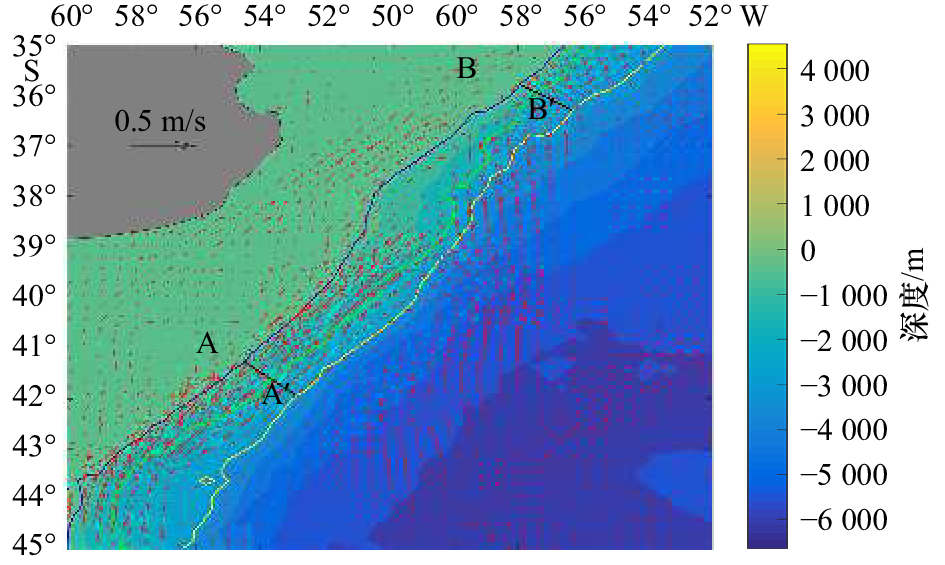
图 2 MC和BC交汇处的平均流场分布
黑色粗实线分别为截面A-A′和B-B′,图中的背景流场为1993年 1月至2016年12月,从表层至底层的平均流速场
Fig. 2 Average flow field distribution at the junction of MC and BC
The thick black solid lines mean the locations of section A-A′ and B-B′. The red arrows mean the average flow field from sea surface to bottom during 1993–2016
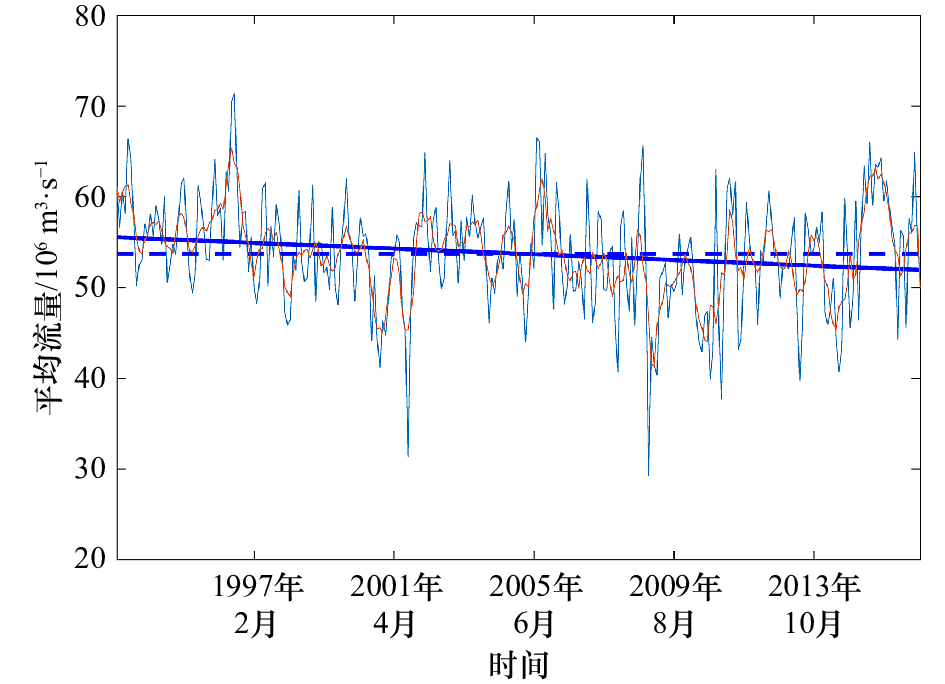
图 3 MC月平均流量逐月分布(1993–2016年)
Fig. 3 Monthly mean transport variation of MC during 1993–2016
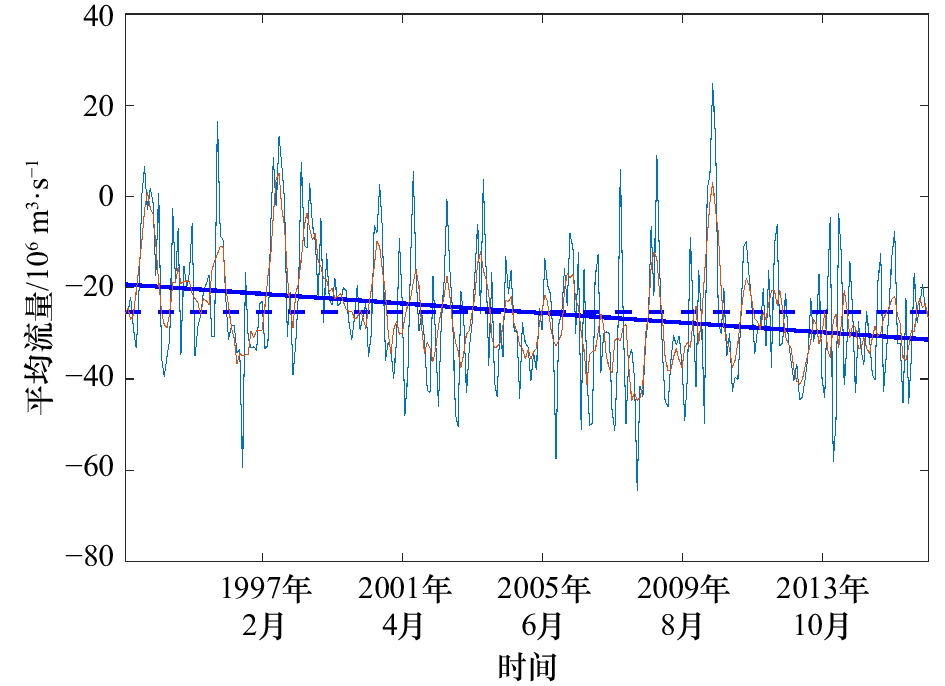
图 4 BC月平均流量逐月分布(1993–2016年)(流量北向为正,南向为负)
Fig. 4 Monthly mean transport variation of BC during 1993–2016(the northward transport is set to positive and the southward transport is set to negative)
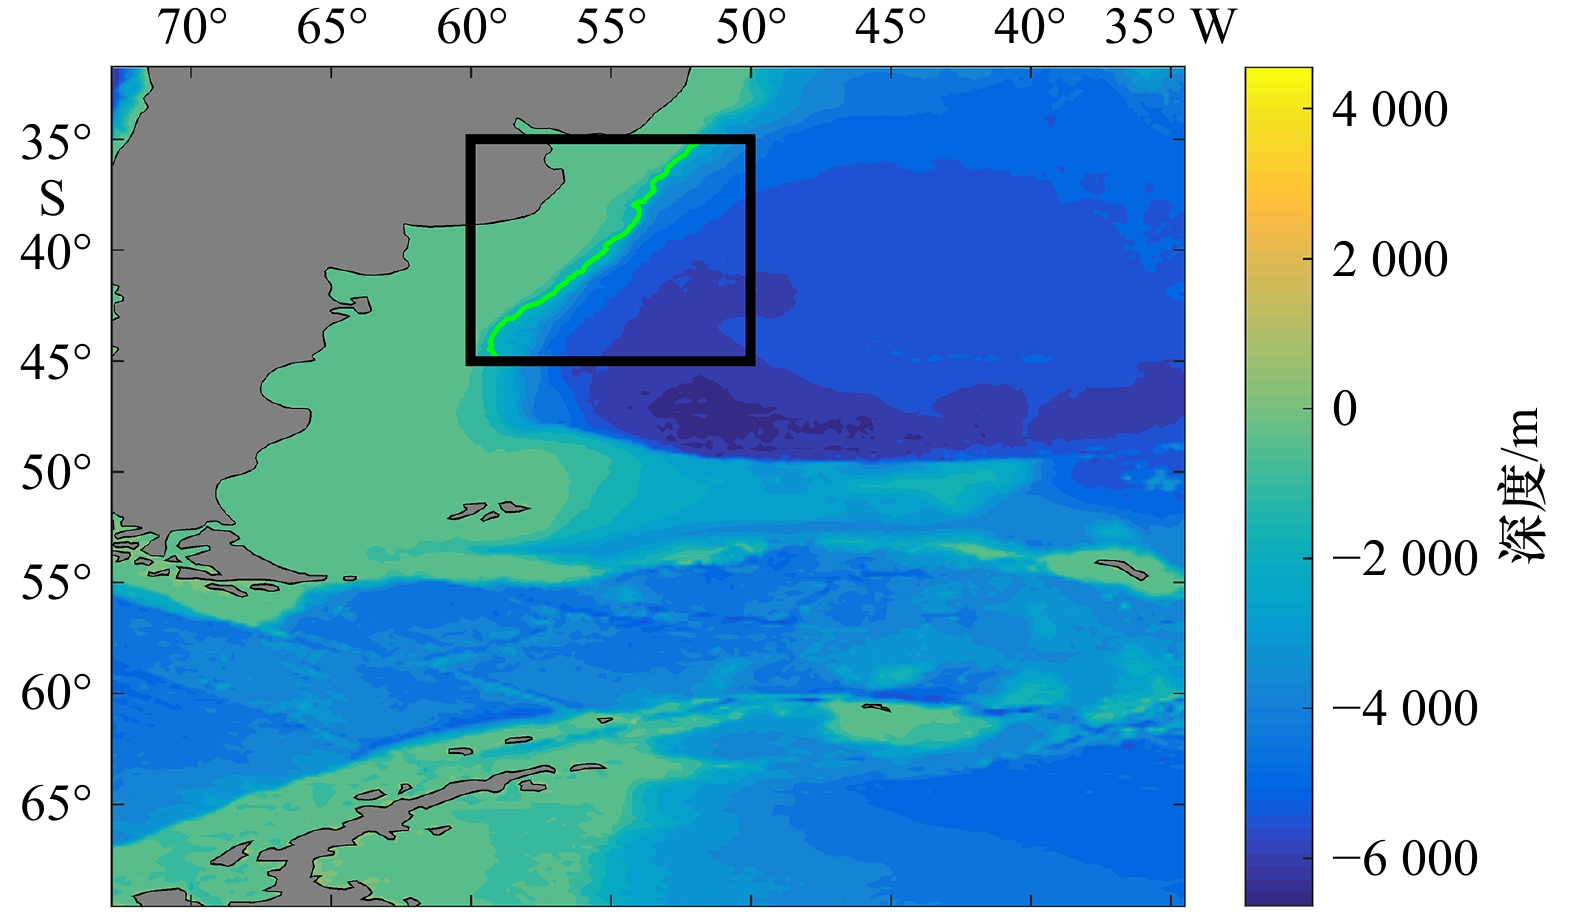
图 5 用于计算速度截面的–1 500 m等深线
Fig. 5 –1 500 m depth contour used for calculating the velocity section
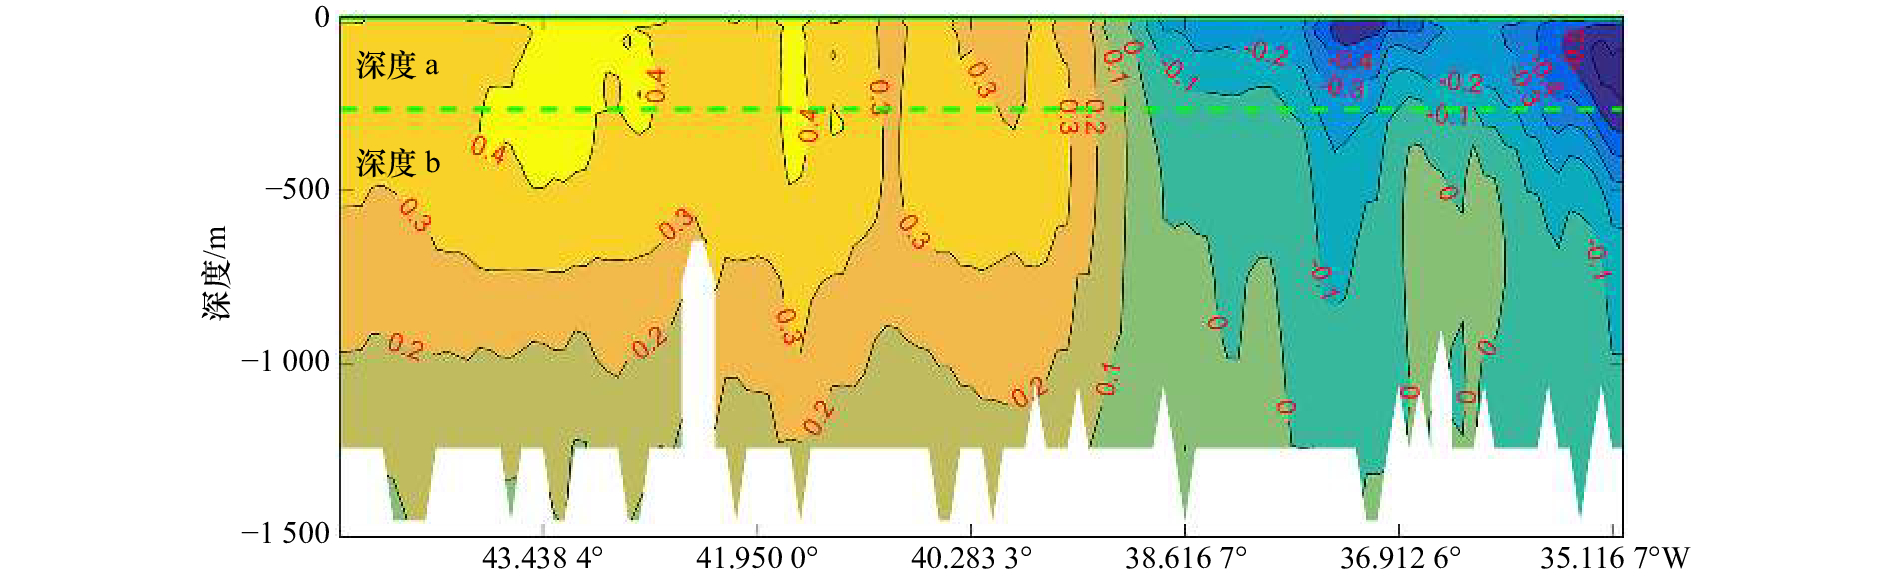
图 6 等值线截面上的平均经向速度分量v的分布(绿色虚线代表计算MBC的深度)
Fig. 6 Distribution of average meridional velocity component v on the section of 1 500 m depth contour (the green dashed line means the detph of calculating MBC)
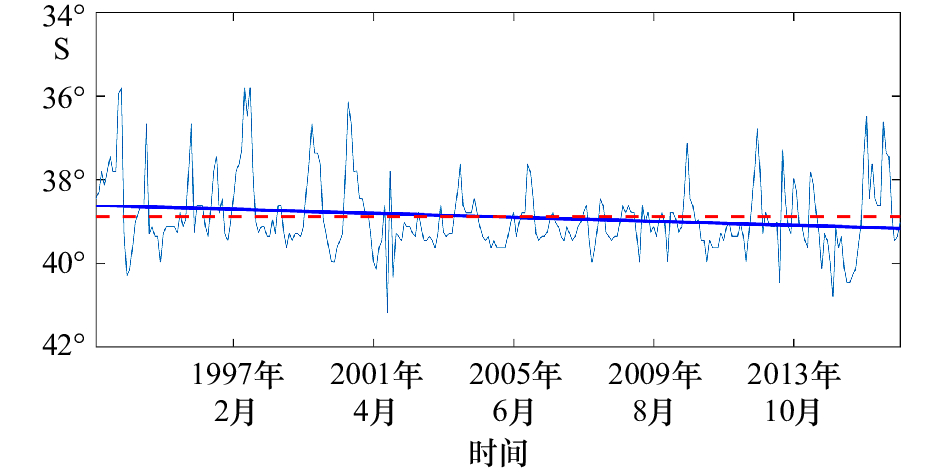
图 7 沿深度a计算的BMC的逐月分布(1993–2016年)
Fig. 7 Varations of BMC calculated along depth a with month during 1993–2016

图 8 沿深度b计算的BMC的逐月分布(1993–2016年)
Fig. 8 Varations of BMC calculated along depth b with month during 1993–2016
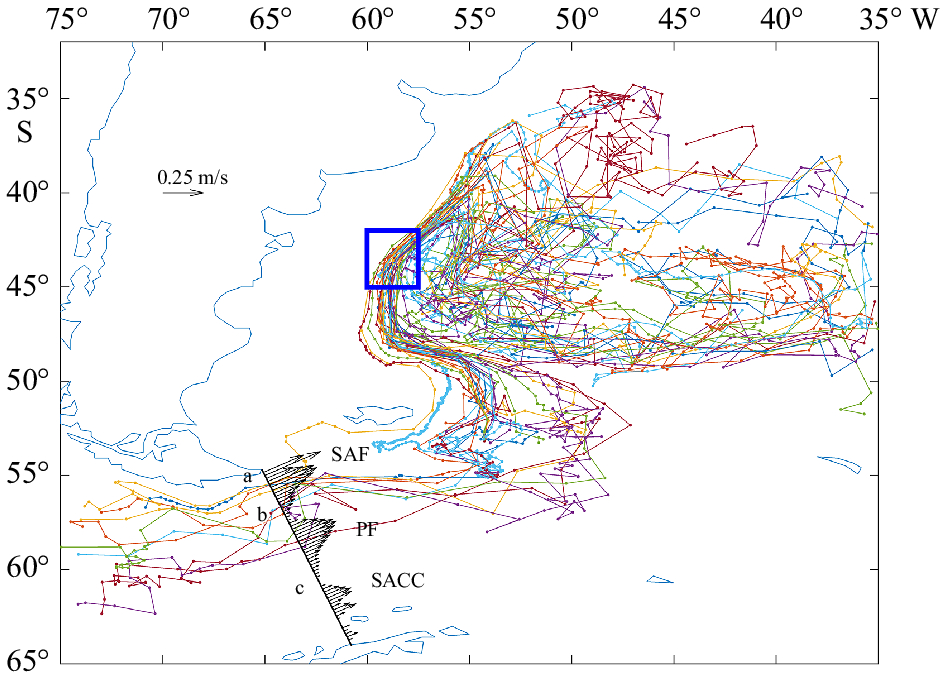
图 9 经过MC(图中的蓝色矩形)的Argo轨迹(2014–2016年)
Fig. 9 Trajectories of Argo floats through the MC (the blue box in the figure) during 2014–2016
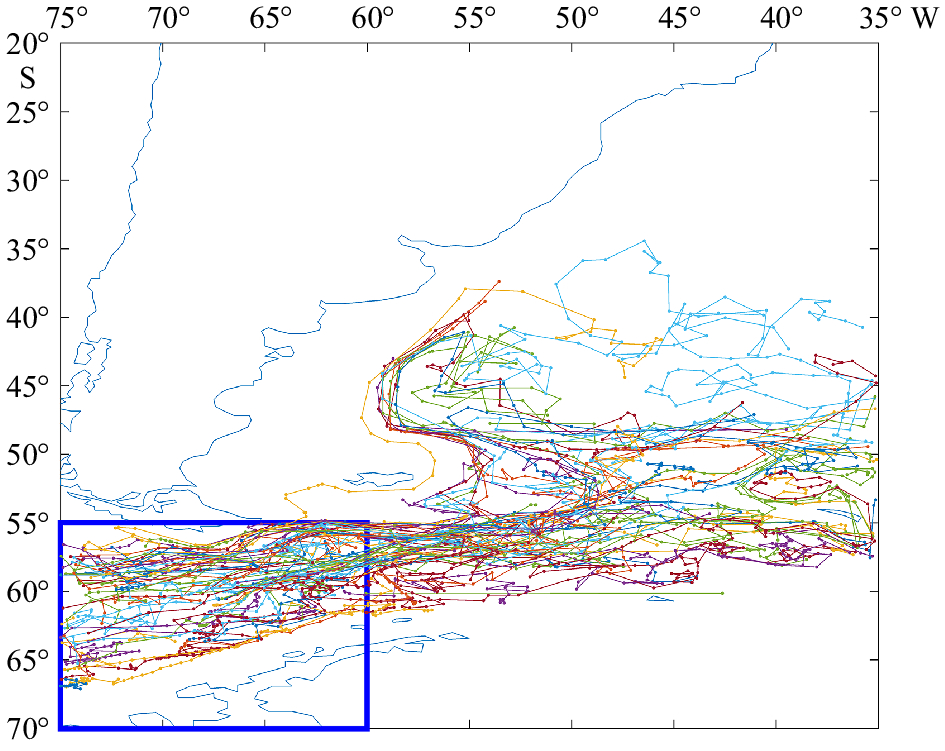
图 10 经过德雷克海峡的Argo浮标轨迹(2014–2016年)
Fig. 10 Trajectories of Argo floats through the Drake Passage during 2014–2016
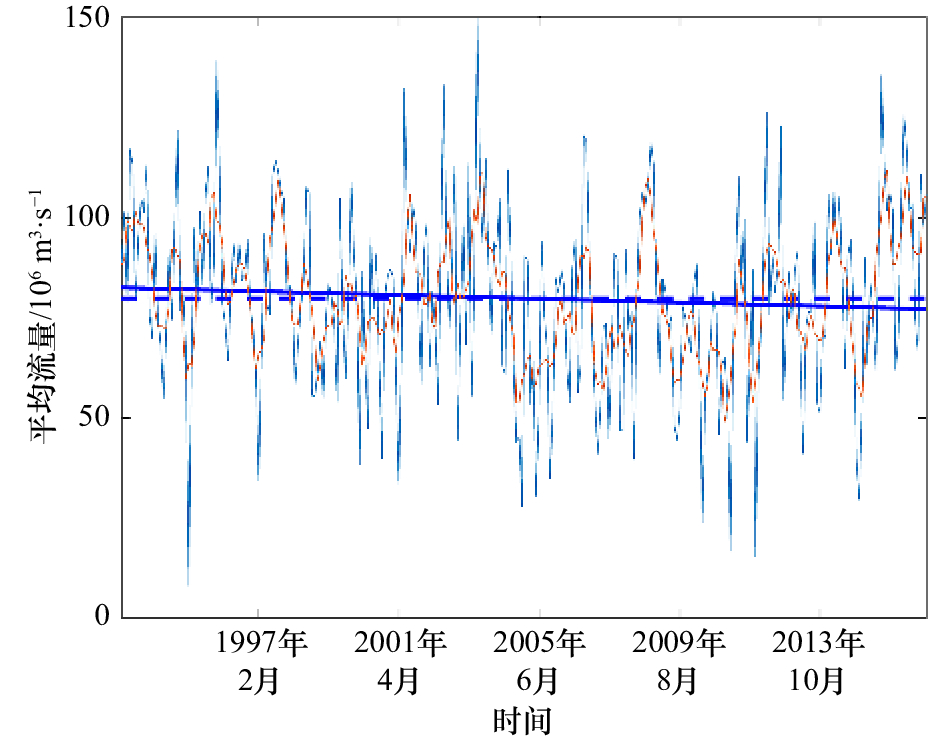
图 11 ACC经过德雷克海时的SAF的流量逐月分布(1993–2016年)
Fig. 11 Monthly mean transport variation of SAF in ACC during 1993–2016
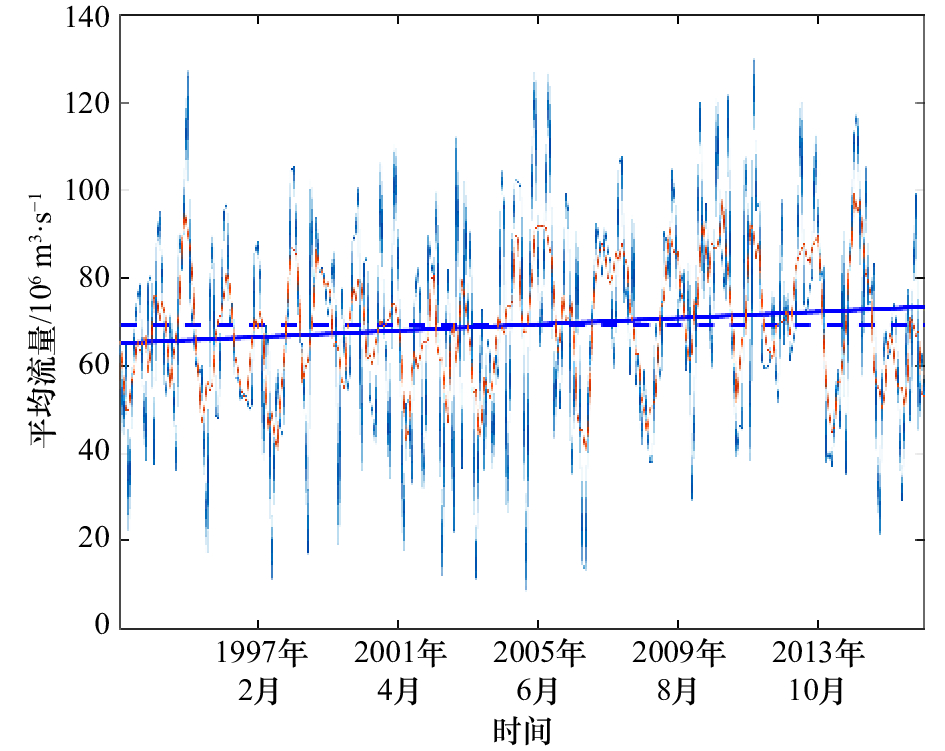
图 12 ACC经过德雷克海时的PF的流量逐月分布(1993–2016年)
Fig. 12 Monthly mean transport variation of PF in ACC during 1993–2016
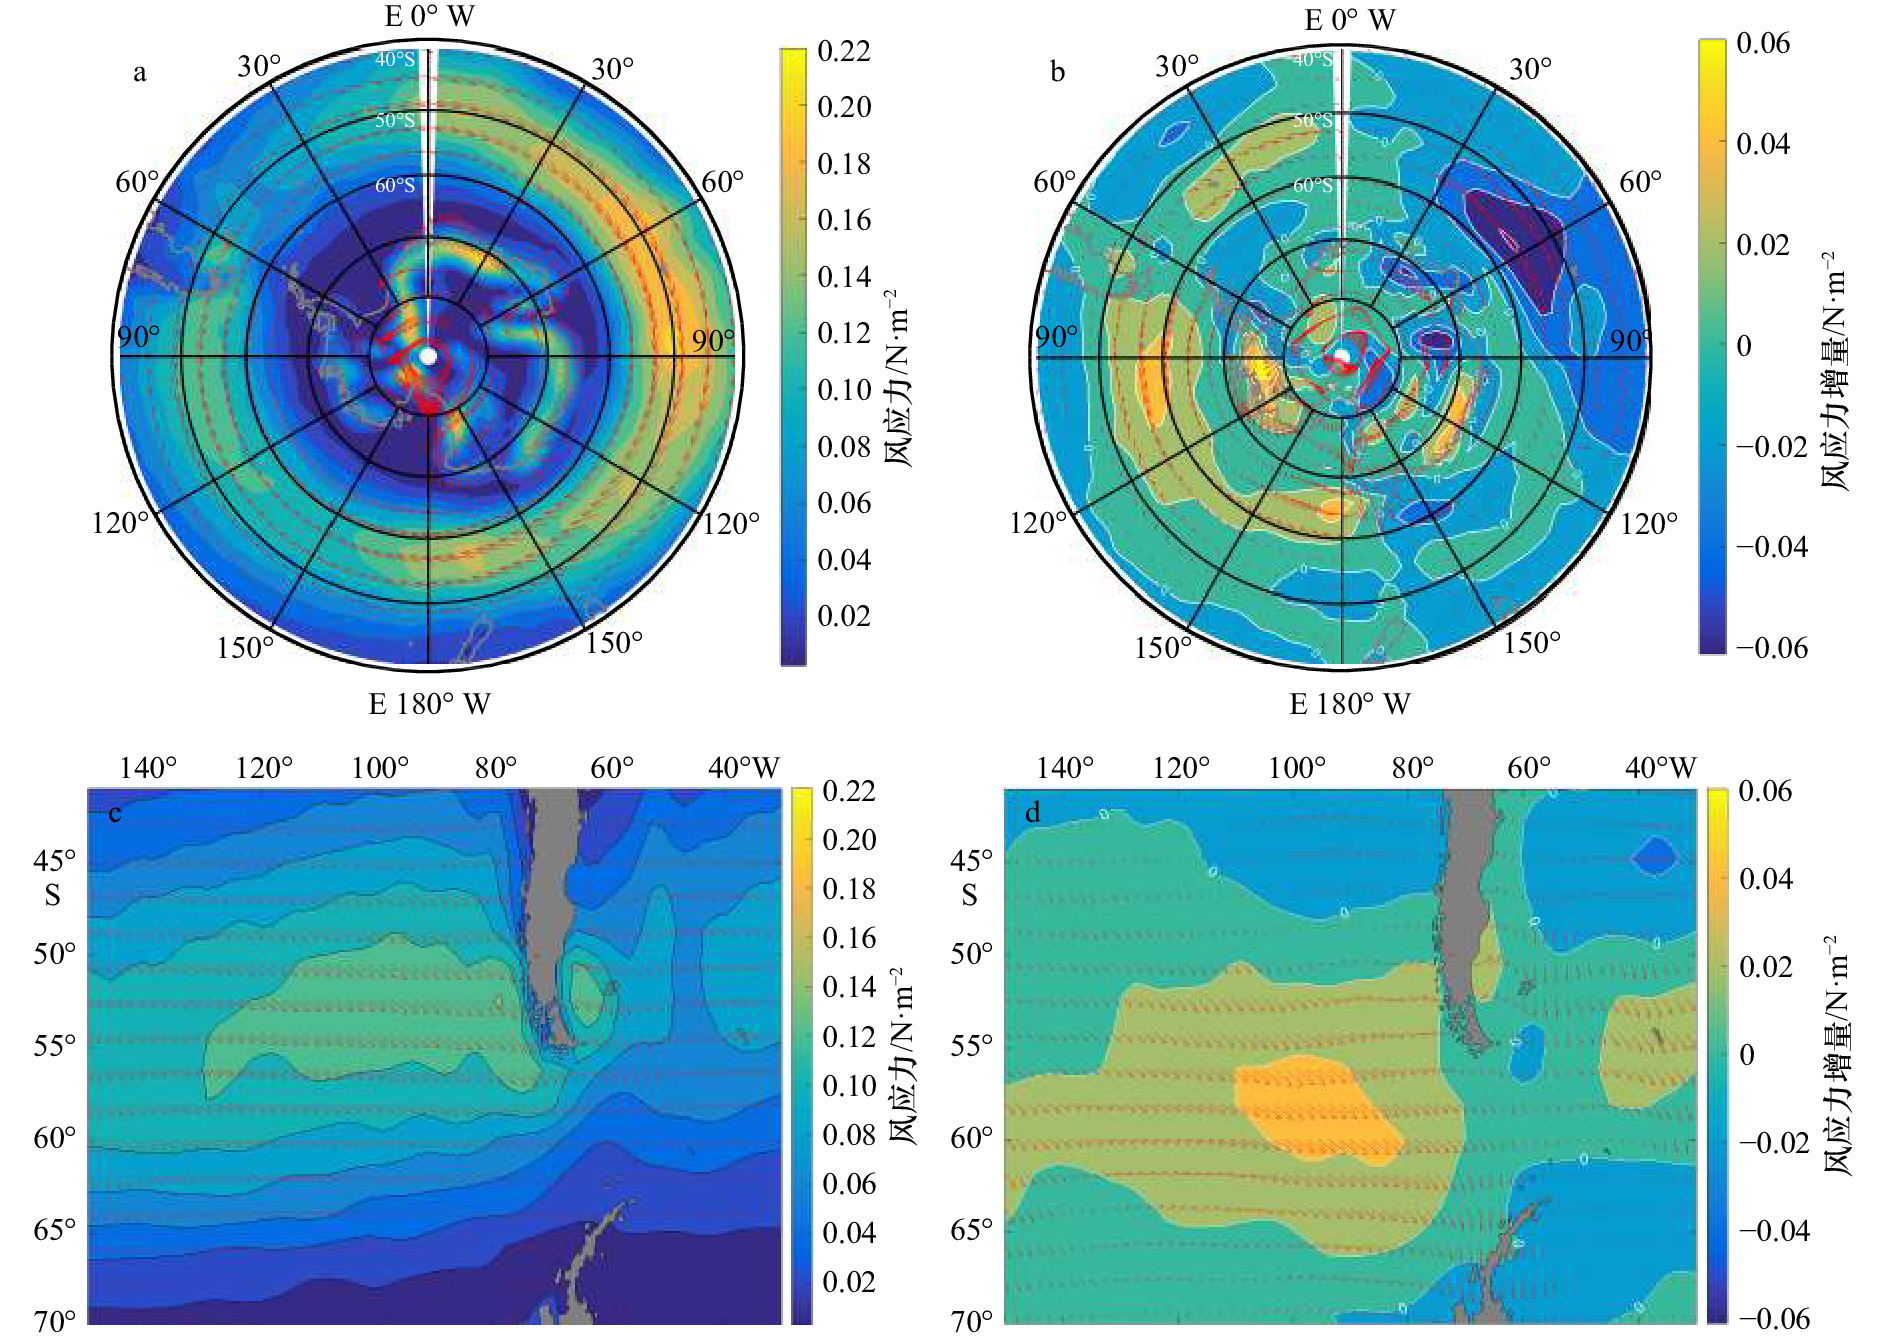
图 13 平均风应力(a),风应力增量(b),50°~70°S,60°~150°W区域的平均风应力(c),50°~70°S,60°~150°W区域的风应力增量(d)
平均风应力为1993–2016年的平均,箭头为平均风应力矢,其方向表示平均风应力的方向;风应力增量为1993–2016年间的增量,箭头为风 应力增量矢,其方向表示风应力增量的方向
Fig. 13 Mean wind stress (a), wind stress increment (b), mean wind stress between 50°–70°S and 60°–150°W (c), wind stress increment between 50°–70°S and 60°–150°W (d)
The mean wind stress is average value during 1993–2016, arrows are mean wind stress vectors and arrows’s direction is the direction of mean wind stress. The wind stress increment is increment value from 1993 to 2016, arrows are wind stress increment vectors and arrows’s direction is the direction of wind stress increment
-
[1] 陈新军, 赵小虎. 西南大西洋阿根廷滑柔鱼产量分布与表温关系的初步研究[J]. 大连水产学报, 2005, 20(3): 222−228.Chen Xinjun, Zhao Xiaohu. The relationship between the distribution of production of squid Illex argentinus and sea surface temperature in the Southwest Atlantic Ocean[J]. Journal of Dalian Fisheries University, 2005, 20(3): 222−228. [2] Friocourt Y, Drijfhout S, Blanke B, et al. Water mass export from drake passage to the Atlantic, Indian, and Pacific oceans: a Lagrangian model analysis[J]. Journal of Physical Oceanography, 2005, 35(7): 1206−1222. doi: 10.1175/JPO2748.1 [3] Goni G, Kamholz S, Garzoli S, et al. Dynamics of the Brazil-Malvinas confluence based on inverted echo sounders and altimetry[J]. Journal of Geophysical Research, 1996, 101(C7): 16273−16289. doi: 10.1029/96JC01146 [4] Goni G J, Bringas F, DiNezio P N. Observed low frequency variability of the Brazil Current front[J]. Journal of Geophysical Research, 2011, 116(C10): C10037. doi: 10.1029/2011JC007198 [5] Combes V, Matano P R. Trends in the Brazil/Malvinas confluence region[J]. Geophysical Research Letters, 2014, 41(24): 8971−8977. doi: 10.1002/2014GL062523 [6] Garzoli S L, Baringer M O. Meridional heat transport determined with expandable bathythermographs—Part II: south Atlantic transport[J]. Deep Sea Research Part I: Oceanographic Research Papers, 2007, 54(8): 1402−1420. doi: 10.1016/j.dsr.2007.04.013 [7] Vivier F, Provost C. Volume transport of the Malvinas Current: can the flow be monitored by TOPEX/POSEIDON?[J]. Journal of Geophysical Research, 1999, 104(C9): 21105−21122. doi: 10.1029/1999JC900056 [8] Matano R P. On the separation of the Brazil Current from the coast[J]. Journal of Physical Oceanography, 1993, 23(1): 79−90. doi: 10.1175/1520-0485(1993)023<0079:OTSOTB>2.0.CO;2 [9] Piola A R, Franco B C, Palma E D, et al. Multiple jets in the Malvinas Current[J]. Journal of Geophysical Research, 2013, 118(4): 2107−2117. [10] Orsi A H, Whitworth T, Nowlin Jr D W. On the meridional extent and fronts of the Antarctic circumpolar current[J]. Deep Sea Research Part I: Oceanographic Research Papers, 1995, 42(5): 641−673. doi: 10.1016/0967-0637(95)00021-W [11] 郭吉鸽, 谢基平, 朱江. 利用Argo浮标轨迹推断大洋表层和中层海流[G]//Argo应用研究论文集. 北京: 海洋出版社, 2006.Guo Jige, Xie Jiping, Zhu Jiang. Estimation of the surface and mid-depth currents from Argo floats[G]//Argo Science Seminar in China. Beijing: China Ocean Press, 2006. [12] Carton J A, Giese B S. A reanalysis of ocean climate using simple ocean data assimilation (SODA)[J]. Monthly Weather Review, 2008, 136(8): 2999−3017. doi: 10.1175/2007MWR1978.1 -

 下载:
下载:
 点击查看大图
计量
- 文章访问数: 496
- HTML全文浏览量: 80
- PDF下载量: 161
- 被引次数: 0
