

Observation and analysis of landfast ice arounding Zhongshan Station, Antarctic in 2016
-
摘要: 极区海冰是全球气候系统的重要组成部分,南极的固定冰普遍存在于其沿海地区,中山站周边固定冰一般在11月中下旬达到最厚。海冰厚度是海冰的重要参数之一,2016年在南极中山站附近3个站点(S1、S2、S3站点)共布放了4套温度链浮标,包括1套SIMBA (Snow and Ice Mass Balance Array)温度链浮标和3套太原理工大学温度链浮标(TY温度链浮标),SIMBA温度链浮标每天观测4次,TY温度链浮标每小时观测1次。利用浮标观测的温度剖面以及海冰和海水间不同介质温度差异计算得到海冰厚度。在S3站点,同时布放了SIMBA温度链浮标和TY温度链浮标。温度链浮标计算冰厚和人工钻孔观测冰厚比较结果显示,S1站点TY温度链浮标计算的海冰厚度平均误差和均方根误差分别为3.3 cm和14.7 cm,S2站点和S3站点分别为6.6 cm、6.9 cm以及4.0 cm、4.8 cm。S3站点的SIMBA温度链浮标计算冰厚和人工观测冰厚的平均误差和均方根误差为8.2 cm和9.7 cm。因而S3站点TY温度链浮标计算的海冰厚度更接近人工观测的结果。进一步对Stefan定律海冰生长模型进行对比,模型计算得到的海冰生长率为0.1~0.8 cm/d,生长率快于TY温度链浮标的结果,且受积雪影响明显。相比于卫星遥感反演冰厚的误差和观测时段的限制以及有限的人工观测,2种温度链浮标未来对于中山站附近海冰的长期监测均有重要的应用价值。Abstract: Sea ice is an important part of the global climate system. Landfast ice is commonly found in the Antarctic coastal area, which reached the thickest in the middle and late November around Zhongshan Station. Sea ice thickness is one of the important parameters of the sea ice. We presented measurements by taken 1 SIMBA (Snow and Ice Mass Balance Array) buoy and 3 TY buoys to monitor ice thickness based on the bias of different linear temperature gradient in air, snow, ice and sea water in three different landfast ice stations (S1, S2 and S3) in the Prydz Bay outside Zhongshan Station in 2016. The SIMBA measures vertical temperature profiles 4 times a day and TY measures vertical temperature per hour. Both SIMBA and TY buoys were set up in S3 station. Compared with borehole in situ measurements, the ice thickness derived by TY buoys had a mean bias and RMSE of 3.3 cm and 14.7 cm in S1 Station, 6.6 cm and 6.9 cm in S2 Station and 4.0 cm and 4.8 cm in S3 Station. And the mean bias and RMSE for the SIMBA buoys in S3 Station compared with borehole in situ measurements were 8.2 cm and 9.7 cm. The sea ice thickness derived by TY buoys were more agreement with the borehole in situ measurements compared with the sea ice thickness derives from SIMBA buoys in S3 Station. The result of Stefan’s law of ice growth model shows the sea ice growth process and the ice growth rate varied between 0.1 cm/d to 0.8 cm/d, which is faster than the result of TY buoys and is affected by the snow thickness. While compare with limited borehole in situ sea ice thickness measurements and the great uncertain in the sea ice thickness derived by remote sense data, the error for both the TY and SIMBA buoys are reasonable, which will benefit to the future sea ice thickness monitor near Zhongshan Station.
-
Key words:
- sea ice thermistor chain buoys /
- landfast ice /
- thickness /
- temperature /
- Antarctic /
- Prydz Bay
-

图 2 2016年4月22日至11月22日每小时的海表(2 m)气温(a)和风速(b)时间序列
Fig. 2 Time series of hourly sea surface (2 m) air temperature (a) and wind speed (b) over the period between April 22 and November 11 in 2016
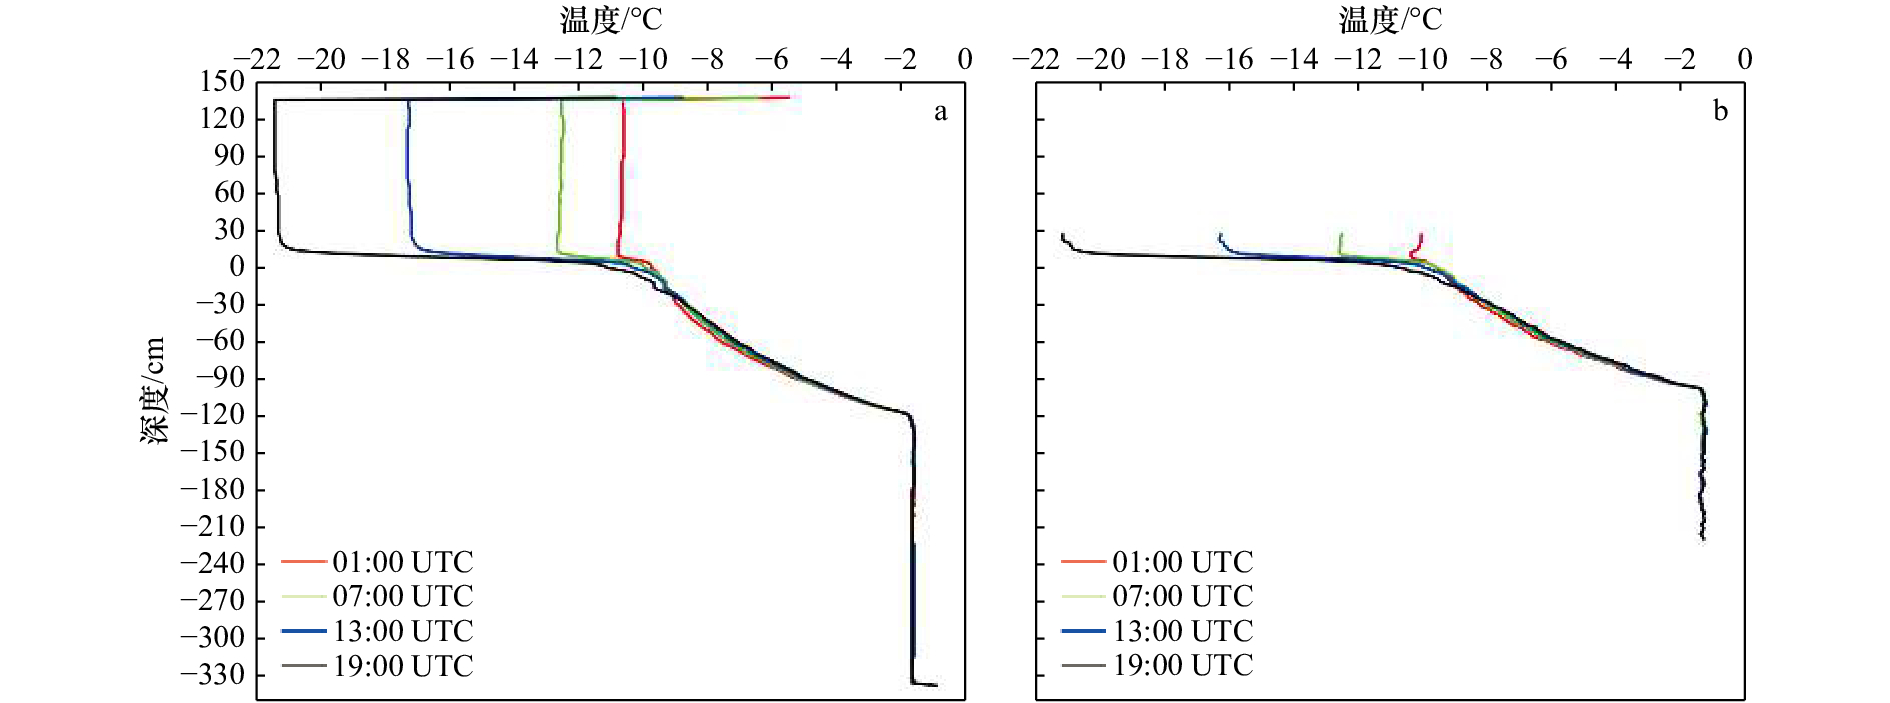
图 3 2016年5月1日S3站点SIMBA温度链浮标观测的温度剖面示例(a),传感器间隔为2.0 cm;TY温度链浮标观测到的温度剖面示例(b),传感器间隔为1.0 cm
横坐标表示传感器观测的温度,纵坐标表示传感器的深度,0表示安装时冰面的位置
Fig. 3 Four times daily measured temperature profiles at S3 Station on May 1, 2016 from SIMBA buoy with 2.0 cm interval (a) and TY buoy with 1.0 cm interval (b)
The X-axis represent the temperature observed by the sensors, the Y-axis represent the depth of the sensors, and the 0 represent the sea initial sea ice surface when setup
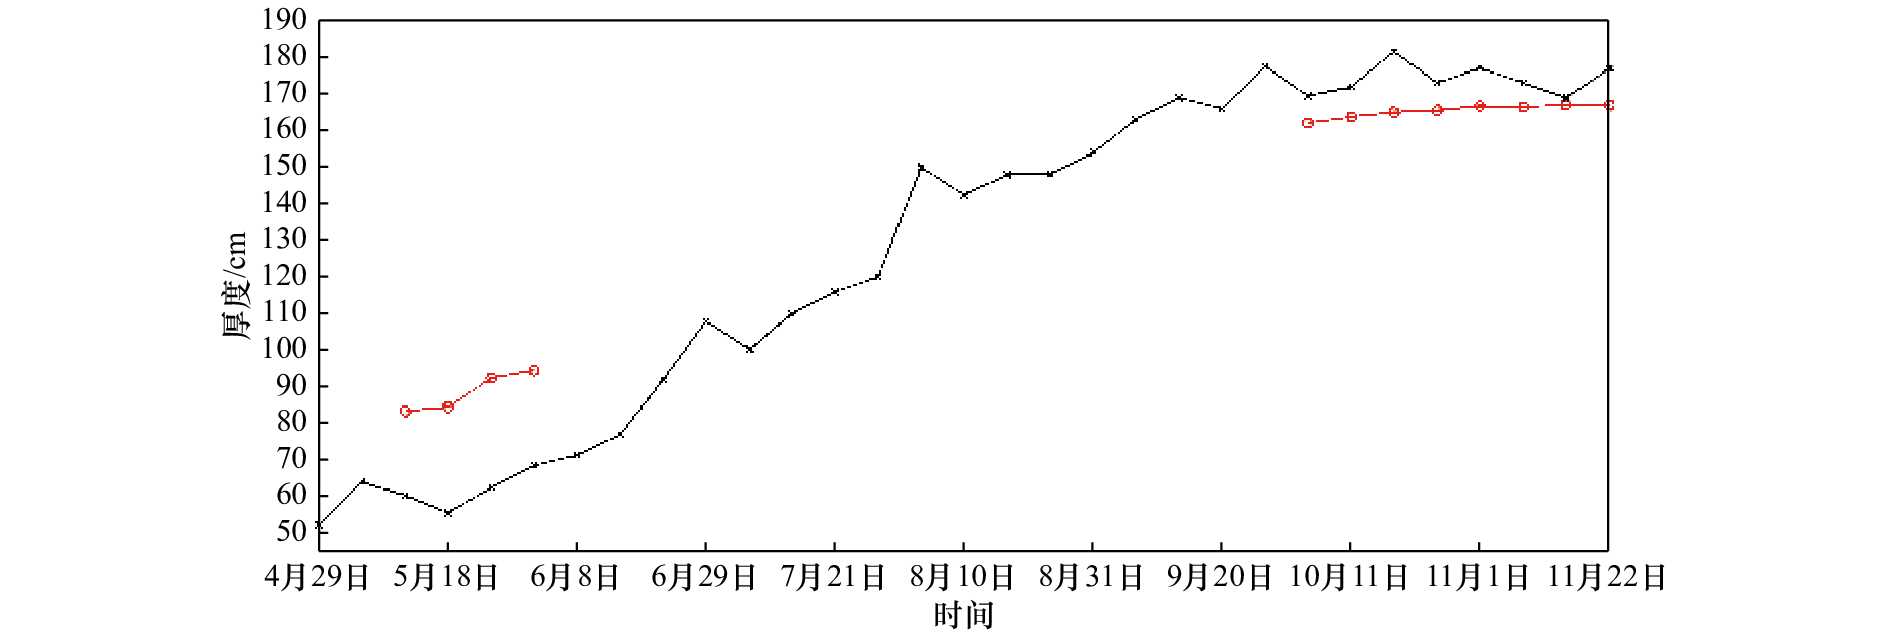
图 4 S1站点人工观测冰厚(黑线)和TY温度链冰厚(红线)比较
Fig. 4 Comparison of ice thickness between borehole in situ (black line) and TY buoy (red line) on S1 Station

图 5 2016年S1站点TY温度链浮标观测的自上而下大气–海冰–海洋温度剖面随时间的变化
黑线为海冰上表面,绿线为海冰/海水界面
Fig. 5 Temperature evolution for the surface air-ice-ocean system from the TY buoy observations on S1 Station in 2016
The black and green lines represent the initial sea ice upper surface and the ice-sea interface, respectively
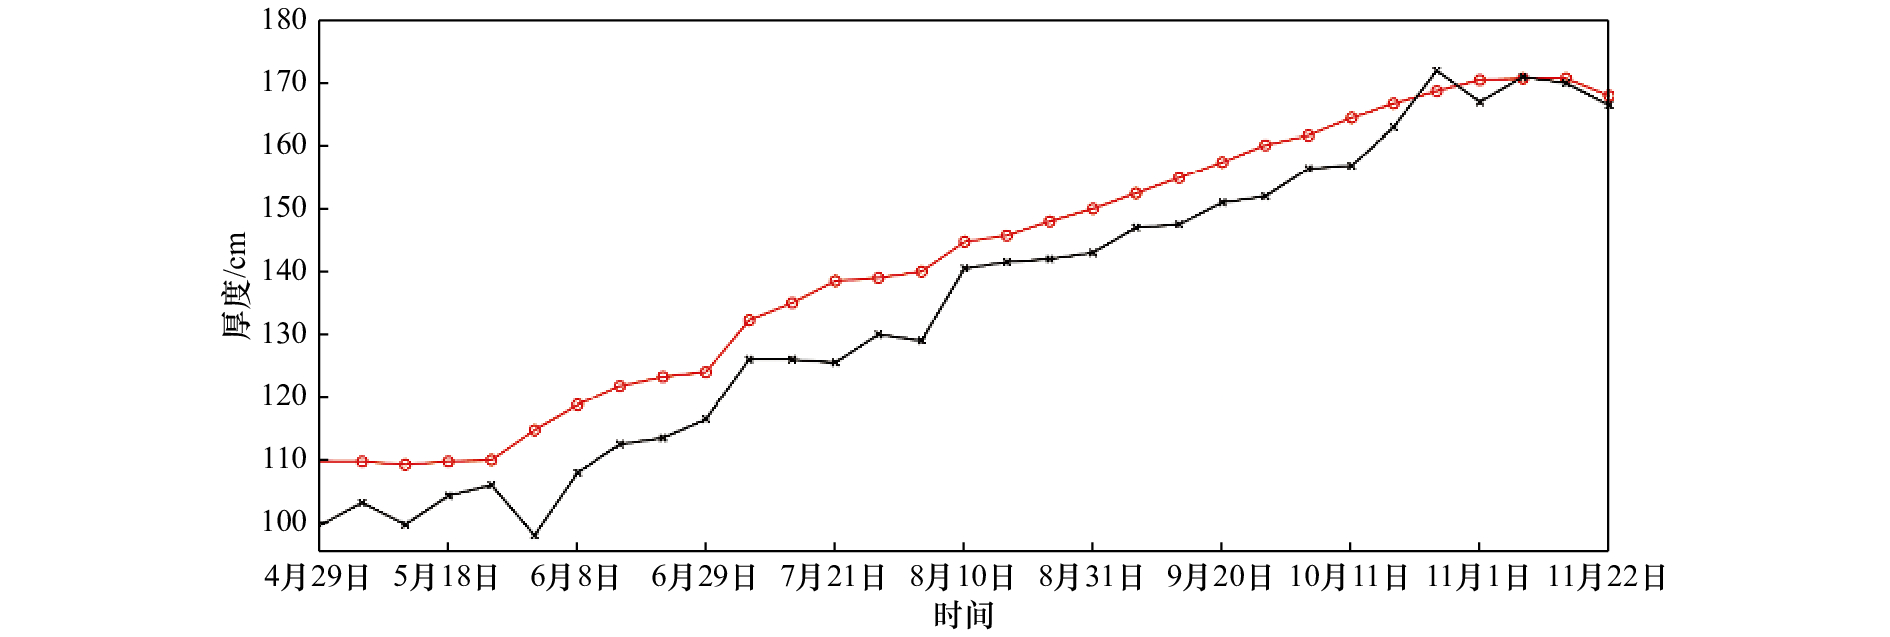
图 6 S2站点人工观测冰厚(黑)和TY温度链冰厚(红)比较
Fig. 6 Comparison of ice thickness between borehole in situ (black line) and TY buoy (red line) on S2 Station

图 7 2016年S2站点TY温度链浮标观测的自上而下大气–海冰–海洋温度剖面随时间的变化
黑线为海冰上表面,绿线为海冰/海水界面
Fig. 7 Temperature evolution for the surface air-ice-ocean system from the TY buoy observations on S2 Station in 2016
The black and green lines represent the initial sea ice upper surface and the ice-sea interface, respectively
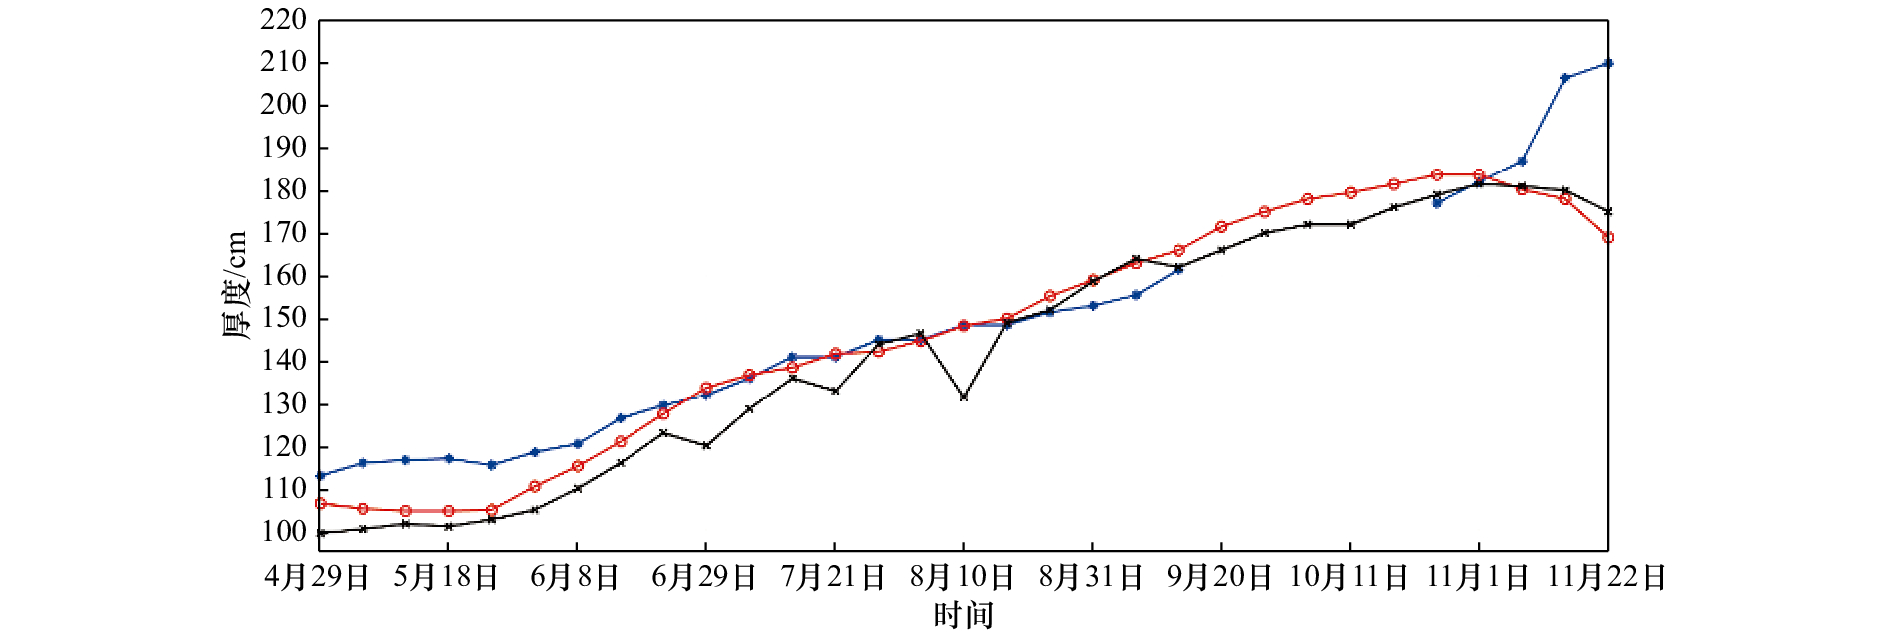
图 8 S3站点人工观测冰厚(黑线)和TY温度链冰厚(红线)以及SIMBA温度链冰厚(蓝线)比较
Fig. 8 Comparison of ice thickness by borehole in situ (black line), SIMBA buoy (blue line) and TY buoy (red line) on S3 Station
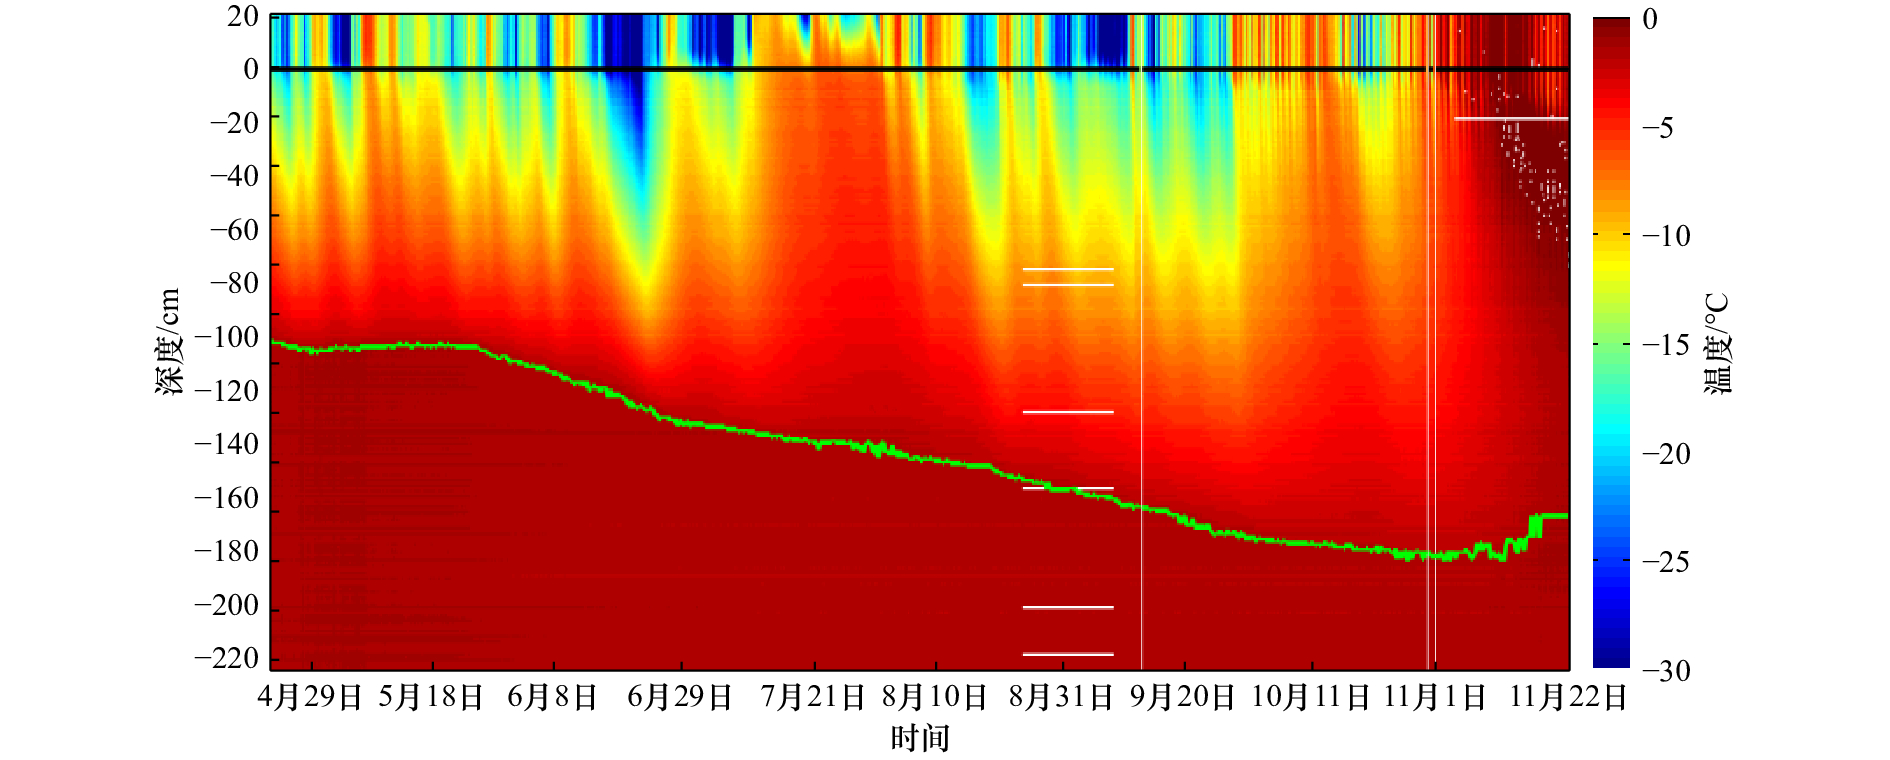
图 9 2016年S3站点TY温度链浮标观测的自上而下大气–海冰–海洋温度剖面随时间的变化
黑线为海冰上表面,绿线为海冰/海水界面
Fig. 9 Temperature evolution for the surface air-ice-ocean system from the TY buoy observations on S3 Station in 2016
The black and green lines represent the initial sea ice upper surface and the ice-sea interface, respectively

图 10 2016年S3站点SIMBA温度链浮标观测的自上而下大气–海冰–海洋温度剖面随时间的变化
黑线为海冰上表面,绿线为海冰/海水界面
Fig. 10 Temperature evolution for the surface air-ice-ocean system from the SIMBA buoy observations on S3 Station in 2016
The black and green lines represent the initial sea ice upper surface and the ice-sea interface, respectively
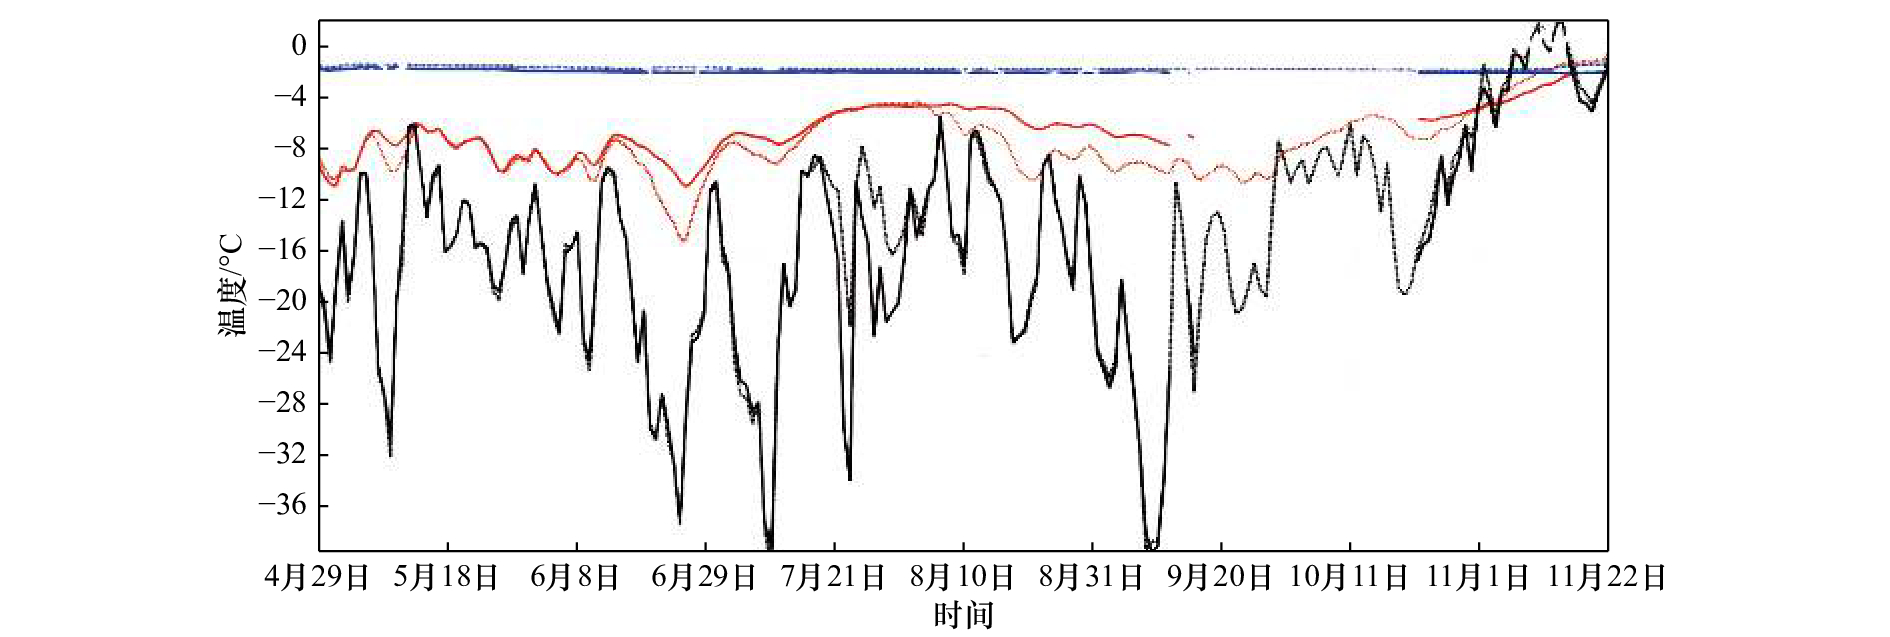
图 11 S3站点TY温度链浮标(虚线)与SIMBA温度链浮标(实线)在空气(黑线)、海冰(红线)和海水(蓝线)中测得的温度比较
Fig. 11 Comparison between temperature observations detected by TY buoy (dashed line) and SIMBA buoy (solid line) for air (black line), sea ice (red line) and sea water (blue line)
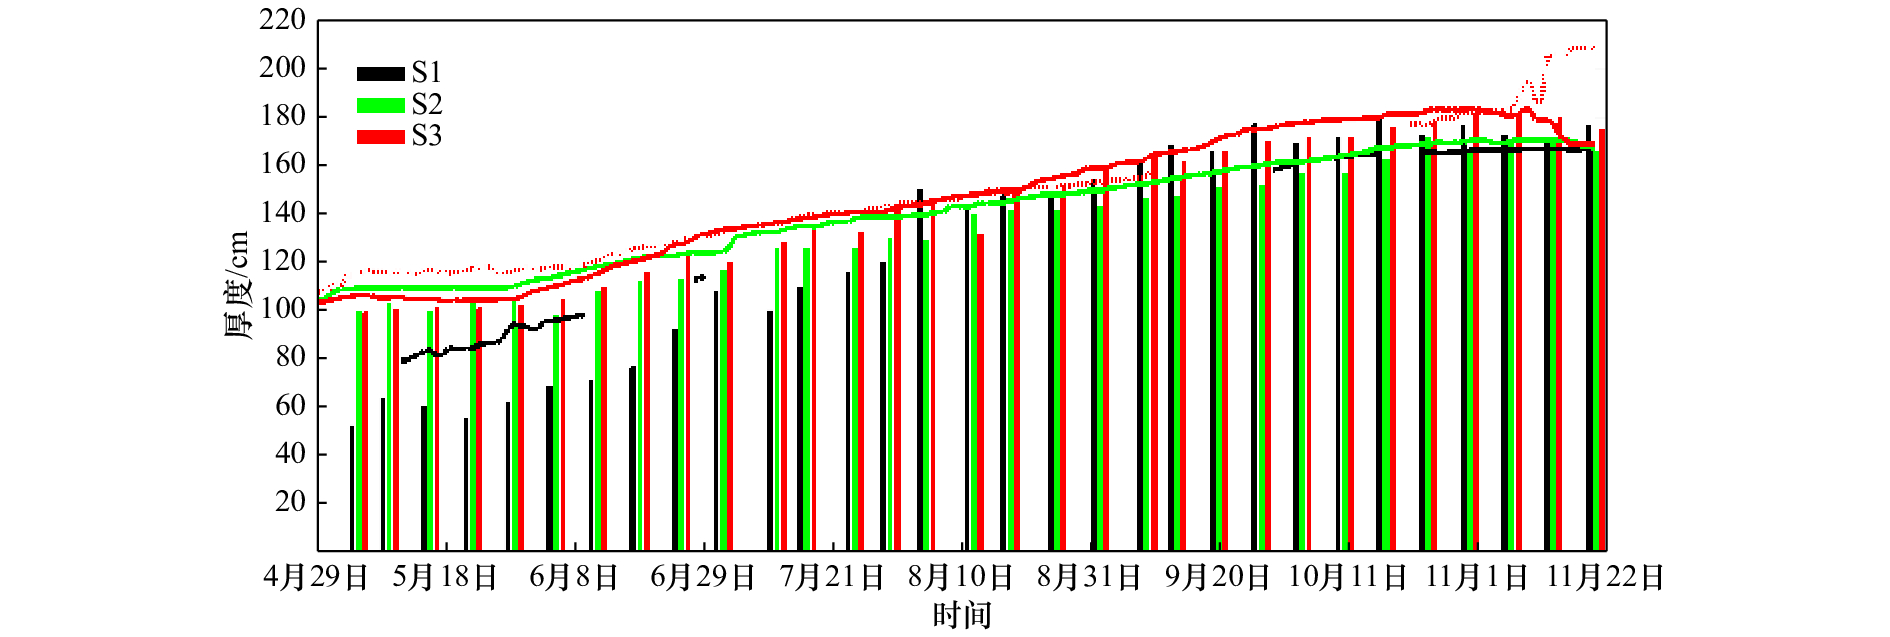
图 12 固定冰3个站点人工冰厚(柱状)和逐日温度链浮标冰厚观测结果(线)
黑色为S1站点,绿色为S2站点,红色为S3站点;黑线为S1站点TY温度链浮标冰厚,绿线为S2站点TY温度链浮标冰厚,红实线为S3站 TY温度链浮标冰厚,红点线为SIMBA温度链浮标冰厚
Fig. 12 Observation results of ice thickness by borehole in situ (bar) and TY (SIMBA) buoys (line) on S1, S2 and S3 stations
The black, green, red bars represent S1, S2 and S3 stations, respectively. The green and black lines are ice thickness detected by TY buoys on S2 and S1 stations. The red solid (dotted) line represent the sea ice thickness detected by TY (SIMBA) buoys on S3 Station
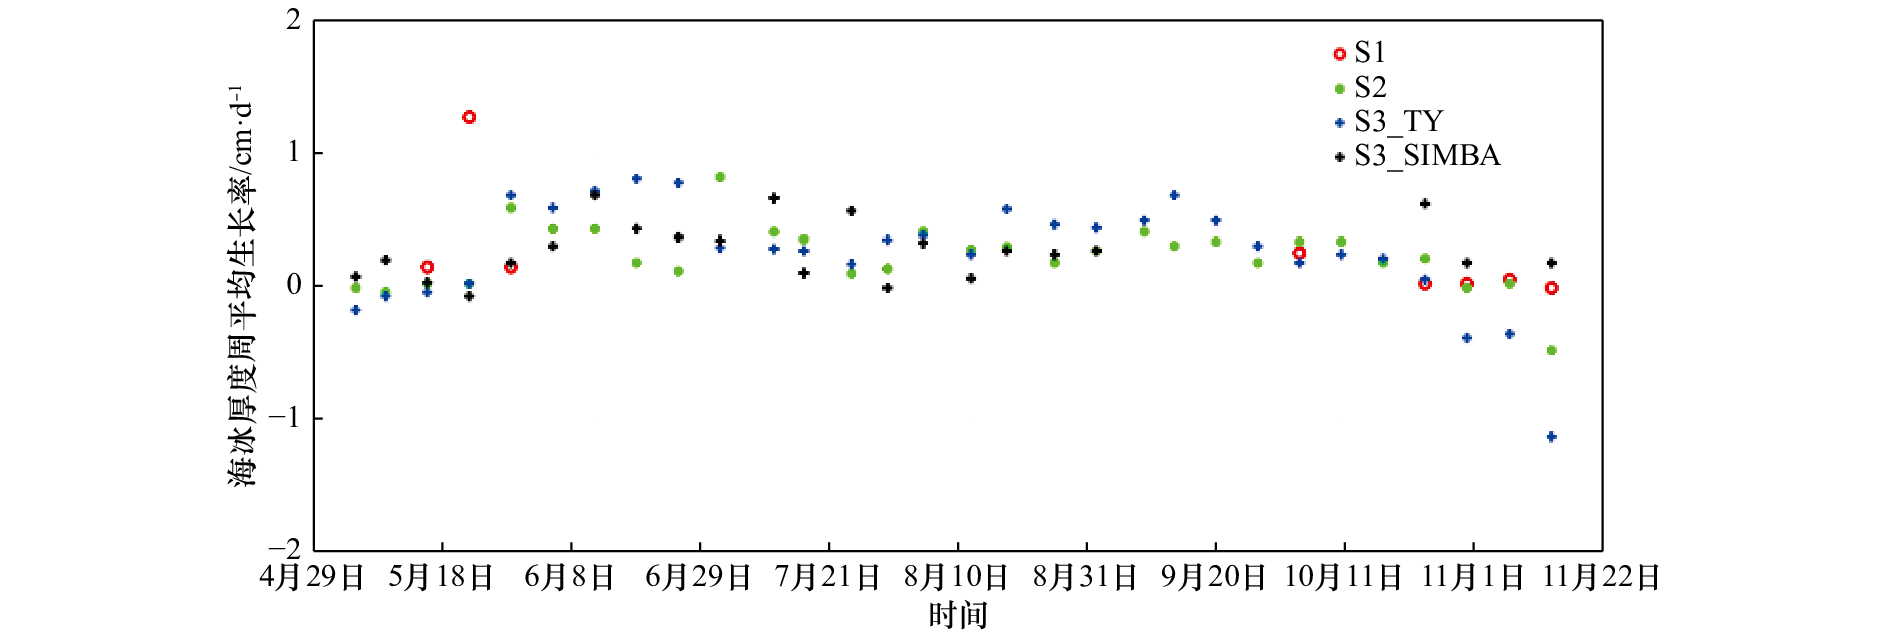
图 13 温度链浮标计算的站点(S1,S2,S3)海冰厚度周平均生长率
Fig. 13 The weekly sea ice thickness growth rate for S1, S2 and S3 stations using the buoy data
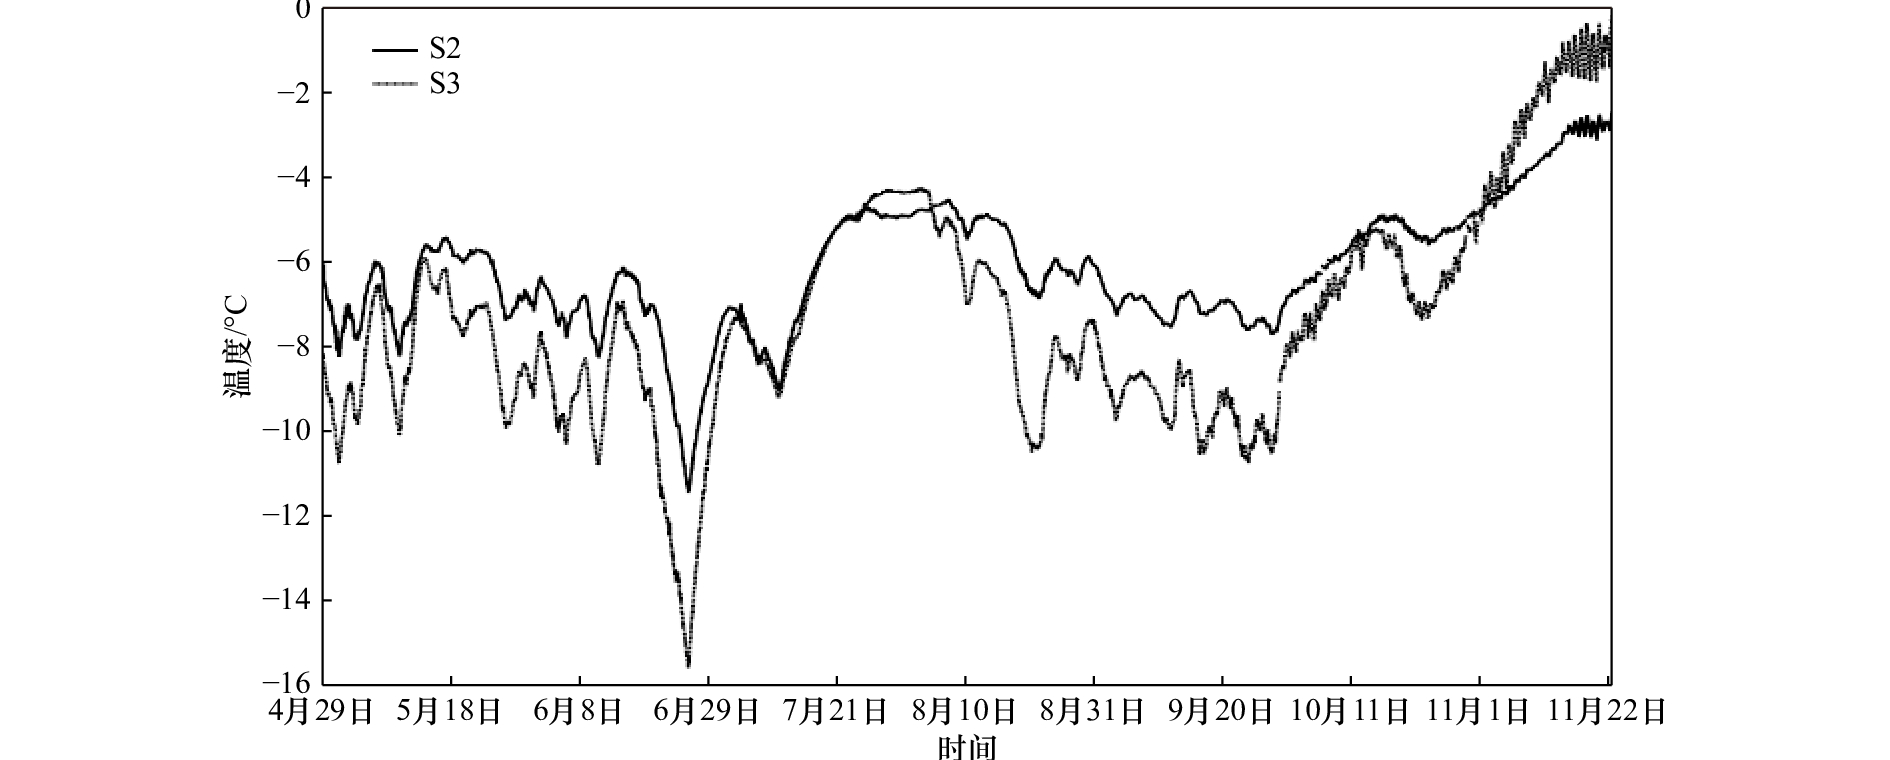
图 14 TY温度链浮标观测的S2和S3站点每小时冰内平均温度
Fig. 14 The hourly averaged temperature observations detected by TY buoy on S2 and S3 stations
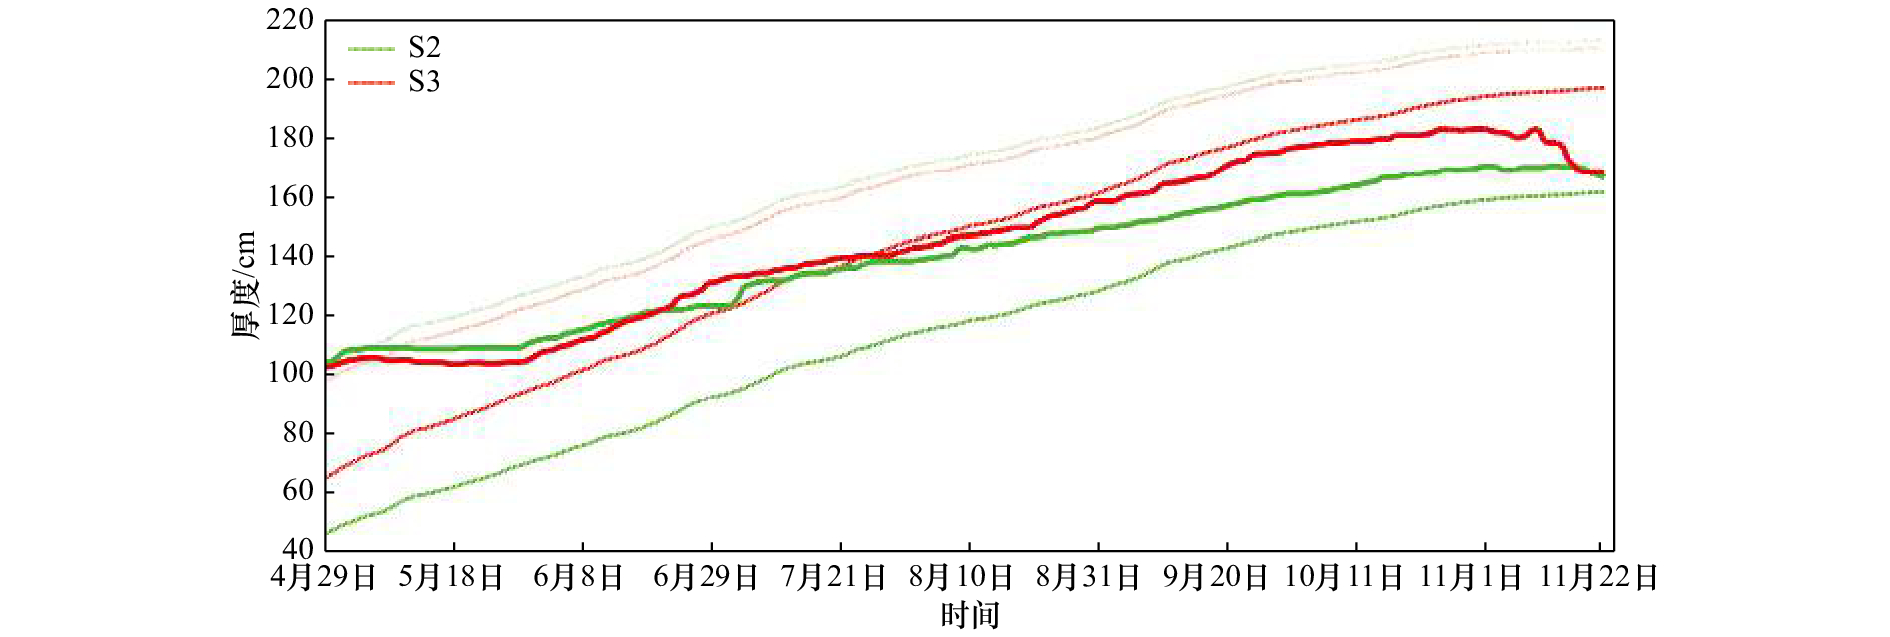
图 15 固定冰2个站点(S2和S3)根据Stefan定律模拟冰厚(点线和虚线)以及TY温度链浮标计算的冰厚(实线)
点线为不考虑积雪厚度,虚线为假定积雪厚度为常数,实线是TY温度链浮标计算的海冰厚度
Fig. 15 Comparison of ice thickness detected by TY buoys (solid line) and Stefan’s law (dotted line and dashed line) simulated on S2 station (green) and S3 station (red)
The dotted line points to the case excluding the effects of snow cover over the ice surface and the dashed line refers to the one including snow effects. The solid line is the ice thickness detected by TY buoys
表 1 海冰厚度生长率比较
Tab. 1 The sea ice thickness growth rate
时间 海冰厚度生长率/cm·d−1 S2 S3 TY Stefan Stefan(有雪) TY Stefan Stefan(有雪) 4月22日至5月31日 0.2 0.7 0.7 0.2 0.7 0.8 6月1日至7月25日 0.4 0.7 0.7 0.6 0.7 0.8 7月26日至8月15日 0.3 0.4 0.4 0.4 0.4 0.4 8月16日至10月20日 0.3 0.5 0.5 0.5 0.5 0.5 10月21日至11月15日 0.1 0.2 0.2 −0.1 0.2 0.2 11月16日至11月22日 −0.5 0.1 0.1 −0.6 0.1 0.1  下载: 导出CSV
-
[1] Serreze M C, Maslanik J A, Scambos T A, et al. A record minimum Arctic sea ice extent and area in 2002[J]. Geophysical Research Letters, 2003, 30(3): 1110. doi: 10.1029/2002GL016406 [2] Liu Jiping, Curry J A, Hu Yongyun. Recent Arctic sea ice variability: connections to the Arctic oscillation and the ENSO[J]. Geophysical Research Letters, 2004, 31(9): L09211. [3] Massom R A, Stammerjohn S E. Antarctic sea ice change and variability – Physical and ecological implications[J]. Polar Science, 2010, 4(2): 149−186. doi: 10.1016/j.polar.2010.05.001 [4] Perovich D K, Grenfell T C, Richter-Menge J A, et al. Thin and thinner: sea ice mass balance measurements during SHEBA[J]. Journal of Geophysical Research: Oceans, 2003, 108(C3): SHE 26. [5] Maslanik J, Stroeve J, Fowler C, et al. Distribution and trends in Arctic sea ice age through spring 2011[J]. Geophysical Research Letters, 2011, 38(13): L13502. [6] Holland M M, Stroeve J. Changing seasonal sea ice predictor relationships in a changing Arctic climate[J]. Geophysical Research Letters, 2011, 38(18): L18501. [7] Comiso J C. Large decadal decline of the Arctic multiyear ice cover[J]. Journal of Climate, 2012, 25(4): 1176−1193. doi: 10.1175/JCLI-D-11-00113.1 [8] Comiso J C, Parkinson C L, Gersten R, et al. Accelerated decline in the Arctic sea ice cover[J]. Geophysical Research Letters, 2008, 35(1): L01703. [9] Comiso J C, Hall D K. Climate trends in the Arctic as observed from space[J]. Wiley Interdisciplinary Reviews: Climate Change, 2014, 5(3): 389−409. doi: 10.1002/wcc.277 [10] Cavalieri D J, Parkinson C L, Vinnikov K Y. 30-Year satellite record reveals contrasting Arctic and Antarctic decadal sea ice variability[J]. Geophysical Research Letters, 2003, 30(18): 1970. [11] Liu Jiping, Curry J A, Martinson D G. Interpretation of recent Antarctic sea ice variability[J]. Geophysical Research Letters, 2004, 31(2): L02205. [12] Stammerjohn S E, Martinson D G, Smith R C, et al. Trends in Antarctic annual sea ice retreat and advance and their relation to El Niño-Southern Oscillation and southern annular mode variability[J]. Journal of Geophysical Research: Oceans, 2008, 113(C3): C03S90. [13] Parkinson C L, Cavalieri D J. Antarctic sea ice variability and trends, 1979−2010[J]. The Cryosphere Discussions, 2012, 6(2): 931−956. doi: 10.5194/tcd-6-931-2012 [14] Holland P R. The seasonality of Antarctic sea ice trends[J]. Geophysical Research Letters, 2014, 41(12): 4230−4237. doi: 10.1002/2014GL060172 [15] Massom R A, Eicken H, Hass C, et al. Snow on Antarctic sea ice[J]. Reviews of Geophysics, 2001, 39(3): 413−445. doi: 10.1029/2000RG000085 [16] Cavalieri D J, Parkinson C L. Antarctic sea ice variability and trends, 1979-2006[J]. Journal of Geophysical Research: Ocean, 2008, 113(C7): C07004. [17] Holland P R, Bruneau N, Enright C, et al. Modeled trends in Antarctic sea ice thickness[J]. Journal of Climate, 2014, 27(10): 3784−3801. doi: 10.1175/JCLI-D-13-00301.1 [18] Kurtz N T, Markus T. Satellite observations of Antarctic sea ice thickness and volume[J]. Journal of Geophysical Research: Oceans, 2012, 117(C8): C08025. [19] Allison I, Brandt R E, Warren S G. East Antarctic sea ice: Albedo, thickness distribution, and snow cover[J]. Journal of Geophysical Research: Oceans, 1993, 98(C7): 12417−12429. doi: 10.1029/93JC00648 [20] Worby A P, Geiger C A, Paget M J, et al. Thickness distribution of Antarctic sea ice[J]. Journal of Geophysical Research: Oceans, 2008, 113(C5): C05S92. [21] Reid J E, Worby A P, Vrbancich J, et al. Shipborne electromagnetic measurements of Antarctic sea-ice thickness[J]. Geophysics, 2003, 68(5): 1537−1546. doi: 10.1190/1.1620627 [22] Fedotov V I, Cherepanov N V, Tyshko K P. Some features of the growth, structure and metamorphism of east Antarctic Landfast sea ice[M]//Jeffries M O. Antarctic Sea: Ice Physical Processes, Interactions and Variability. Washington, DC: American Geophysical Union, 1998: 343–354. [23] Lei Ruibo, Li Zhijun, Cheng Bin, et al. Annual cycle of landfast sea ice in Prydz Bay, east Antarctica[J]. Journal of Geophysical Research: Oceans, 2010, 115(C2): C02006. [24] Heil P, Gerland S, Granskog M A. An Antarctic monitoring initiative for fast ice and comparison with the Arctic[J]. The Cryosphere Discuss, 2011, 5(5): 2437−2463. doi: 10.5194/tcd-5-2437-2011 [25] 雷瑞波, 李志军, 秦建敏, 等. 定点冰厚观测新技术研究[J]. 水科学进展, 2009, 20(2): 287−292. doi: 10.3321/j.issn:1001-6791.2009.02.021Lei Ruibo, Li Zhijun, Qin Jianmin, et al. Investigation of new technologies for in-situ ice thickness observation[J]. Advances in Water Science, 2009, 20(2): 287−292. doi: 10.3321/j.issn:1001-6791.2009.02.021 [26] 郭井学, 孙波, 田钢, 等. 南极普里兹湾海冰厚度的电磁感应探测方法研究[J]. 地球物理学报, 2008, 51(2): 596−602. doi: 10.3321/j.issn:0001-5733.2008.02.033Guo Jingxue, Sun Bo, Tian Gang, et al. Research on electromagnetic inductive measurement of sea-ice thickness in Antarctic Prydz Bay[J]. Chinese Journal of Geophysics, 2008, 51(2): 596−602. doi: 10.3321/j.issn:0001-5733.2008.02.033 [27] 雷瑞波, 李志军, 窦银科, 等. 南极中山站附近固定冰生消过程观测[J]. 水科学进展, 2010, 21(5): 708−712.Lei Ruibo, Li Zhijun, Dou Yinke, et al. Observations of the growth and decay processes of fast ice around Zhongshan Station in Antarctica[J]. Advances in Water Science, 2010, 21(5): 708−712. [28] 赵杰臣, 杨清华, 程斌, 等. 基于温度链浮标获取南极普里兹湾积雪和固定冰厚度的研究[J]. 海洋学报, 2017, 39(11): 115−127. doi: 10.3969/j.issn.0253-4193.2017.11.011Zhao Jiechen, Yang Qinghua, Cheng Bin, et al. Snow and land-fast sea ice thickness derived from thermistor chain buoy in the Prydz Bay, Antarctic[J]. Haiyang Xuebao, 2017, 39(11): 115−127. doi: 10.3969/j.issn.0253-4193.2017.11.011 [29] Tian Zhongxiang, Cheng Bin, Zhao Jiechen, et al. Observed and modelled snow and ice thickness in the Arctic Ocean with CHINARE buoy data[J]. Acta Oceanologica Sinica, 2017, 36(8): 66−75. doi: 10.1007/s13131-017-1020-4 [30] Stefan J. Ueber die theorie der eisbildung, insbesondere über die eisbildung im polarmeere[J]. Annalen Der Physik, 1891, 278(2): 269−286. doi: 10.1002/(ISSN)1521-3889 [31] Leppäranta M. Freezing of Lakes and the Evolution of Their Ice Cover[M]. Berlin, Heidelberg: Springer, 2015. [32] Maksym T, Markus T. Antarctic sea ice thickness and snow-to-ice conversion from atmospheric reanalysis and passive microwave snow depth[J]. Journal of Geophysical Research: Oceans, 2008, 113(C2): C02S12. [33] Tang Shulin, Kang Jiancheng, Zhou Shangzhe, et al. Sea ice characteristics between the middle Weddell Sea and the Prydz Bay, Antarctica during the austral summer of 2003[J]. Acta Oceanologica Sinica, 2005, 24(2): 9−15. -

 点击查看大图
计量
- 文章访问数: 383
- HTML全文浏览量: 58
- PDF下载量: 181
- 被引次数: 0
