

Spatial variability of parameter sensitivity in the ecosystem simulation of the Bohai Sea and Yellow Sea
-
摘要: 随着海洋生态系统模型的发展,生态变量增多,众多生物过程参数量值的确定成为制约生态环境模拟的瓶颈问题,生态系统结构区域性要求模型中的生态参数具有区域差异。为探究不同海区的关键参数及参数敏感度的空间差异,本研究在渤、黄海建立了ROMS-CoSiNE物理–生物耦合的高分辨率生态系统模型,并对13种生态参数的敏感度空间分布进行分析。结果表明:南黄海中部与渤海及近岸海域的敏感度差异较大。渤海敏感度最大的参数为决定光合速率的浮游植物P-I曲线初始斜率,其次为浮游动物捕食半饱和常数和浮游动物最大捕食率。而南黄海中部敏感度最大的参数为浮游动物最大捕食率,其次为浮游植物死亡率和浮游植物P-I曲线初始斜率。结合敏感度分布及浮游植物生物量收支得出,渤海水体透明度较南黄海偏低、浮游植物生长光限制较强,是引起浮游植物P-I曲线初始斜率敏感度在渤海高于黄海的主要原因。浮游动物最大捕食率及浮游植物死亡率的敏感度空间差异,受渤、黄海浮游植物生物量差异的影响,与生态系统中的高度非线性特征有关。Abstract: As the development of marine ecosystem models, the number of biological parameters increases, which consequently causes determination of these parameters to become a bottleneck in ecosystem modeling. Intrinsic regional characteristics of the ecosystem require spatial variability of biological parameters. To explore spatial difference of key parameters and their sensitivity, a highly resolved physical-biological ecosystem model ROMS-CoSiNE of the Bohai Sea and Yellow Sea is established. Sensitivity analysis of thirteen biological parameters indicates that strong difference in sensitivity exist between the south center Yellow Sea, the Bohai Sea and it’s coastal areas as well. The most sensitive parameter in the Bohai Sea is the initial slope of P-I curve. The second and third are the half saturation constant for zooplankton grazing and the maximum specific growth rate of zooplankton. For the south Yellow Sea, the most sensitive parameters are the maximum specific growth rate of zooplankton, the death rate of phytoplankton and the initial slope of P-I curve. Based on sensitivity distribution and phytoplankton budget, it is concluded that the low transparency in the Bohai Sea and high transparency in the Yellow Sea are mainly responsible for spatial difference of sensitivity relative to the initial slope of P-I curve. Spatial difference of sensitivity relative to the maximum specific growth rate of zooplankton and the death rate of phytoplankton, is affected by phytoplankton amount difference between the Bohai Sea and the Yellow Sea, and related to high nonlinearity in the ecosystem.
-
Key words:
- ecosystem model /
- parameter sensitivity /
- spatial variability /
- Bohai Sea /
- Yellow Sea
-
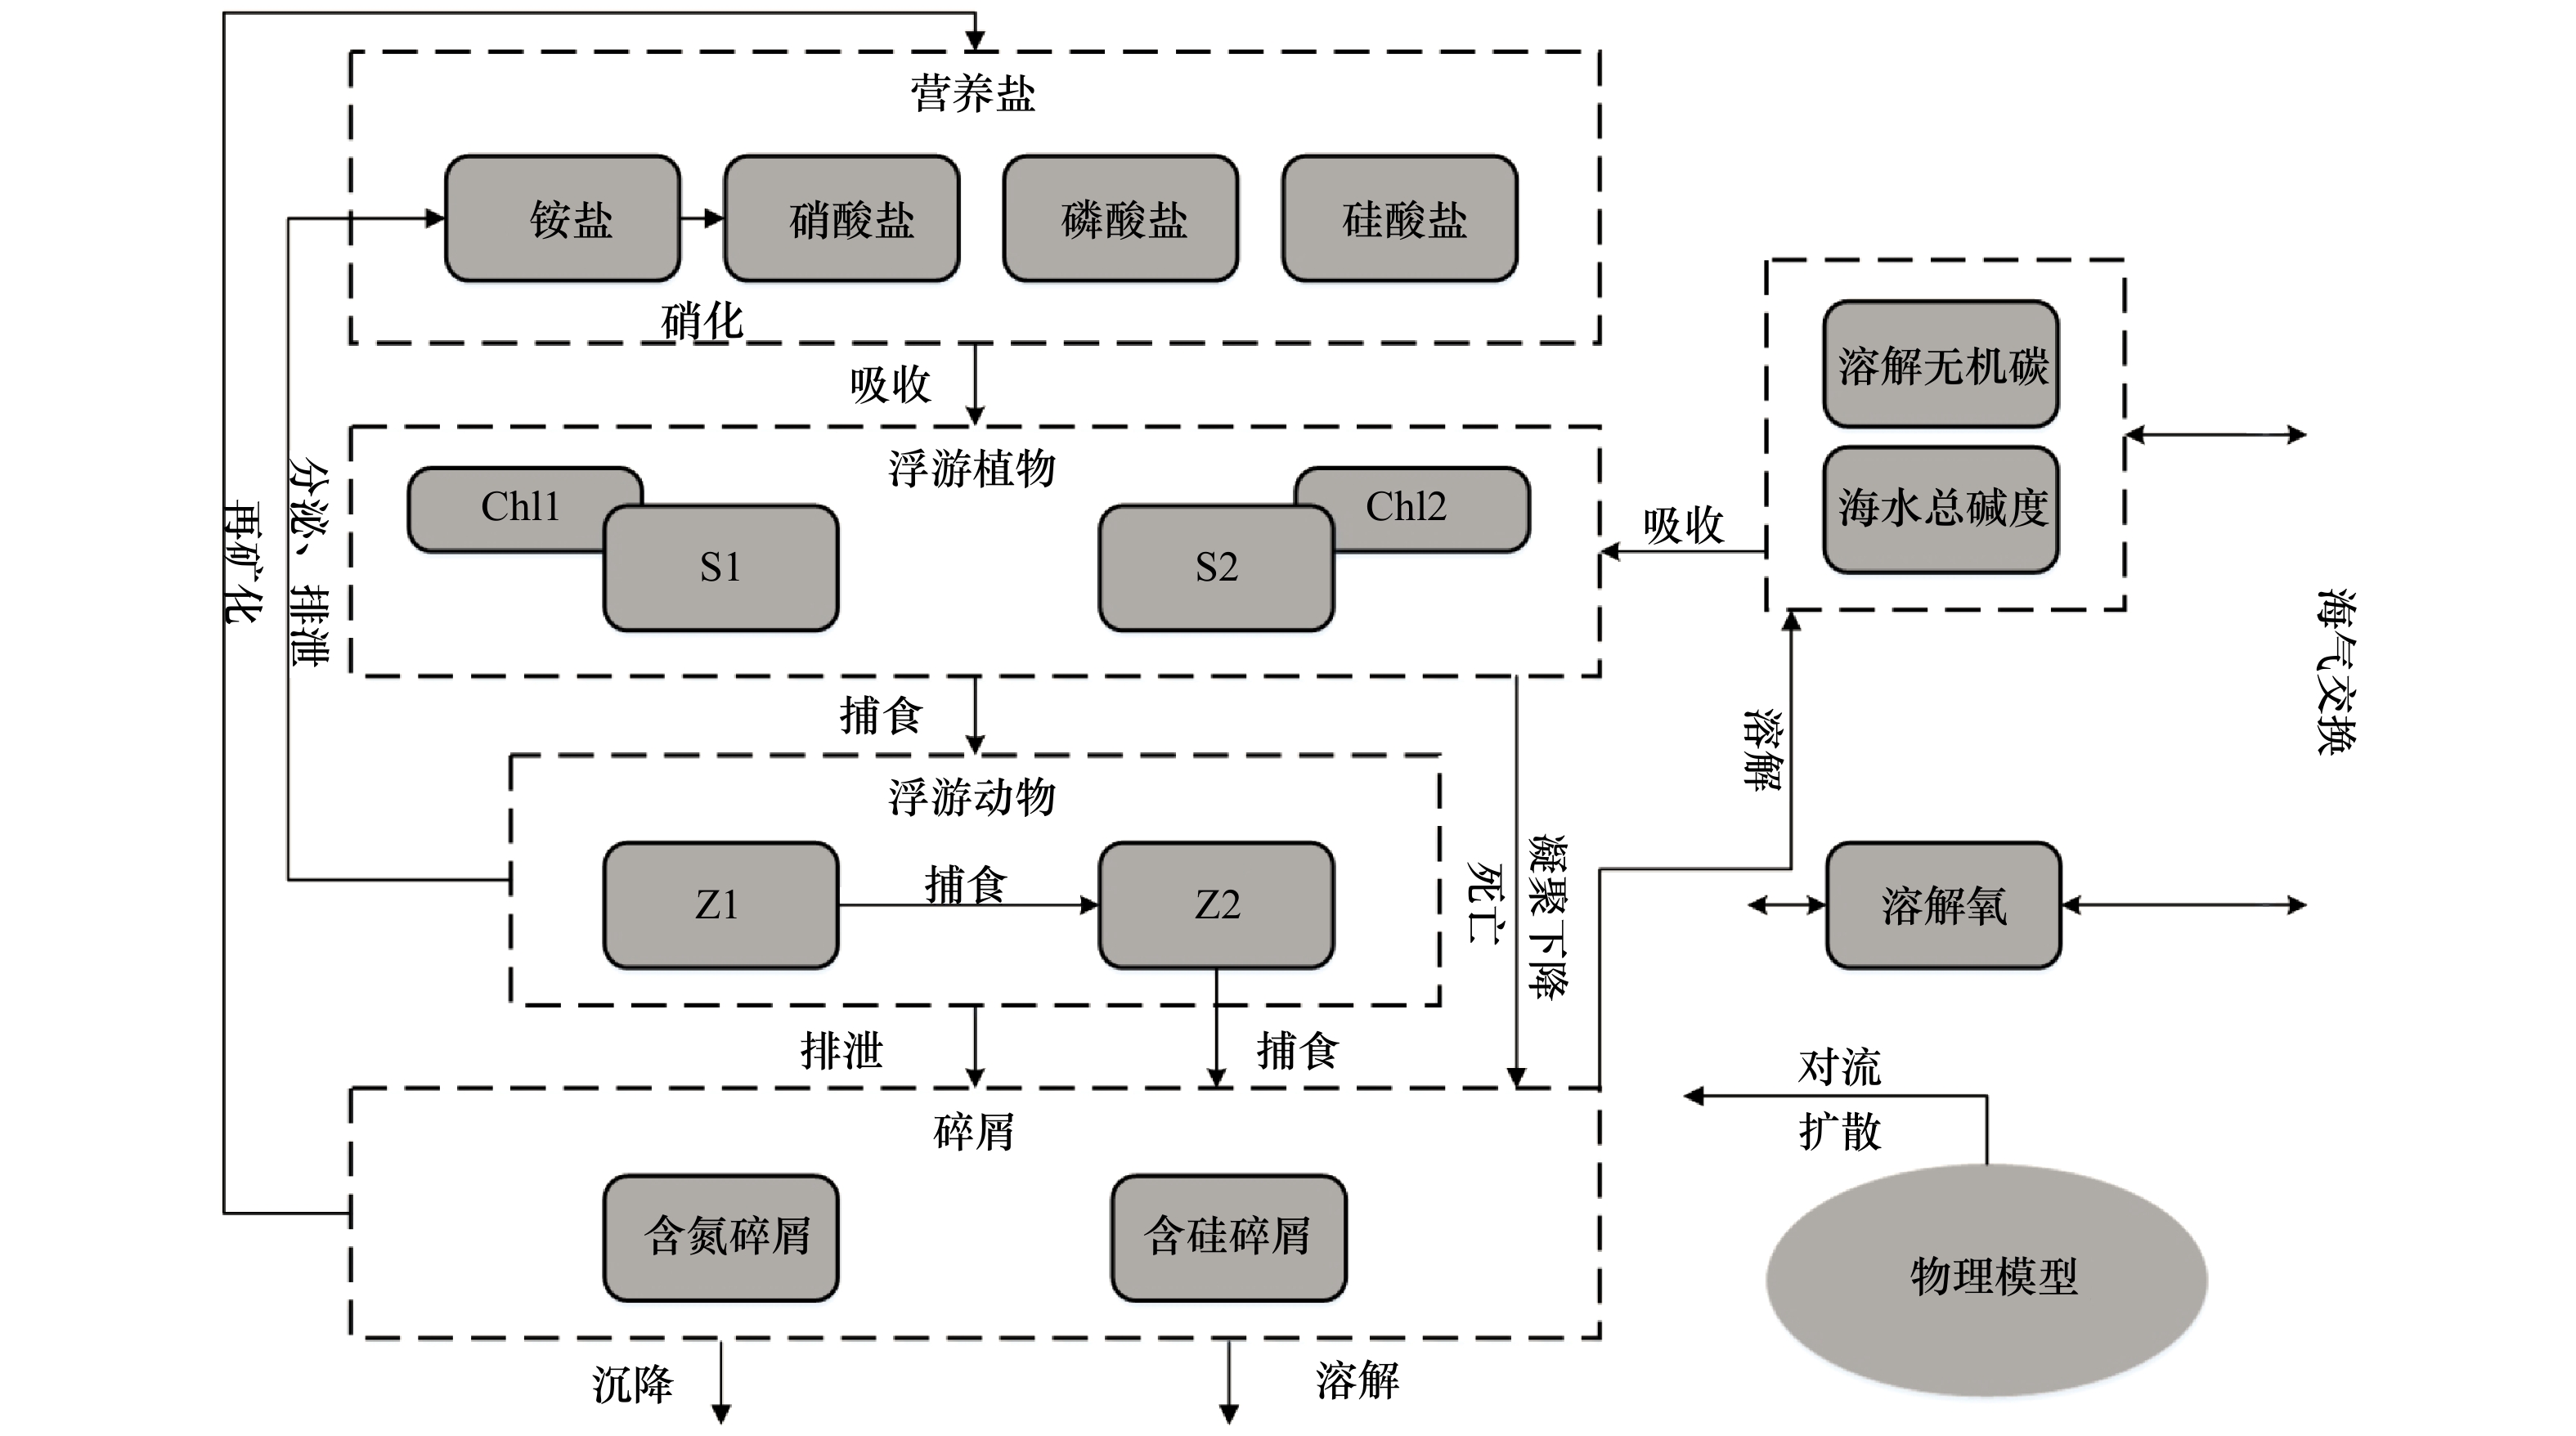
图 2 CoSiNE生态模型示意图
S1. 小型浮游植物;S2.硅藻;Z1. 小型浮游动物;Z2. 中型浮游动物;Chl1.小型浮游植物对应的叶绿素;Chl2.大型浮游植物对应的叶绿素
Fig. 2 Schematic of CoSiNE biological model
S1. microphytoplankton; S2. diatom; Z1. microzooplankton; Z2. mesozooplankton; Chl1. chlorophyll corresponding to microphytoplankton; Chl2. chlorophyll corresponding to macroplankton
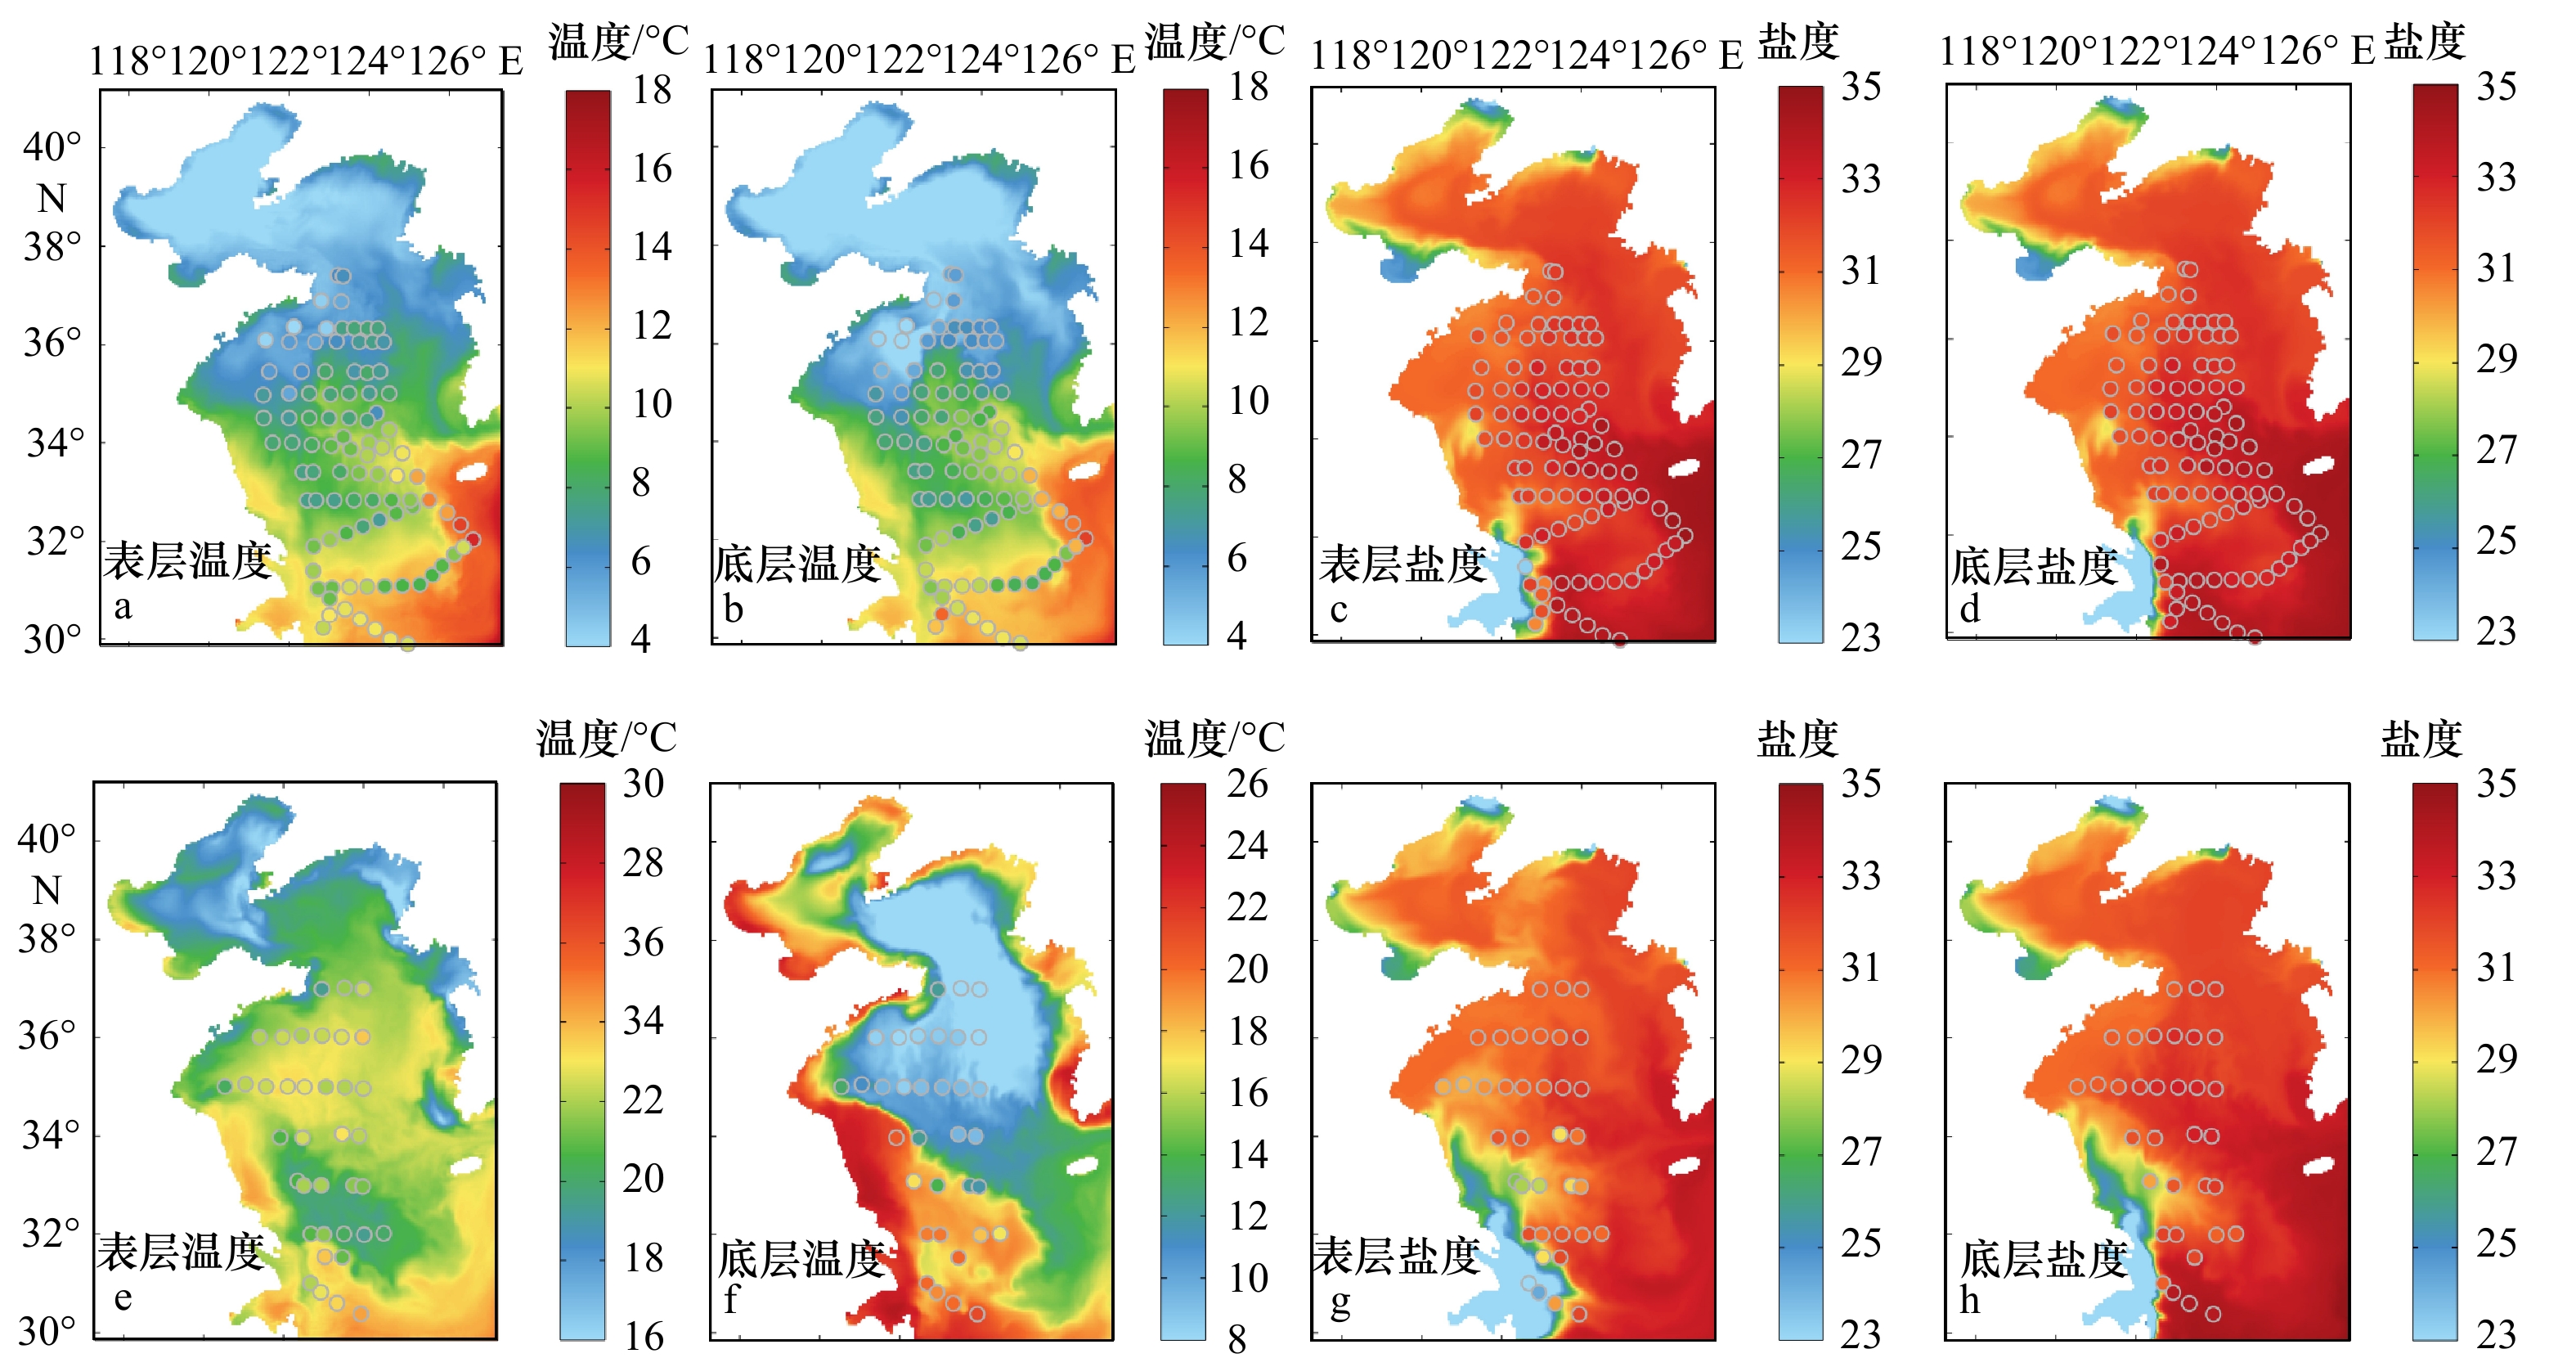
图 3 模型模拟的2011年3月表层温度(a)、底层温度(b)、表层盐度(c)、底层盐度(d)及2013年6月表层温度(e)、底层温度(f)、表层盐度(g)、底层盐度(h)与现场观测的对比。颜色大面分布为模型结果,散点表示现场观测结果
Fig. 3 Comparison of surface and bottom temperature and salinity between model results (colored map) and observations (dots) in March 2011 (a, b, c, d) and June 2013 (e, f, g, h)

图 4 模型模拟的2012年6月(a)、8月(b),2013年6月(c)、7月(d)、8月(e)、9月(f)表层叶绿素与现场观测结果对比。颜色大面分布为模型结果,散点表示现场观测结果
Fig. 4 Comparison of simulated (colored map) surface chlorophyll and observations (dots) in June 2012 (a), August 2012 (b), June 2013 (c), July 2013 (d), August 2013 (e), September 2013 (f)
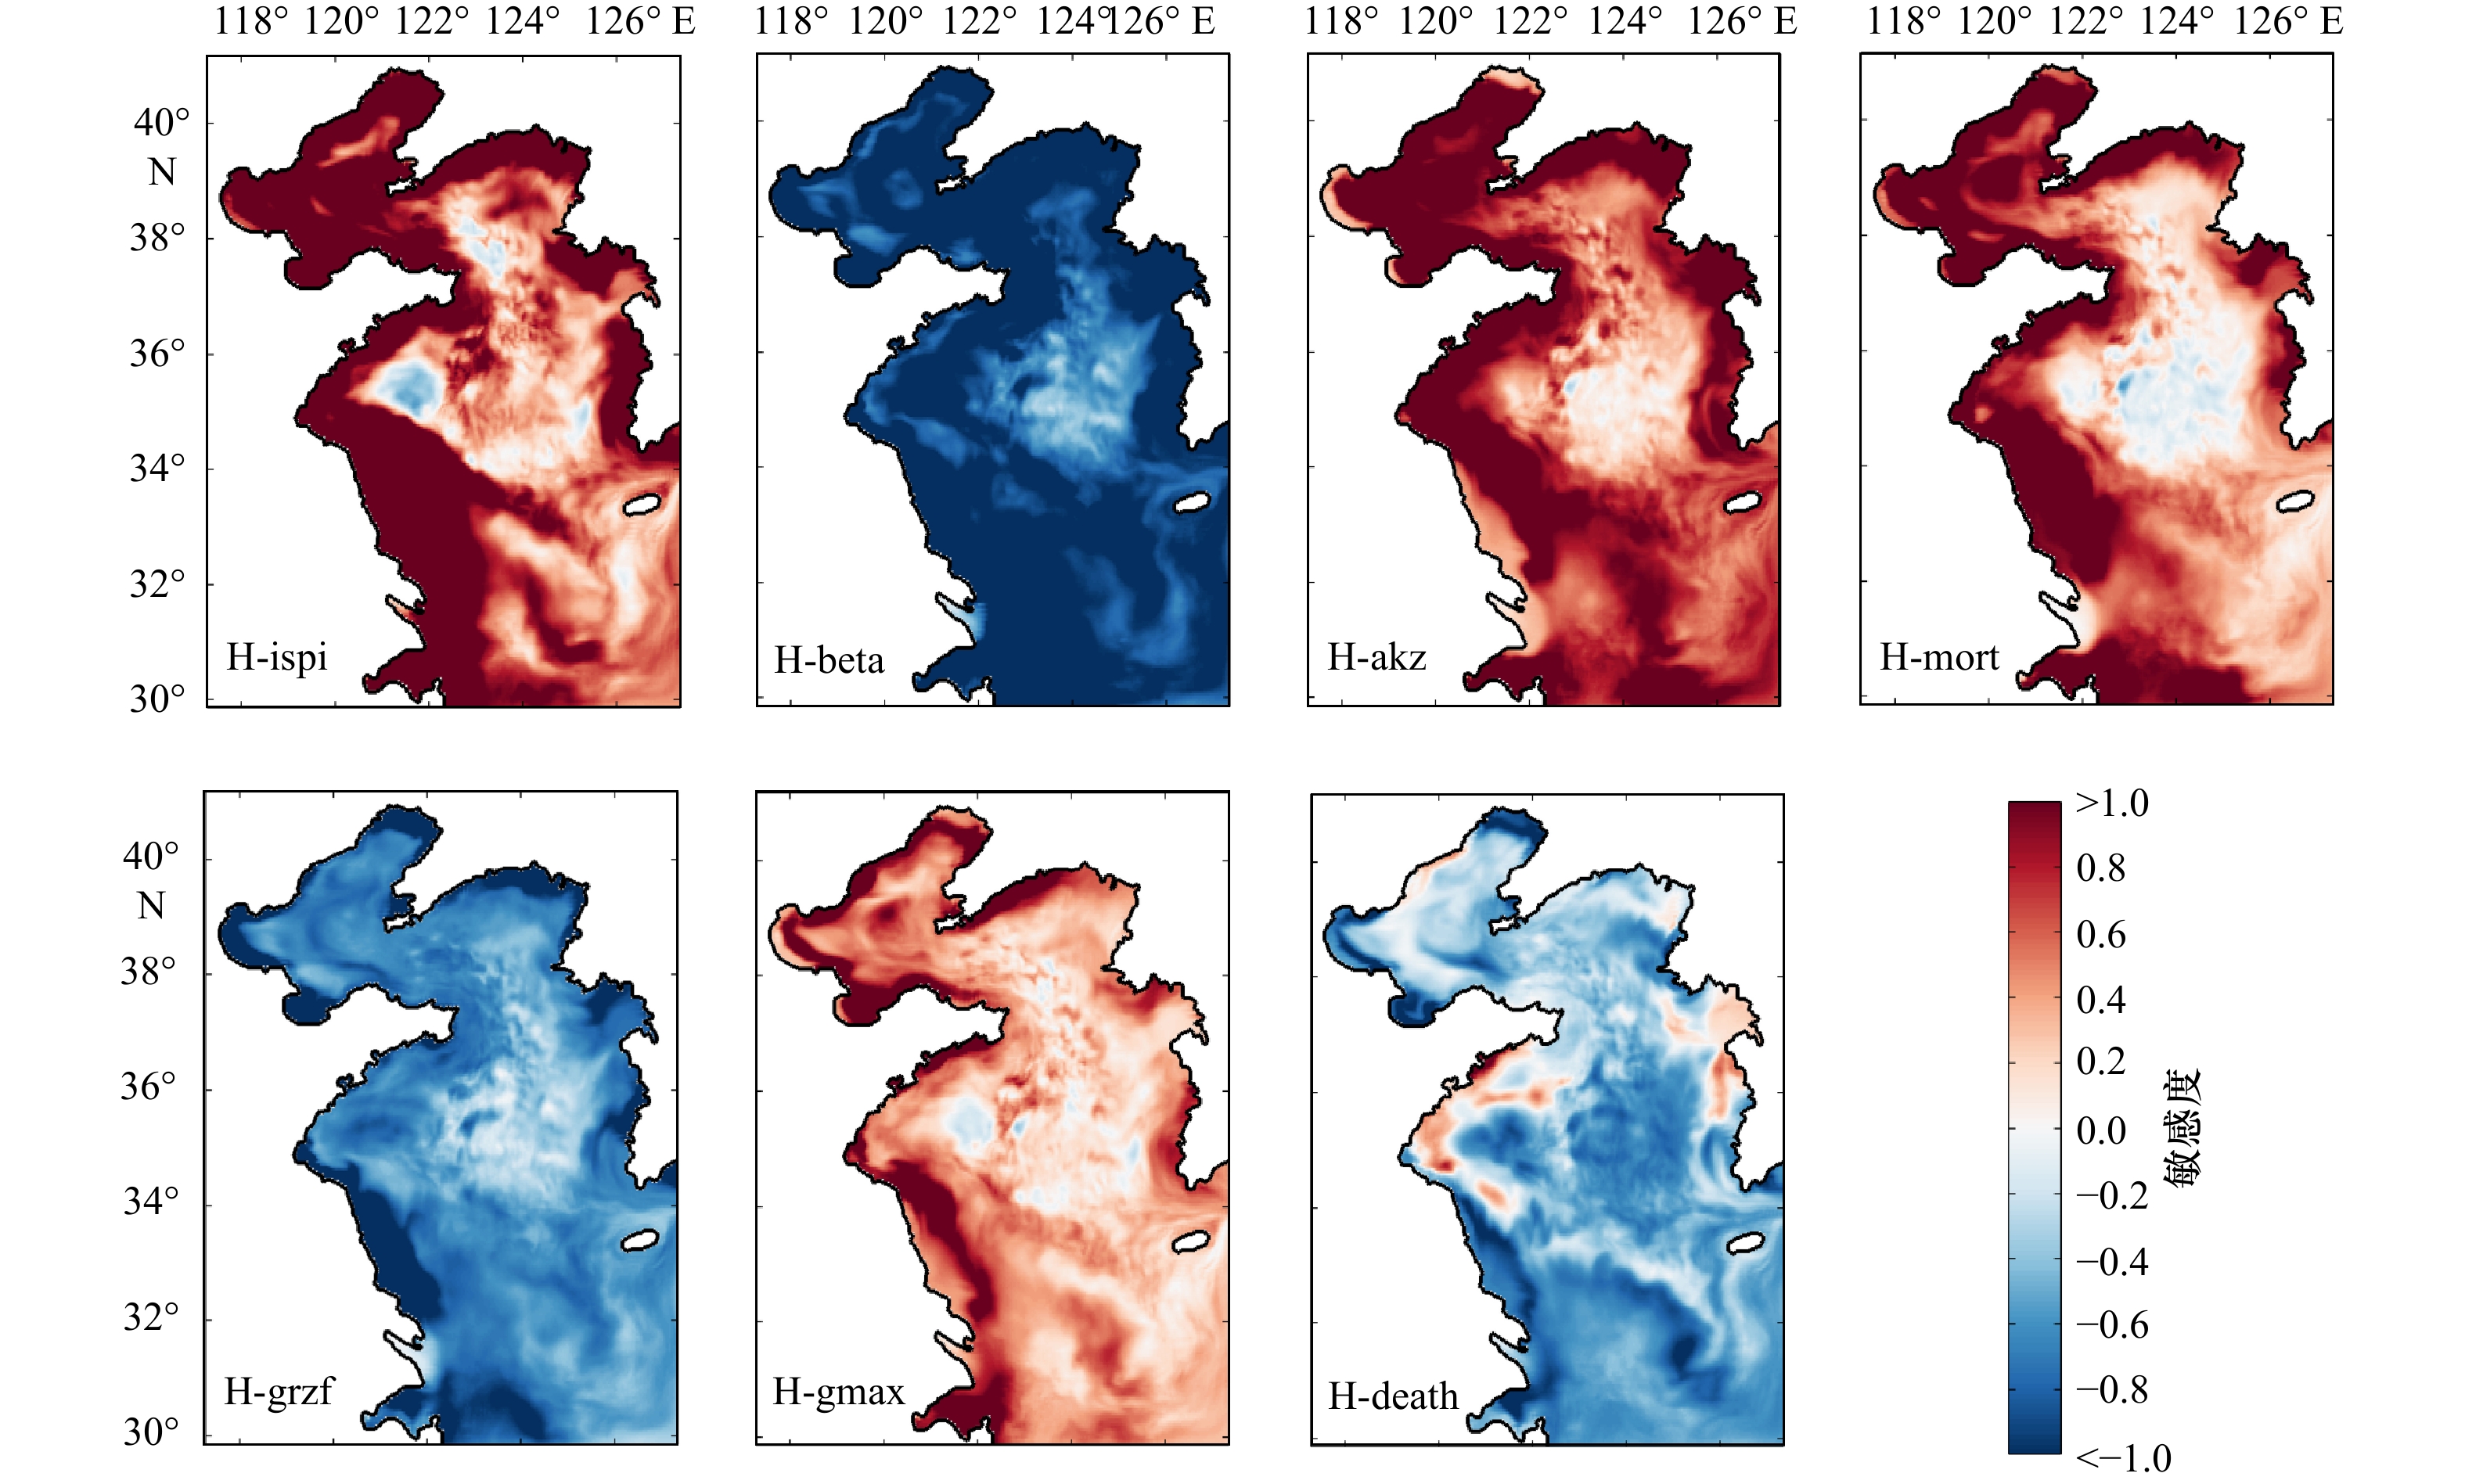
图 5 关于浮游植物P-I曲线初始斜率(H-ispi)、浮游动物最大捕食率(H-beta)、浮游动物捕食半饱和常数(H-akz)、浮游动物捕食效率(H-grzf)、浮游动物死亡率(H-mort)、浮游植物最大生长率(H-gmax)和浮游植物死亡率(H-death)的敏感度分布
Fig. 5 Parameter sensitivity distribution of slope of P-I curve of phytoplankton (H-ispi), maximum grazing rate of zooplankton (H-beta), half saturation constant for zooplankton grazing (H-akz), grazing efficiency (H-grzf), specific mortality rate of zooplankton (H-mort), maximum specific growth rate (H-gmax), and death rate (H-death) of phytoplankton
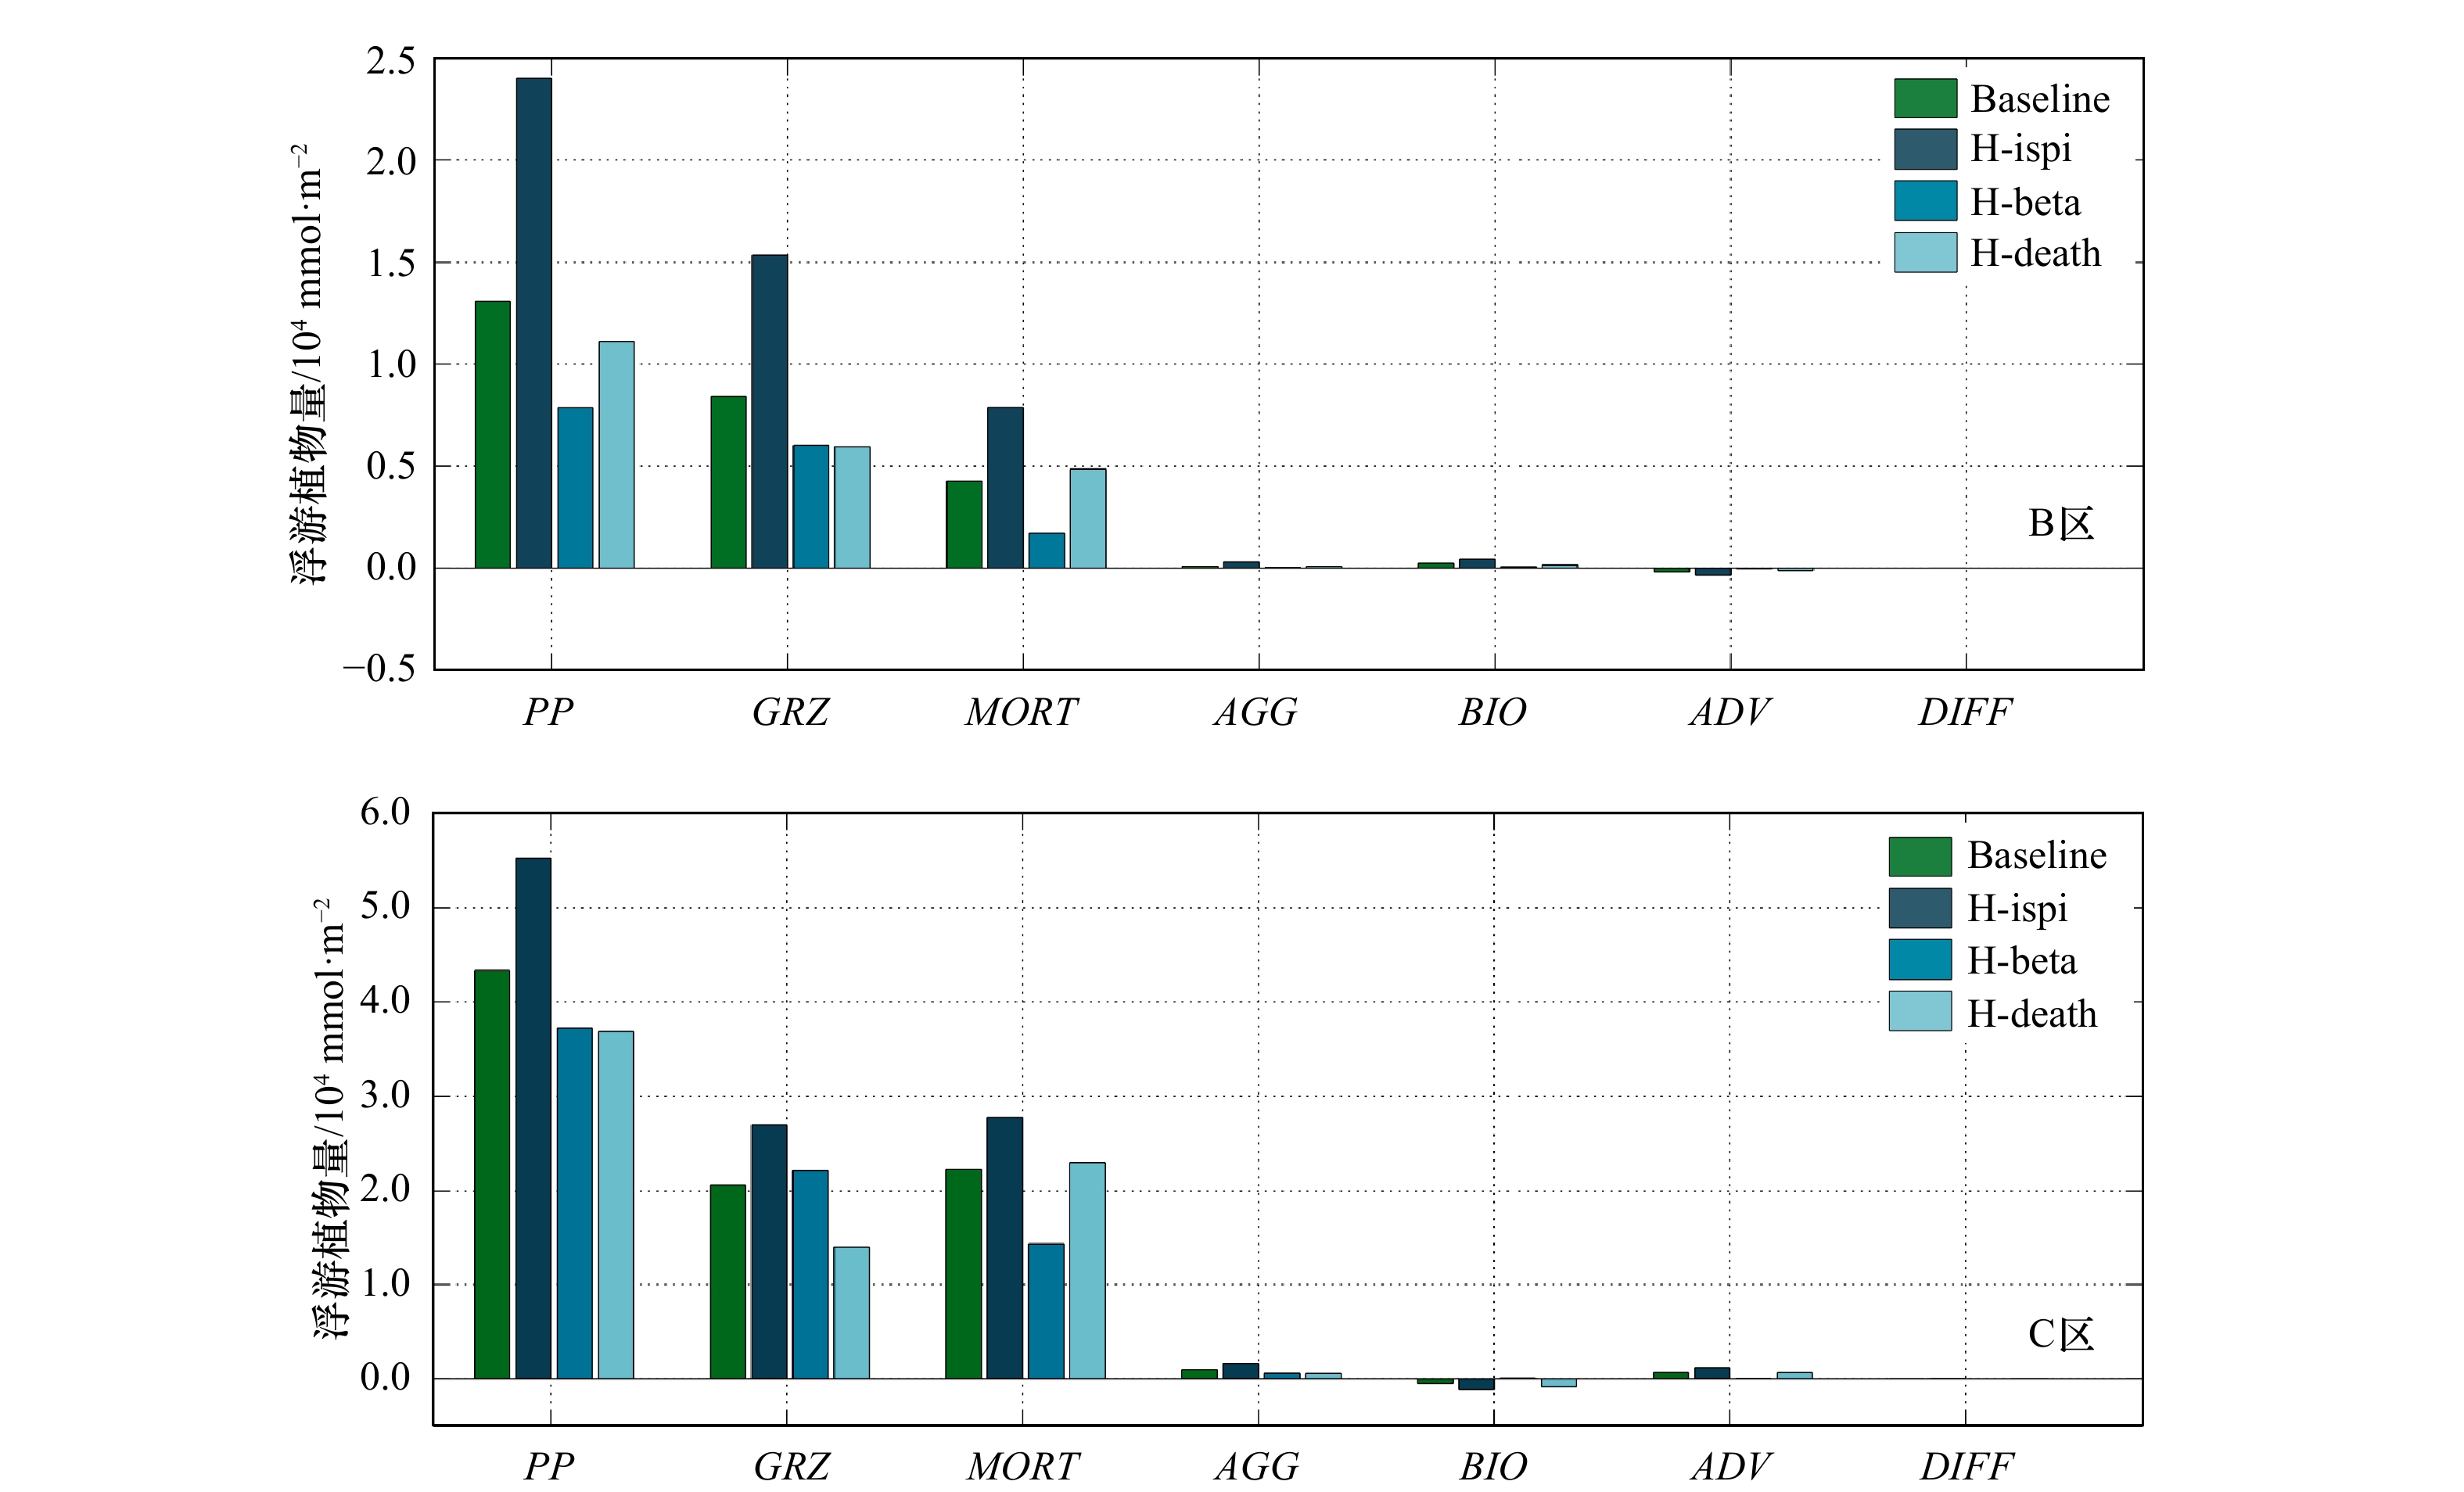
图 6 关于浮游植物P-I曲线初始斜率(H-ispi)、浮游动物最大捕食率(H-beta)、浮游植物死亡率(H-death)以及基础实验中B区和C区浮游植物生物量收支。BIO表示净的生物作用(PP-GRZ-MORT-AGG)
Fig. 6 Phytoplankton budget in B and C districts in baseline, initial slope of P-I curve of phytoplankton (H-ispi), maximum grazing rate of zooplankton (H-beta), death rate of phytoplankton (H-death) simulations. BIO represents net biological influence (PP-GRZ-MORT-AGG)
表 1 生态模型参数取值
Tab. 1 Biological parameters
描述 参数 取值 单位 文献来源 S1最大生长率 gmaxs1 2 d–1 [23] S2最大生长率 gmaxs2 2.5 d–1 [23] Z1最大捕食率 beta1 1.6 d–1 [29] Z2最大捕食率 beta2 0.65 d–1 [30] Z1捕食半饱和常数(以氮计) akz1 0.5 mmol/m3 [23] Z2捕食半饱和常数(以氮计) akz2 0.25 mmol/m3 [23] 光合作用有效短波辐射 PARfrac 0.46 [29] S1 P–I曲线初始斜率 amaxs1 0.025 d–1·(W·m–2)–1 [23] S2 P–I曲线初始斜率 amaxs2 0.025 d–1·(W·m–2)–1 [23] S1铵盐抑制系数(以氮计) pis1 5.59 mmol/m3 [23] S2铵盐抑制系数(以氮计) pis2 4 mmol/m3 [31] S1 硝酸盐吸收半饱和常数(以氮计) akno3s1 1 mmol/m3 [32] S2 硝酸盐吸收半饱和常数(以氮计) akno3s2 2 mmol/m3 [6] S1 铵盐吸收半饱和常数(以氮计) aknh4s1 0.1 mmol/m3 [33] S2 铵盐吸收半饱和常数(以氮计) aknh4s2 0.3 mmol/m3 [34] S1 磷酸盐吸收半饱和常数(以氮计) akpo4s1 0.065 mmol/m3 [6] S2 磷酸盐吸收半饱和常数(以氮计) akpo4s2 0.125 mmol/m3 [6] S2 硅酸盐吸收半饱和常数(以氮计) aksio4s2 4.5 mmol/m3 [31] 海水光吸收系数 ak1 0.036 m–1 [29] 浮游植物光吸收系数 ak2 0.11 m–1·(mmol·m–3)–1 [30] Z2 死亡率 bgamma0 0.1 d–1 [34] Z1 捕食效率 bgamma1 0.75 d–1 [35] Z2 捕食效率 bgamma2 0.75 d–1 [35] S1 死亡率 bgamma3 0.2 d–1 [31] S2 死亡率 bgamma4 0.1 d–1 [36] 碎屑分解速率 bgamma5 0.03 d–1 浮游植物凝聚速率 bgamma6 0.005 d–1 硝化速率 bgamma7 0.25 d–1 [37] 小型碎屑沉降速率 wsd 15 m·d–1 [31] 含硅碎屑沉降速率 wsdsi 25 m·d–1 [38] S2 沉降速率 wsp 1 m·d–1 [23] 浮游植物氮磷吸收比 n2p 16 mol(以N计)/mol(以P计)  下载: 导出CSV
表 2 浮游植物量对模型参数的敏感性
Tab. 2 Sensitivity of model parameter to phytoplankton.
实验名称 描述 浮游植物量变化率 敏感度 敏感程度 H-ispi 浮游植物P-I曲线初始斜率 74.95% 149.9%±0.88 +++ H-beta 浮游动物的最大捕食率 –52.91% –105.81%±0.06 – – – H-akz 浮游动物捕食半饱和常数 46.42% 92.84%±0.21 ++ H-mort 浮游动物死亡率 40.07% 80.14%±0.44 ++ H-grzf 浮游动物捕食效率 –36.41% –72.81%±0.07 – – H-gmax 浮游植物最大生长率 24.93% 49.85%±0.25 ++ H-death 浮游植物死亡率 –24.39% –48.77%±0.09 – – H-wsd 沉降速率 –5.85% –11.7%±0.04 – H-n2p 浮游植物生长所需氮磷比 –2.77% 5.54%±0.05 + H-kpo4 浮游植物生长磷酸盐半饱和常数 –2.34% –4.68%±0.03 – H-agg 浮游植物凝结速率 –2.11% –4.21%±0.02 – H-kon3 浮游植物生长硝酸盐半饱和常数 –0.56% –1.11%±0.03 – H-nitr 硝化速率 0.46% 0.92%±0.03 +
下载: 导出CSV
表 3 B区和C区的敏感度
Tab. 3 Parameter sensitivity in District B and C
实验名称 B区 C区 敏感度 敏感度排序 敏感度 敏感度排序 H-ispi 150.74% 1 46.36% 3 H-beta –98.50% 3 –64.57% 1 H-akz 123.57% 2 36.59% 5 H-grzf –66.17% 5 –37.16% 4 H-mort 92.24% 4 5.24% 7 H-gmax 55.01% 6 22.15% 6 H-death –40.80% 7 –55.78% 2 H-wsd –18.06% 8 1.66% 10 H-n2p 0.24% 13 2.28% 8 H-kpo4 0.65% 11 0.36% 13 H-agg –1.79% 10 –1.63% 11 H-kno3 –3.06% 9 0.44% 12 H-nitr 0.45% 12 1.7% 9
下载: 导出CSV
表 4 关于浮游植物P-I曲线初始斜率(H-ispi)、浮游动物最大捕食率(H-beta)、浮游植物死亡率(H-death)实验中B区和C区浮游植物源汇项相对于基础实验的变化率
Tab. 4 Change rates of phytoplankton source/sink terms in cases initial slope of P-I curve of phytoplankton (H-ispi), maximum grazing rate of zooplankton (H-beta), death rate of phytoplankton (H-death) relative to baseline in B and C districts
实验 H-ispi H-beta H-death B区 C区 B区 C区 B区 C区 PP 84.15% 27.22% –39.73% –14.07% –15.01% –15.09% GRZ 82.58% 31.09% –28.19% 7.83% –29.20% –31.76% MORT 84.45% 24.50% –59.39% –35.26% 14.14% 3.33% AGG 219.87% 60.86% –73.95% –38.22% –23.02% –39.90% BIO 939.95% 140.44% –116.27% –76.00% –30.67% 74.04% ADV 103.11% 71.48% –78.85% –95.56% –35.68% –1.32% DIFF 8.85% 92.53% –0.54% –110.61% 7.13% 11.79%
下载: 导出CSV
-
[1] Denman K L. Modelling planktonic ecosystems: parameterizing complexity[J]. Progress in Oceanography, 2003, 57(3/4): 429−452. [2] Losa S N, Kivman G A, Ryabchenko V A. Weak constraint parameter estimation for a simple ocean ecosystem model: what can we learn about the model and data?[J]. Journal of Marine Systems, 2004, 45(1/2): 1−20. [3] Mateus M D, Franz G. Sensitivity analysis in a complex marine ecological model[J]. Water, 2015, 7(5): 2060−2081. [4] Kishi M J, Nakata K, Ishikawa K. Sensitivity analysis of a coastal marine ecosystem[J]. Journal of the Oceanographical Society of Japan, 1981, 37(3): 120−134. doi: 10.1007/BF02308096 [5] 高会旺, 孙文心, 翟雪梅. 水层生态系统动力学模式参数的敏感性分析[J]. 青岛海洋大学学报, 1999, 29(3): 398−404.Gao Huiwang, Sun Wenxin, Zhai Xuemei. Sensitive analysis of the parameters of a pelagic ecosystem dynamic model[J]. Journal of Ocean University of Qingdao, 1999, 29(3): 398−404. [6] 赵亮. 渤海浮游植物生态动力学模型研究[D]. 青岛: 青岛海洋大学, 2002.Zhao Liang. A modeling study of the phytoplankton dynamic in the Bohai Sea[D]. Qingdao: Ocean University of China, 2002. [7] Kuroda H, Kishi M J. A data assimilation technique applied to estimate parameters for the NEMURO marine ecosystem model[J]. Ecological Modelling, 2004, 172(1): 69−85. doi: 10.1016/j.ecolmodel.2003.08.015 [8] Ji X L, Liu G M, Gao S, et al. Parameter sensitivity study of the biogeochemical model in the China coastal seas[J]. Acta Oceanologica Sinica, 2015, 34(12): 51−60. doi: 10.1007/s13131-015-0762-0 [9] Losa S N, Vézina A, Wright D, et al. 3D ecosystem modelling in the North Atlantic: relative impacts of physical and biological parameterizations[J]. Journal of Marine Systems, 2006, 61(3/4): 230−245. [10] Fennel K, Losch M, Schröter J, et al. Testing a marine ecosystem model: sensitivity analysis and parameter optimization[J]. Journal of Marine Systems, 2001, 28(1/2): 45−63. [11] 王春晖. 海洋生态系统动力学模型伴随同化研究及应用[D]. 青岛: 中国海洋大学, 2013.Wang Chunhui. Numerical study and application of a marine ecosystem dynamical model with adjoint assimilation method[D]. Qingdao: Ocean University of China, 2013. [12] 俞光耀, 吴增茂, 张志南, 等. 胶州湾北部水层生态动力学模型与模拟Ⅰ. 胶州湾北部水层生态动力学模型[J]. 青岛海洋大学学报, 1999, 29(3): 421−428.Yu Guangyao, Wu Zengmao, Zhang Zhinan, et al. A pelagic ecosystem model and simulation of the northern part of Jiaozhou Bay Ⅰ. Introduction to pelagic ecosystem model[J]. Journal of Ocean University of Qingdao, 1999, 29(3): 421−428. [13] 吴增茂, 俞光耀, 张志南, 等. 胶州湾北部水层生态动力学模型与模拟Ⅱ. 胶州湾北部水层生态动力学的模拟研究[J]. 青岛海洋大学学报, 1999, 29(3): 429−435.Wu Zengmao, Yu Guangyao, Zhang Zhinan, et al. A pelagic ecosystem model and simulation of the northern part of Jiaozhou Bay Ⅱ. A simulation study on the pelagic ecosystem Seasonal variations[J]. Journal of Ocean University of Qingdao, 1999, 29(3): 429−435. [14] Zhu Hai, Cui Maochang. Coupled physical-ecological modelling of the central part of Jiaozhou Bay Ⅰ. Physical modelling[J]. Chinese Journal of Oceanology and Limnology, 2000, 18(4): 309−314. doi: 10.1007/BF02876077 [15] Cui Maochang, Zhu Hai. Coupled physical-ecological modelling in the central part of Jiaozhou Bay Ⅱ. Coupled with an ecological model[J]. Chinese Journal of Oceanology and Limnology, 2001, 19(1): 21−28. doi: 10.1007/BF02842785 [16] 魏皓, 赵亮, 于志刚, 等. 渤海浮游植物生物量时空变化初析[J]. 青岛海洋大学学报, 2003, 33(2): 173−179. doi: 10.3969/j.issn.1672-5174.2003.02.002Wei Hao, Zhao Liang, Yu Zhigang, et al. Variation of the phytoplankton biomass in the Bohai Sea[J]. Journal of Ocean University of Qingdao, 2003, 33(2): 173−179. doi: 10.3969/j.issn.1672-5174.2003.02.002 [17] Wei Hao, Sun Jun, Moll A, et al. Phytoplankton dynamics in the Bohai Sea—observations and modelling[J]. Journal of Marine Systems, 2004, 44(3/4): 233−251. [18] Zhao Liang, Wei Hao. The influence of physical factors on the variation of phytoplankton and nutrients in the Bohai Sea[J]. Journal of Oceanography, 2005, 61(2): 335−342. doi: 10.1007/s10872-005-0044-0 [19] 夏洁, 高会旺. 南黄海东部海域浮游生态系统要素季节变化的模拟研究[J]. 安全与环境学报, 2006, 6(4): 59−65. doi: 10.3969/j.issn.1009-6094.2006.04.016Xia Jie, Gao Huiwang. Simulation on seasonal cycle vertical structure of plankton ecosystem in eastern area of South Yellow Sea[J]. Journal of Safety and Environment, 2006, 6(4): 59−65. doi: 10.3969/j.issn.1009-6094.2006.04.016 [20] 刘浩, 尹宝树. 渤海生态动力过程的模型研究Ⅰ. 模型描述[J]. 海洋学报, 2006, 28(6): 21−31. doi: 10.3321/j.issn:0253-4193.2006.06.004Liu Hao, Yin Baoshu. Model study on Bohai ecosystem Ⅰ. Model description and primary productivity[J]. Haiyang Xuebao, 2006, 28(6): 21−31. doi: 10.3321/j.issn:0253-4193.2006.06.004 [21] 刘浩, 潘伟然. 营养盐负荷对浮游植物水华影响的模型研究[J]. 水科学进展, 2008, 19(3): 345−351. doi: 10.3321/j.issn:1001-6791.2008.03.007Liu Hao, Pan Weiran. Model for study on Impact of external nutrient sources on the Algalbloom[J]. Advances in Water Science, 2008, 19(3): 345−351. doi: 10.3321/j.issn:1001-6791.2008.03.007 [22] Shchepetkin A F, McWilliams J C. The regional oceanic modeling system (ROMS): a split-explicit, free-surface, topography-following-coordinate oceanic model[J]. Ocean Modelling, 2005, 9(4): 347−404. doi: 10.1016/j.ocemod.2004.08.002 [23] Chai F, Dugdale R C, Peng T H, et al. One-dimensional ecosystem model of the equatorial Pacific upwelling system. Part Ⅰ: model development and silicon and nitrogen cycle[J]. Deep–Sea Research Part Ⅱ: Topical Studies in Oceanography, 2002, 49(13/14): 2713−2745. [24] Dee D P, Uppala S M, Simmons A J, et al. The ERA-Interim reanalysis: configuration and performance of the data assimilation system[J]. Quarterly Journal of the Royal Meteorological Society, 2011, 137(656): 553−597. doi: 10.1002/qj.v137.656 [25] Wang Jianing, Yan Weijin, Chen Nengwang, et al. Modeled long-term changes of DIN:DIP ratio in the Changjiang River in relation to Chl-α and DO concentrations in adjacent estuary[J]. Estuarine, Coastal and Shelf Science, 2015, 166: 153−160. doi: 10.1016/j.ecss.2014.11.028 [26] Zhang Jing. Nutrient elements in large Chinese estuaries[J]. Continental Shelf Research, 1996, 16(8): 1023−1045. doi: 10.1016/0278-4343(95)00055-0 [27] Liu S M, Hong G H, Zhang J, et al. Nutrient budgets for large Chinese estuaries[J]. Biogeosciences, 2009, 6(10): 2245−2263. doi: 10.5194/bg-6-2245-2009 [28] Tong Yindong, Zhao Yue, Zhen Gengchong, et al. Nutrient loads flowing into coastal waters from the main rivers of China (2006–2012)[J]. Scientific Reports, 2015, 5: 16678. doi: 10.1038/srep16678 [29] Zielinski O, Llinás O, Oschlies A, et al. Underwater light field and its effect on a one-dimensional ecosystem model at station ESTOC, north of the Canary Islands[J]. Deep–Sea Research Part Ⅱ: Topical Studies in Oceanography, 2002, 49(17): 3529−3542. doi: 10.1016/S0967-0645(02)00096-6 [30] Evans G T, Parslow J S. A model of annual plankton cycles[J]. Biological Oceanography, 1985, 3(3): 327−347. [31] Zhou Feng, Chai Fei, Huang Daji, et al. Investigation of hypoxia off the Changjiang Estuary using a coupled model of ROMS-CoSiNE[J]. Progress in Oceanography, 2017, 159: 237−254. doi: 10.1016/j.pocean.2017.10.008 [32] Fujii M, Chai Fei. Modeling carbon and silicon cycling in the equatorial Pacific[J]. Deep–Sea Research Part Ⅱ: Topical Studies in Oceanography, 2007, 54(5/7): 496−520. [33] Fujii M, Boss E, Chai F. The value of adding optics to ecosystem models: a case study[J]. Biogeosciences Discussions, 2007, 4(3): 1585−1631. doi: 10.5194/bgd-4-1585-2007 [34] Kishi M J, Kashiwai M, Ware D M, et al. NEMURO—a lower trophic level model for the North Pacific marine ecosystem[J]. Ecological Modelling, 2007, 202(1/2): 12−25. [35] Popova E E, Lozano C J, Srokosz M A, et al. Coupled 3D physical and biological modelling of the mesoscale variability observed in North-East Atlantic in spring 1997: biological processes[J]. Deep–Sea Research Part Ⅰ: Oceanographic Research Papers, 2002, 49(10): 1741−1768. doi: 10.1016/S0967-0637(02)00091-2 [36] Ji Rubao, Davis C, Chen Changsheng, et al. Influence of local and external processes on the annual nitrogen cycle and primary productivity on Georges Bank: a 3-D biological–physical modeling study[J]. Journal of Marine Systems, 2008, 73(1/2): 31−47. [37] Kawamiya M, Kishi M J, Suginohara N. An ecosystem model for the North Pacific embedded in a general circulation model: Part Ⅰ: Model description and characteristics of spatial distributions of biological variables[J]. Journal of Marine Systems, 2000, 25(2): 129−157. doi: 10.1016/S0924-7963(00)00012-9 [38] Lima I D, Doney S C. A three-dimensional, multinutrient, and size-structured ecosystem model for the North Atlantic[J]. Global Biogeochemical Cycles, 2004, 18(3): GB3019. [39] 官文江, 何贤强, 潘德炉, 等. 渤、黄、东海海洋初级生产力的遥感估算[J]. 水产学报, 2005, 29(3): 367−372.Guan Wenjiang, He Xianqiang, Pan Delu, et al. Estimation of ocean primary production by remote sensing in Bohai Sea, Yellow Sea and East China Sea[J]. Journal of Fisheries of China, 2005, 29(3): 367−372. [40] 朱兰部, 赵保仁. 渤、黄、东海透明度的分布与变化[J]. 海洋湖沼通报, 1991(3): 1−11.Zhu Lanbu, Zhao Baoren. Distributions and variations of the transparency in the Bohai Sea, Yellow Sea and East China Sea[J]. Transactions of Oceanology and Limnology, 1991(3): 1−11. [41] 高会旺, 杨华, 张英娟, 等. 渤海初级生产力的若干理化影响因子初步分析[J]. 青岛海洋大学学报, 2001, 31(4): 487−494. doi: 10.3969/j.issn.1672-5174.2001.04.004Gao Huiwang, Yang Hua, Zhang Yingjuan, et al. A preliminary study on factors affecting the primary production in the Bohai Sea[J]. Journal of Ocean University of Qingdao, 2001, 31(4): 487−494. doi: 10.3969/j.issn.1672-5174.2001.04.004 [42] 洪华生. 中国区域海洋学: 化学海洋学[M]. 北京: 海洋出版社, 2012.Hong Huasheng. Regional Oceanography of China Seas: Chemical Oceanography[M]. Beijing: China Ocean Press, 2012. -

 点击查看大图
计量
- 文章访问数: 427
- HTML全文浏览量: 25
- PDF下载量: 203
- 被引次数: 0
