

Stock assessment for Indian Ocean blue marlin (Makaira nigricans) using Catch-MSY model
-
摘要: Catch-MSY模型可仅依靠渔获量数据进行渔业资源评估,在数据缺乏状况下能暂时替代标准资源评估模型。本研究以印度洋蓝枪鱼(Makaira nigricans)为例,根据有、无信息的内禀增长率r和环境容纳量K的先验分布,设立15组情景进行模型灵敏度分析、资源评估和预测。结果表明,参数r和K呈强烈的负相关,而最大可持续产量(Maximum Sustainable Yield,MSY)与参数r呈正相关;数据时间序列长度对评估结果影响有限,而模型对起止年渔获量较为敏感。资源状况评估表明,印度洋蓝枪鱼资源生物量状况良好,即B2015/BMSY大于1;而开发状况除其中两种情景外,均为过度捕捞,即F2015/FMSY大于1。资源预测表明,为使未来10年内B/BMSY>1的概率超过50%,需将渔获量缩减至当前渔获量的90%(13.86 kt);考虑到该模型在数据缺乏状况下会更加保守,若将当前渔获量的100%~110%(15.40~16.94 kt)设为管理目标,则未来5年内B/BMSY >1的概率超过50%。Abstract: Catch-MSY method can temporarily replace conventional stock assessment models in making management decisions for a data-limited fishery, even when only catch data are available. In this study, for the sensitivity analysis and assessment of the Indian Ocean blue marlin, we established 15 scenarios based on non-informative and informative prior distributions of the intrinsic growth rate r and carrying capacity K. Sensitivity analysis reveals a high negative correlation between parameters r and K, and the estimated maximum sustainable yield (MSY) increases with r. Sensitivity analysis shows that the length of catch time series has less influences on the results of the assessments, but the assessments are sensitive to catch data in the first and last year. The assessment results reveal that the status of total biomass is optimal, with the ratio of B2015 to BMSY higher than 1. Exception is only two scenarios, the exploitation status under the other scenarios would be overfishing, since all the ratios of F2015 to FMSY would be higher than 1. Projections of future stock status show that, to attain the objective of maintaining B/BMSY>1 with a probability of higher than 50% in the next 10 a, the catch would have to be reduced to 90% (13 860 t) of the current level. Considering that the catch-MSY method is conservative under data-limited conditions, maintaining 100% to 110% (15 400–16 940 t) of the current catch could achieve the objective of maintaining B/BMSY >1 with a probability of higher than 50% in the next 5 a.
-
Key words:
- Indian Ocean /
- Makaira nigricans /
- catch-only model /
- stock assessment /
- management strategy
-
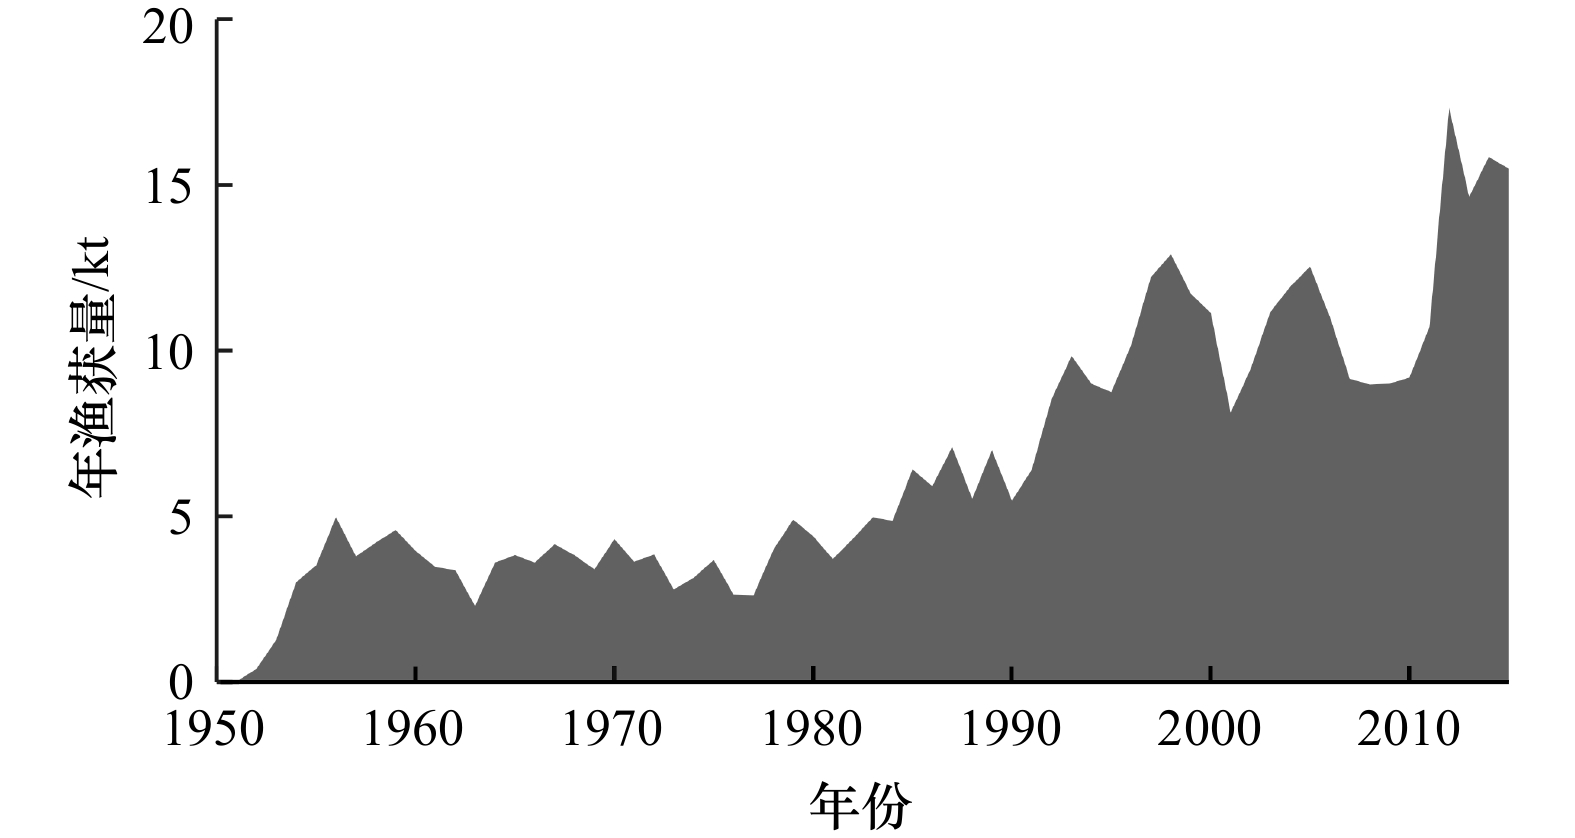
图 1 印度洋蓝枪鱼历史渔获量(1950-2015年)
Fig. 1 Trend of catch of blue marlin in the Indian Ocean (1950 to 2015)

图 2 不同情景的参数先验与后验分布
Fig. 2 Prior and posterior distribution of the key parameters based on different scenarios
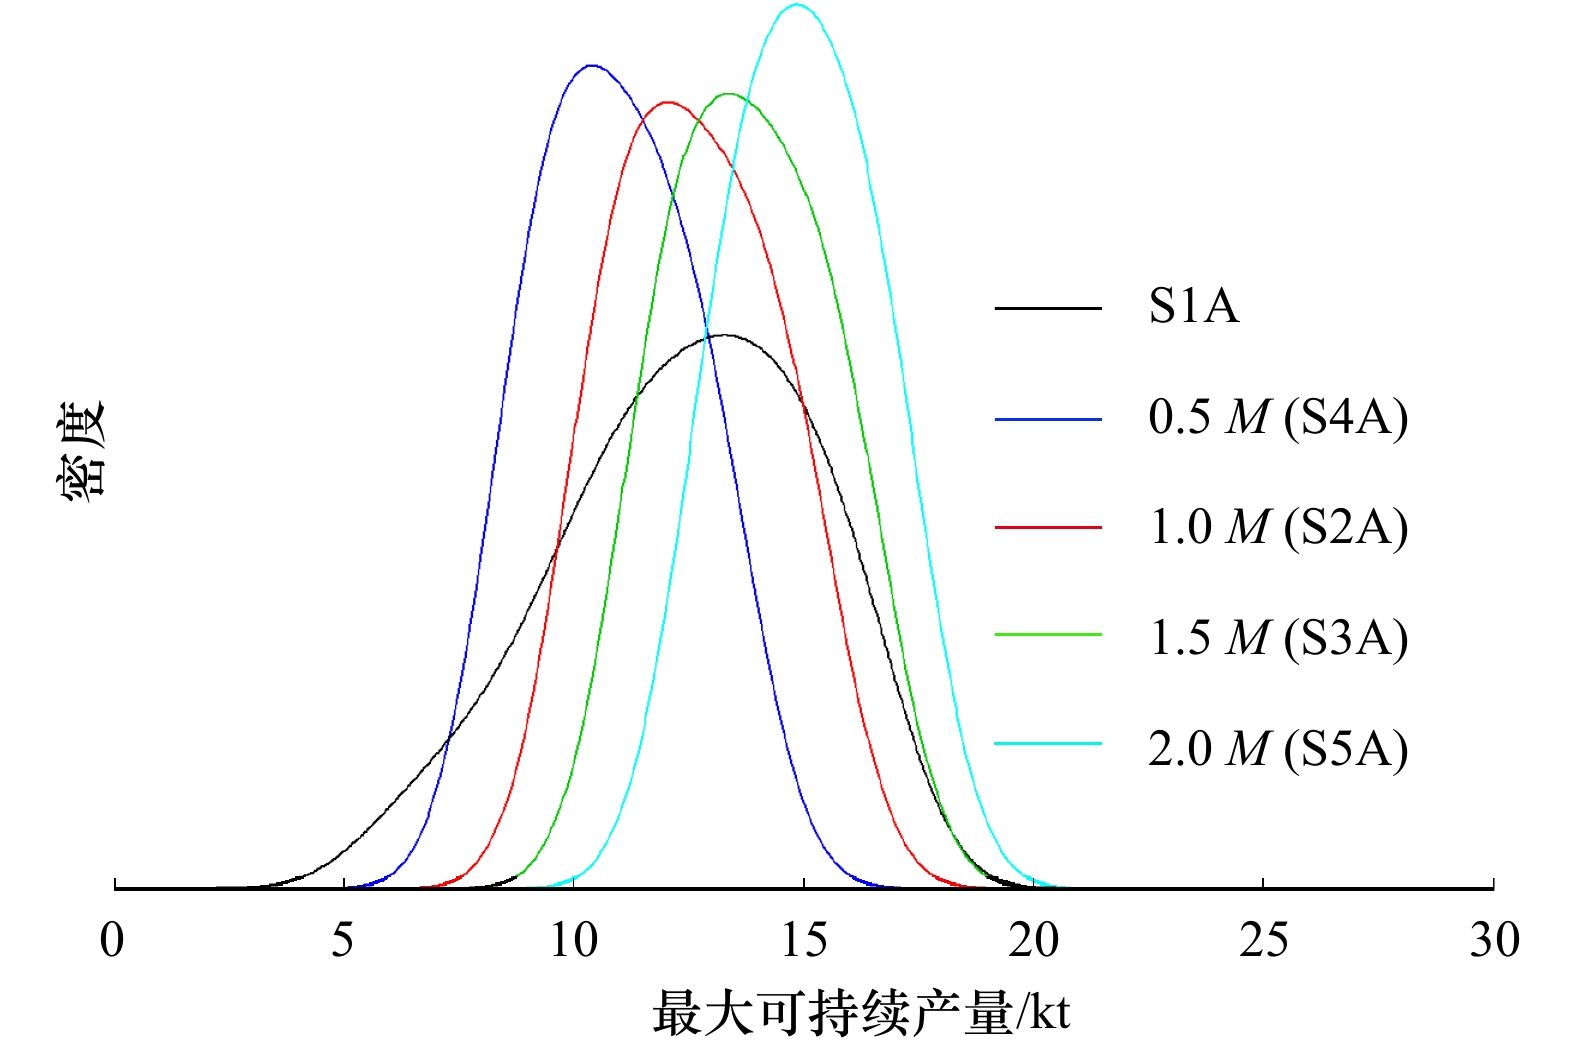
图 3 不同情景下最大可持续产量估算结果
Fig. 3 Estimated maximum sustainable yield based on different scenarios
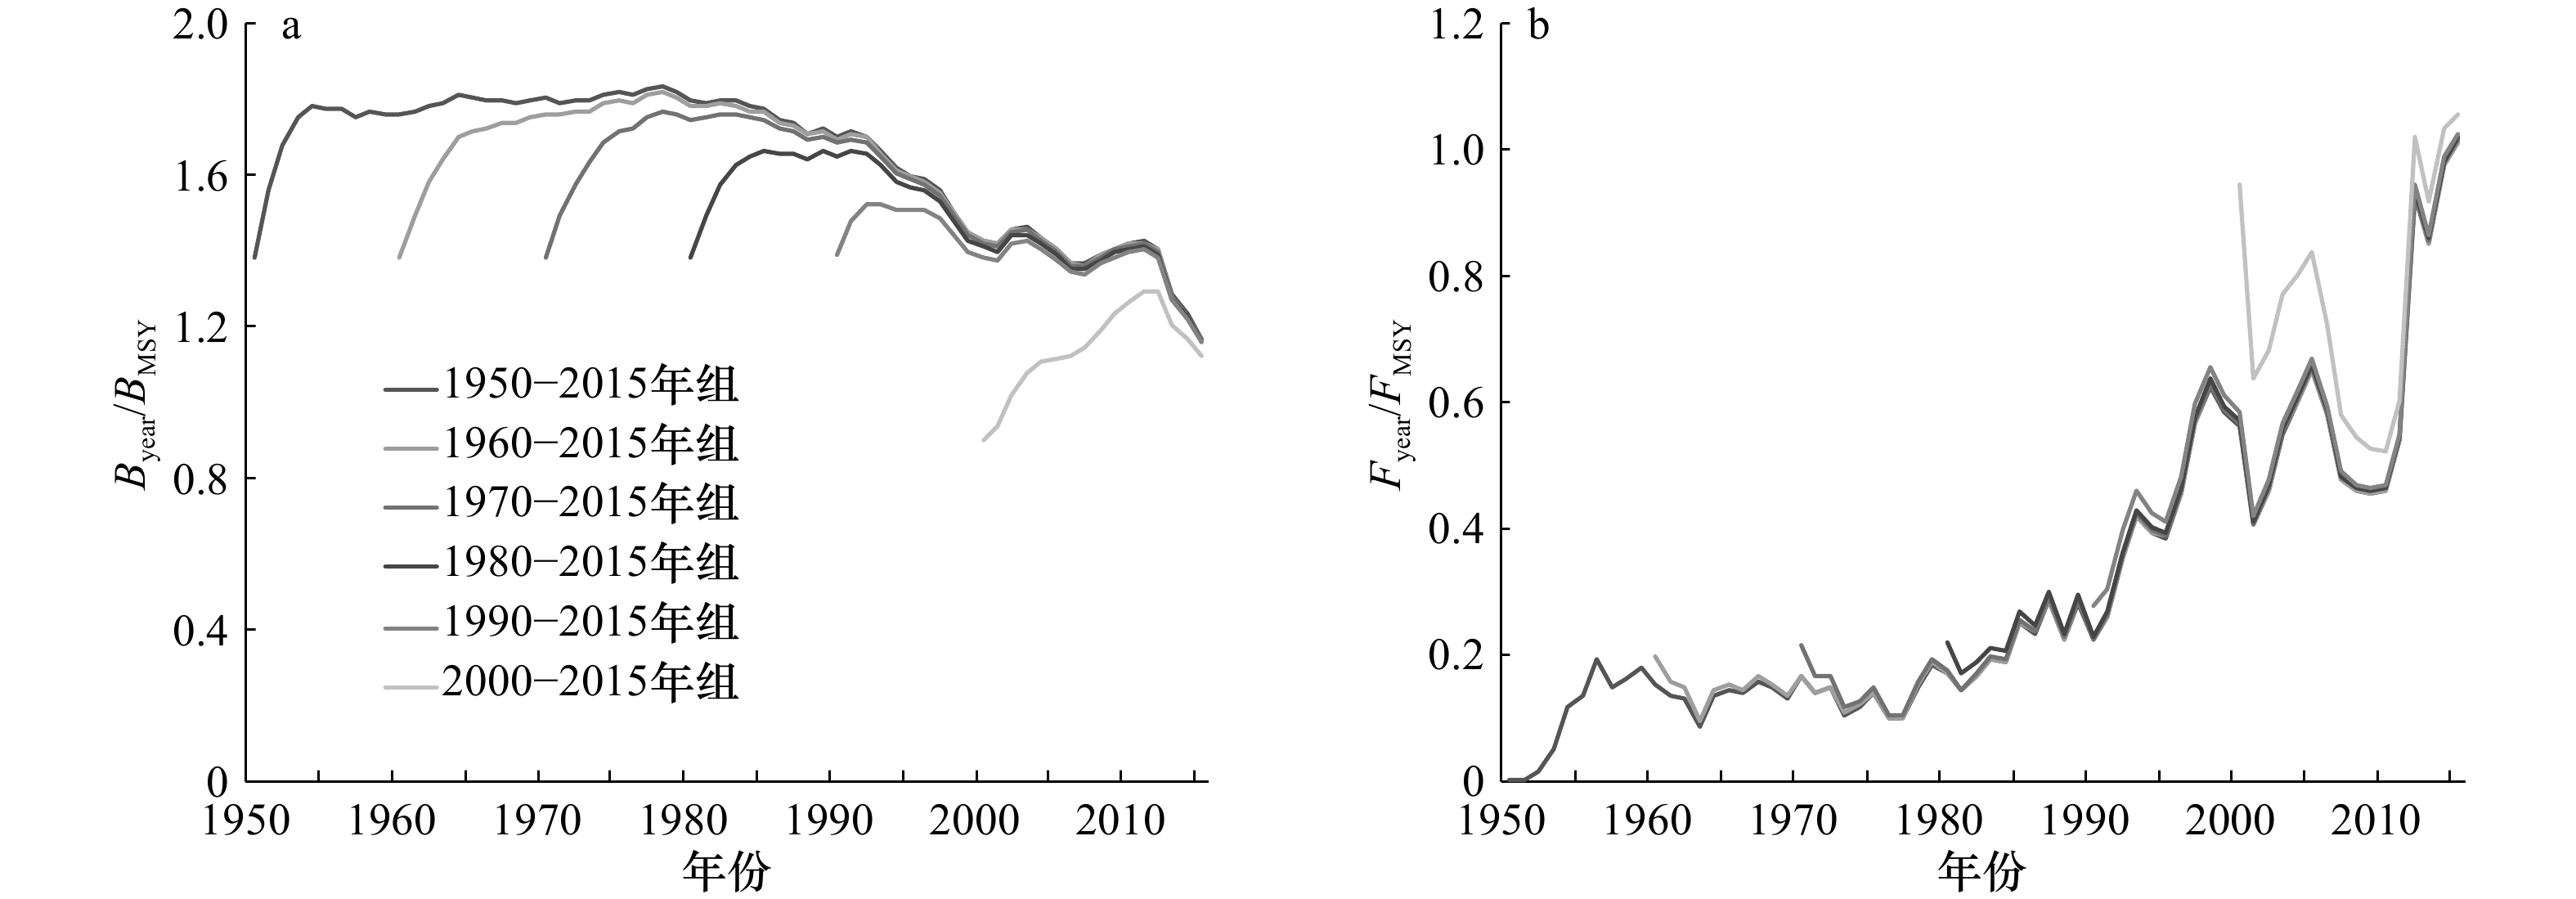
图 4 不同时间序列下的资源评估结果
a. 相对生物量变动;b. 相对捕捞死亡系数变动
Fig. 4 Stock assessment result based on different time series
a. Time trends of relative biomass; b. time trends of relative fishing mortality
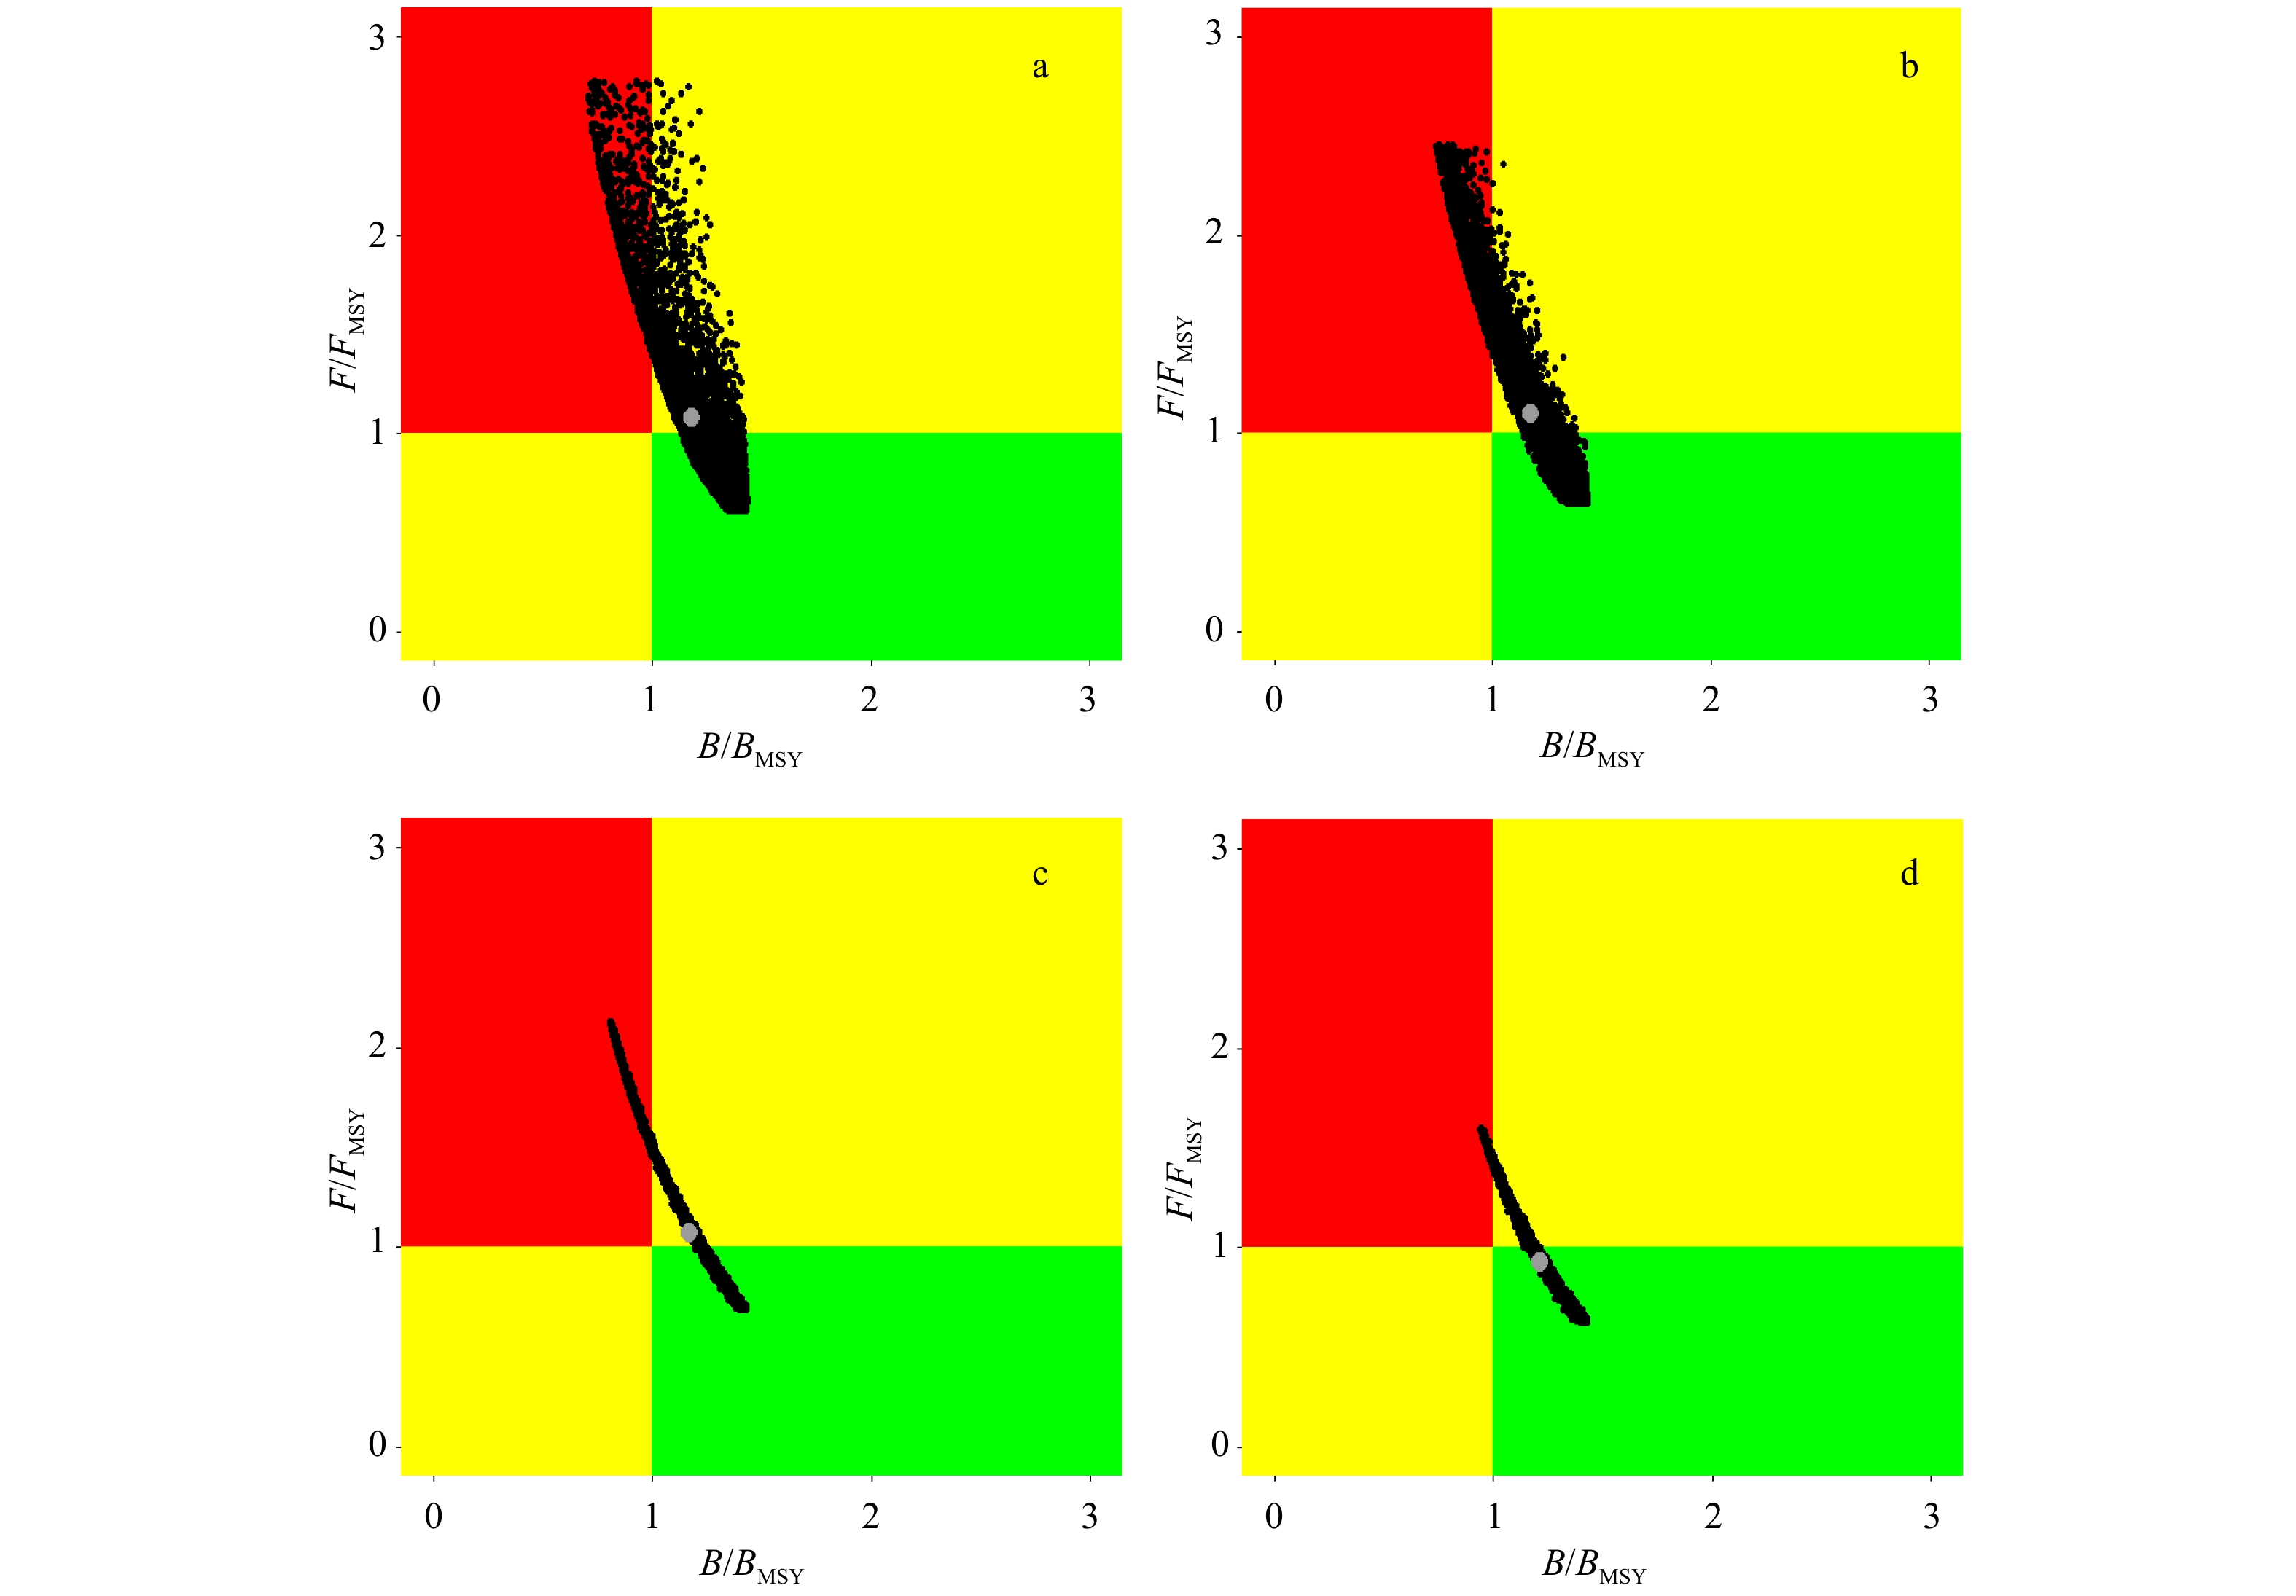
图 5 印度洋蓝枪鱼资源状况(Kobe图)
a. S1A情景;b. S1B情景;c. S2A情景;d. S3A情景;黑色点为蒙特卡洛模拟结果,灰色点为几何平均值
Fig. 5 Kobe plots of stock status of the Indian Ocean blue marlin
a. S1A scenario; b. S1B scenario; c. S2A scenario; d. S3A scenario; black dots based on Monte Carlo simulations; grey dots based on geometric means
表 1 参数r的经验分布
Tab. 1 Empirical distribution for parameter r
恢复力 r分布范围 强 0.600~1.500 适中 0.200~0.800 弱 0.050~0.500 很弱 0.015~0.100  下载: 导出CSV
表 2 评估起止年资源比率
Tab. 2 Default values for initial and final stock status
起止年渔获量/CMAX B/K 起始年 <0.5 0.50~0.90 ≥0.5 0.30~0.60 终止年 >0.5 0.30~0.70 ≤0.5 0.01~0.40
下载: 导出CSV
表 3 印度洋蓝枪鱼Catch-MSY模型情景设置
Tab. 3 Scenarios of the Indian Ocean blue marlin Catch-MSY model
情景 自然死亡系数 r K 渔获量时间序列 S1A – U[0,1] ln(K)~U[ln(2×CMAX),ln(50×CMAX)] 1950–2015年 S1B – U[0,1] lognormal(10×CMAX,0.4) 1950–2015年 S2A LM(M,0.1) 2ωM ln(K)~U[ln(2×CMAX),ln(50×CMAX)] 1950–2015年 S2B LM(M,0.1) 2ωM lognormal(10×CMAX,0.4) 1950–2015年 S3A LM(1.5M,0.1) 2ωM ln(K)~U[ln(2×CMAX),ln(50×CMAX)] 1950–2015年 S3B LM(1.5M,0.1) 2ωM lognormal(10×CMAX,0.4) 1950–2015年 S4A LM(0.5M,0.1) 2ωM ln(K)~U[ln(2×CMAX),ln(50×CMAX)] 1950–2015年 S4B LM(0.5M,0.1) 2ωM lognormal(10×CMAX,0.4) 1950–2015年 S5A LM(2M,0.1) 2ωM ln(K)~U[ln(2×CMAX),ln(50×CMAX)] 1950–2015年 S5B LM(2M,0.1) 2ωM lognormal(10×CMAX,0.4) 1950–2015年 S6_1960 – U[0,1] ln(K)~U[ln(2×CMAX), ln(50×CMAX)] 1960–2015年 S6_1970 – U[0,1] ln(K)~U[ln(2×CMAX), ln(50×CMAX)] 1970–2015年 S6_1980 – U[0,1] ln(K)~U[ln(2×CMAX), ln(50×CMAX)] 1980–2015年 S6_1990 – U[0,1] ln(K)~U[ln(2×CMAX), ln(50×CMAX)] 1990–2015年 S6_2000 – U[0,1] ln(K)~U[ln(2×CMAX), ln(50×CMAX)] 2000–2016年 注:0.5M、1.5M、2M表示自然死亡系数均值(0.22 a–1)乘以0.5、1.5、2倍;U[0,1] 表示服从0到1的均匀分布;LM(M,0.1)表示服从均值为M,标准差为0.1的对数正态分布。
下载: 导出CSV
表 4 印度洋蓝枪鱼管理参考点及部分参数
Tab. 4 Management related parameters and reference points of the Indian Ocean blue marlin
参数和参考点 S1A S1B S2A S2B S3A S3B r/a-1 0.32 0.32 0.38 0.38 0.57 0.56 K/kt 146.00 151.73 130.41 135.49 95.92 102.34 MSY/kt 12.07 12.14 12.48 12.82 13.70 14.31 BMSY/kt 73.00 75.87 65.21 67.75 47.96 51.17 B2015/BMSY 1.16 1.16 1.15 1.20 1.20 1.26 FMSY/a-1 0.18 0.17 0.21 0.21 0.34 0.33 F2015/FMSY 1.11 1.11 1.08 1.01 0.93 0.84
下载: 导出CSV
表 5 Kobe II管理策略矩阵决策表
Tab. 5 Decision table of Kobe II strategy matrix
参考点 60% 70% 80% 90% 100% 110% 120% 130% 140% 9 240 t 10 780 t 12 320 t 13 860 t 15 400 t 16 940 t 18 480 t 20 020 t 21 560 t B2020>BMSY 84.99 81.42 76.79 70.69 62.85 53.46 43.70 33.83 24.08 F2020<FMSY 82.29 72.59 59.75 43.76 26.71 10.84 0.00 0.00 0.00 B2025>BMSY 86.13 79.97 70.99 58.83 43.48 27.22 11.38 3.36 1.89 F2025<FMSY 83.36 72.99 58.20 39.52 19.53 2.95 0.00 0.00 0.00 B2030>BMSY 86.33 78.71 67.13 51.80 33.20 14.45 0.98 0.25 0.05 F2030<FMSY 83.90 72.97 57.05 36.96 16.31 1.58 0.00 0.00 0.00 B2035>BMSY 86.32 77.66 64.48 47.27 26.88 7.81 0.03 0.00 0.00 F2035<FMSY 84.14 72.87 56.14 35.41 14.75 1.21 0.00 0.00 0.00 注:描述Byear>BMSY 和 Fyear<FMSY,绿色代表两个指标均大于50%,黄色代表仅有一个大于50%,红色代表均小于50%。
下载: 导出CSV
-
[1] Squire J L. Migration patterns of Istiophoridae in the Pacific Ocean as determined by cooperative tagging programs[C]//Proceedings of the International Billfish Symposium. Hawaii: NOAA, 1974, 2: 226–237. [2] Block B A, Booth D T, Carey F G. Depth and temperature of the blue marlin, Makaira nigricans, observed by acoustic telemetry[J]. Marine Biology, 1992, 114(2): 175−183. doi: 10.1007/BF00349517 [3] 戴小杰, 许柳雄. 世界金枪鱼渔业渔获物物种原色图鉴[M]. 北京: 海洋出版社, 2007: 176-177.Dai Xiaojie, Xu Liuxiong. Illustrations of Catch Species for Global Tuna Fishery[M]. Beijing: Ocean Press, 2007: 176–177. [4] Shimose T, Fujita M, Yokawa K, et al. Reproductive biology of blue marlin Makaira nigricans around Yonaguni Island, southwestern Japan[J]. Fisheries Science, 2009, 75(1): 109−119. doi: 10.1007/s12562-008-0006-8 [5] Sun C L, Chang Y J, Tszeng C C, et al. Reproductive biology of blue marlin (Makaira nigricans) in the western Pacific Ocean[J]. Fishery Bulletin, 2009, 107(4): 420−432. [6] 耿喆, 朱江峰, 夏萌, 等. 运用数据缺乏方法估算印度洋大青鲨可持续渔获量[J]. 中国水产科学, 2017, 24(5): 1099−1106.Geng Zhe, Zhu Jiangfeng, Xia Meng, et al. Estimate of sustainable yield of blue shark (Prionace glauca) in the Indian Ocean using data-poor approach[J]. Journal of Fishery Sciences of China, 2017, 24(5): 1099−1106. [7] Wang S P, Huang B Q. Stock assessment of blue marlin (Makaira nigricans) in the Indian Ocean using Stock Synthesis: IOTC–2016–WPB14-25_Rev1[R]. Victoria: Indian Ocean Tuna Commission, 2016. [8] ISC. Stock assessment update for Blue Marlin (Makaira nigricans) in the Pacific Ocean through 2014[R]. Sapporo: International Scientific Committee for Tuna and Tuna-Like Species in the North Pacific Ocean, 2016. [9] Restrepo V R, Thompson G G, Mace P M, et al. Technical guidance on the use of precautionary approaches to implementing National Standard 1 of the Magnuson-Stevens Fishery Conservation and Management Act[J]. NOAA Technical Memorandum, 1998, 31: 54. [10] Carruthers T R, Punt A E, Walters C J, et al. Evaluating methods for setting catch limits in data-limited fisheries[J]. Fisheries Research, 2014, 153: 48−68. doi: 10.1016/j.fishres.2013.12.014 [11] Martell S, Froese R. A simple method for estimating MSY from catch and resilience[J]. Fish and Fisheries, 2013, 14(4): 504−514. doi: 10.1111/j.1467-2979.2012.00485.x [12] Kimura D K, Tagart J V. Stock reduction analysis, another solution to the catch equations[J]. Canadian Journal of Fisheries and Aquatic Sciences, 1982, 39(11): 1467−1472. doi: 10.1139/f82-198 [13] Kimura D K, Balsiger J W, Ito D H. Generalized stock reduction analysis[J]. Canadian Journal of Fisheries and Aquatic Sciences, 1984, 41(9): 1325−1333. doi: 10.1139/f84-162 [14] Froese R, Demirel N, Coro G, et al. Estimating fisheries reference points from catch and resilience[J]. Fish and Fisheries, 2017, 18(3): 506−526. doi: 10.1111/faf.12190 [15] Andrade H A. Stock reduction analysis of striped marlin (Tetrapturus audax) caught in the Indian Ocean: IOTC-2017-WPB15-34[R]. San Sebastian: Indian Ocean Tuna Commission, 2017. [16] Andrade H A. Stock reduction analysis of blue shark (Prionace glauca) caught in the Indian Ocean: IOTC-2017-WPEB13-30[R]. San Sebastian: Indian Ocean Tuna Commission, 2017. [17] Newman D, Berkson J, Suatoni L. Current methods for setting catch limits for data-limited fish stocks in the United States[J]. Fisheries Research, 2015, 164: 86−93. doi: 10.1016/j.fishres.2014.10.018 [18] Rosenberg A A, Fogarty M J, Cooper A B, et al. Developing new approaches to global stock status assessment and fishery production potential of the seas[R]. FAO Fisheries and Aquaculture Circular No. 1086, Rome: FAO, 2014: 1–175. [19] Schaefer M B. Some aspects of the dynamics of populations important to the management of the commercial marine fisheries[J]. Inter-American Tropical Tuna Commission Bulletin, 1954, 1(2): 23−56. [20] Froese R, Palomares M L D, Pauly D. Estimation of life history key facts[M]//Froese R, Pauly D. FishBase 2000: Concepts, Design and Data Sources. Philippines: ICLARM, 2000. [21] Froese R, Demirel N, Sampang A. An overall indicator for the good environmental status of marine waters based on commercially exploited species[J]. Marine Policy, 2015, 51: 230−237. doi: 10.1016/j.marpol.2014.07.012 [22] IOTC. Status of the Indian Ocean blue marlin (BUM: Makaira nigricans) resource: IOTC–2016–SC19–ES13[R]. Victoria: Indian Ocean Tuna Commission, 2017. [23] Zhou S, Sharma R. Stock assessment of two neritic tuna species in Indian Ocean, kawakawa and Longtail tuna using catch-based stock reduction methods. IOTC–2013– WPNT03-25[R]. Victoria: Indian Ocean Tuna Commission, 2013. [24] Zhou Shijie, Yin Shaowu, Thorson J T, et al. Linking fishing mortality reference points to life history traits: an empirical study[J]. Canadian Journal of Fisheries and Aquatic Sciences, 2012, 69(8): 1292−1301. doi: 10.1139/f2012-060 [25] McAllister M K, Duplisea D E. Production Model Fitting and Projection for Atlantic Redfish (Sebastes Fasciatus and Sebastes Mentella) to Assess Recovery Potential and Allowable Harm[M]. Quebec: Fisheries and Oceans Canada, 2011. [26] McAllister M K. A generalized Bayesian surplus production stock assessment software (BSP2)[J]. ICCAT's Collective Volume of Scientific Papers, 2014, 70(4): 1725−1757. [27] R Core Team. The R project for statistical computing[EB/OL]. [2015–06–25/2017–03–01].Vienna, Austria: R Foundation for Statistical Computing. http://www.r-project.org/ [28] Kell L T, Mosqueira S I, De Bruyn P, et al. A Kobe Strategy Maatrix based upon probabilistic reference points: an example using a biomass dynamic assessment model[J]. ICCAT's Collective Volume of Scientific Papers, 2012, 68(3): 1030−1043. [29] Guan Wenjiang, Tang Lin, Zhu Jiangfeng, et al. Application of a Bayesian method to data-poor stock assessment by using Indian Ocean albacore (Thunnus alalunga) stock assessment as an example[J]. Acta Oceanologica Sinica, 2016, 35(2): 117−125. doi: 10.1007/s13131-016-0814-0 [30] Kokkalis A, Eikeset A M, Thygesen U H, et al. Estimating uncertainty of data limited stock assessments[J]. ICES Journal of Marine Science, 2017, 74(1): 69−77. doi: 10.1093/icesjms/fsw145 [31] Arnold L M, Heppell S S. Testing the robustness of data-poor assessment methods to uncertainty in catch and biology: a retrospective approach[J]. ICES Journal of Marine Science, 2015, 72(1): 243−250. doi: 10.1093/icesjms/fsu077 [32] MacCall A D. Depletion-corrected average catch: a simple formula for estimating sustainable yields in data-poor situations[J]. ICES Journal of Marine Science, 2009, 66(10): 2267−2271. doi: 10.1093/icesjms/fsp209 [33] Dick E J, MacCall A D. Depletion-based stock reduction analysis: a catch-based method for determining sustainable yields for data-poor fish stocks[J]. Fisheries Research, 2011, 110(2): 331−341. doi: 10.1016/j.fishres.2011.05.007 [34] Cope J M. Implementing a statistical catch-at-age model (Stock Synthesis) as a tool for deriving overfishing limits in data-limited situations[J]. Fisheries Research, 2013, 142: 3−14. doi: 10.1016/j.fishres.2012.03.006 [35] Methot R D, Wetzel C R. Stock synthesis: a biological and statistical framework for fish stock assessment and fishery management[J]. Fisheries Research, 2013, 142: 86−99. doi: 10.1016/j.fishres.2012.10.012 [36] Costello C, Ovando D, Hilborn R, et al. Status and solutions for the world’s unassessed fisheries[J]. Science, 2012, 338(6106): 517−520. doi: 10.1126/science.1223389 [37] Braccini J M, Gillanders B M, Walker T I. Hierarchical approach to the assessment of fishing effects on non-target chondrichthyans: case study of Squalus megalops in southeastern Australia[J]. Canadian Journal of Fisheries and Aquatic Sciences, 2006, 63(11): 2456−2466. doi: 10.1139/f06-141 [38] Tribuzio C A, Kruse G H. Demographic and risk analyses of spiny dogfish (Squalus suckleyi) in the Gulf of Alaska using age- and stage-based population models[J]. Marine and Freshwater Research, 2011, 62(12): 1395−1406. doi: 10.1071/MF11062 [39] Butterworth D S, Punt A E. Experiences in the evaluation and implementation of management procedures[J]. ICES Journal of Marine Science, 1999, 56(6): 985−998. doi: 10.1006/jmsc.1999.0532 [40] Deroba J J, Butterworth D S, Methot R D, et al. Simulation testing the robustness of stock assessment models to error: some results from the ICES strategic initiative on stock assessment methods[J]. ICES Journal of Marine Science, 2015, 72(1): 19−30. doi: 10.1093/icesjms/fst237 -

 点击查看大图
计量
- 文章访问数: 456
- HTML全文浏览量: 59
- PDF下载量: 255
- 被引次数: 0
