

Seasonal variations of dissolved Mn concentration in the surface water of the Changjiang River Estuary and its adjacent area
-
摘要: 锰(Mn)是海洋中的生命必需痕量元素。河口位于河流和海洋的交界区域,其对Mn的改造作用会影响陆源Mn向海输送的生物地球化学过程。本研究使用自动固相萃取−电感耦合等离子体联用技术对2019年9月(秋季)、2021年3月(春季)和2021年7月(夏季)长江口及其邻近水域的表层溶解Mn浓度进行了测定和分析。结果显示,溶解Mn的平均浓度和河口行为表现出了季节性差异:夏季的溶解Mn浓度最高,表现为先移除后添加的分布特征;秋季的溶解Mn浓度次之,表现为添加型分布;春季的溶解Mn浓度最低,表现为保守型分布。显著性分析结果表明,长江携带的溶解Mn仅在淡水端元浓度值较高的季节会显著影响长江口及其邻近水域溶解Mn的分布;当长江淡水端元浓度值较低时,长江口溶解Mn则受多种生物地球化学过程的共同主导。长江口的中低盐度海水中高悬浮颗粒物浓度是造成该区域溶解Mn移除的重要因素,而高盐度海水中溶解Mn的添加机制则有待进一步研究。Abstract: Manganese (Mn) is an essential trace element for the marine ecosystem. As the transitional zone between rivers and oceans, estuaries have a significant effect on dissolved Mn and its terrigenous input. In this study, the distribution of dissolved Mn, investigated in the surface water of Changjiang River Estuary and its adjacent area during September 2019 (autumn), March 2021 (spring) and July 2021 (summer), was analyzed by automatic solid phase extraction and inductively coupled plasma mass spectrometry. The results indicated that the average concentration and estuarine behaviors of dissolved Mn showed seasonal variations between the three cruises: the maximum average concentration occurred in summer and dissolved Mn was removed firstly and then added with the increase of salinity; the medium average concentration occurred in autumn and dissolved Mn was mainly removed with the increase of salinity; the minimum average concentration occurred in spring and dissloved Mn was mainly conservative with the increase of salinity. The results of significance test indicated that only in the season when the fresh water had high concentrations, dissloved Mn carried by the Changjiang River had significant influence on the distribution of dissolved Mn in the Changjiang River Estuary and its adjacent area; the distribution of dissolved Mn was co-dominated by a variety of biogeochemical processes in the season when the concentrations were low in the fresh water. The high suspended particulate matter concentrations were the important factor of the removal of dissolved Mn in the Changjiang Estuary’s water with medium-low salinity. And the addition mechanism of dissolved Mn in water with high salinity needs further vestigation.
-
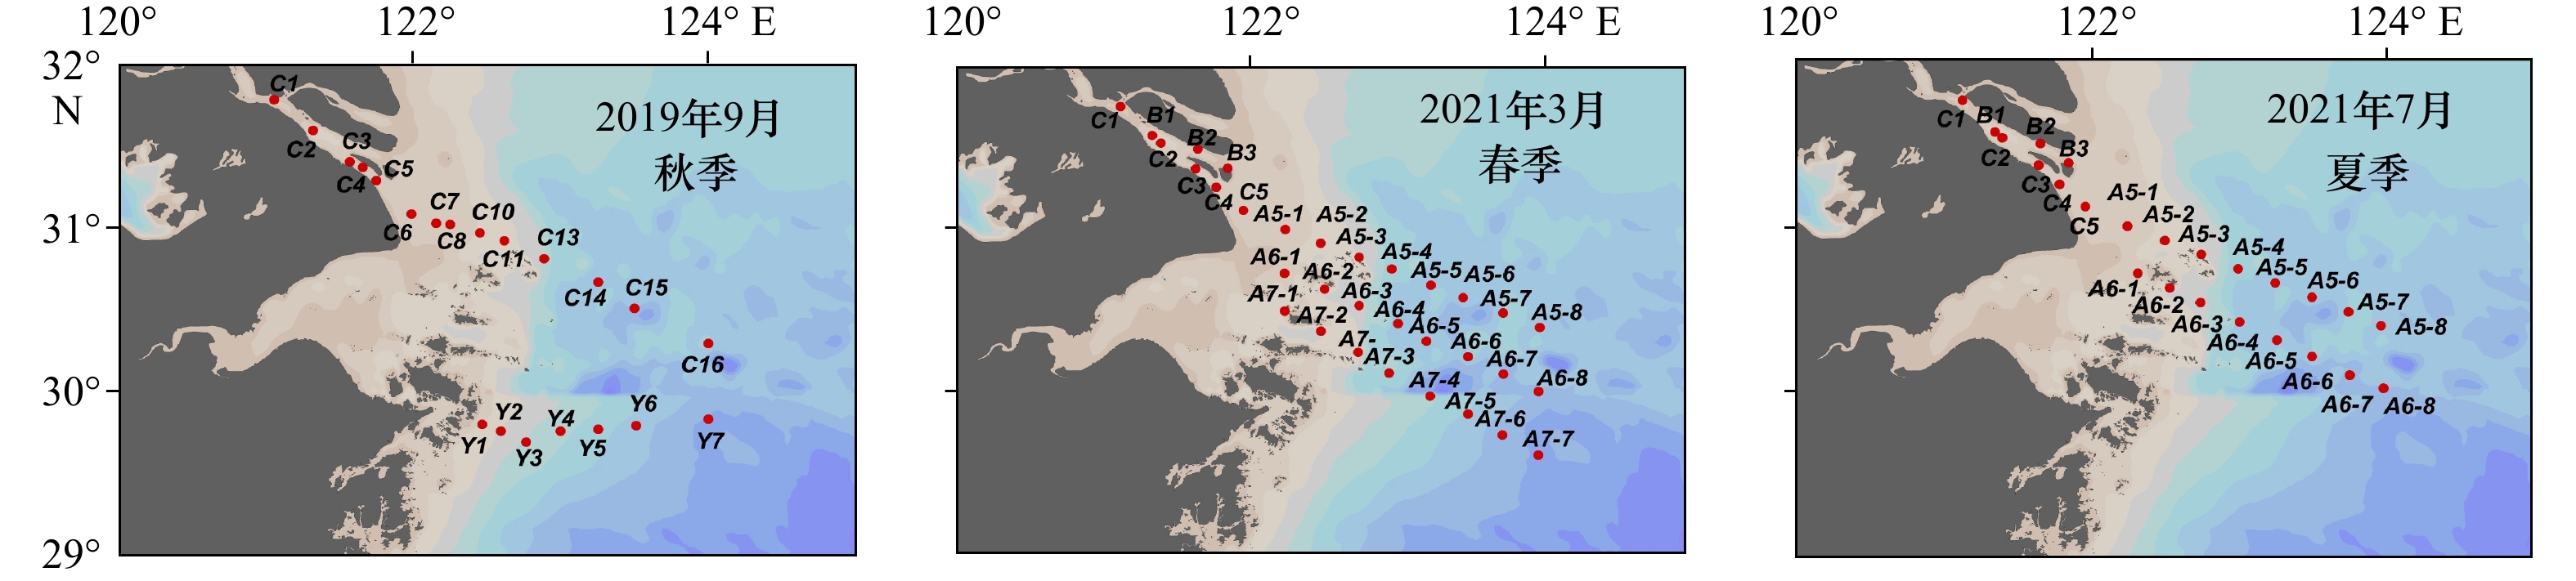
图 1 长江口及其邻近水域采样站位
Fig. 1 The sampling stations in the Changjiang River Estuary and its adjacent area
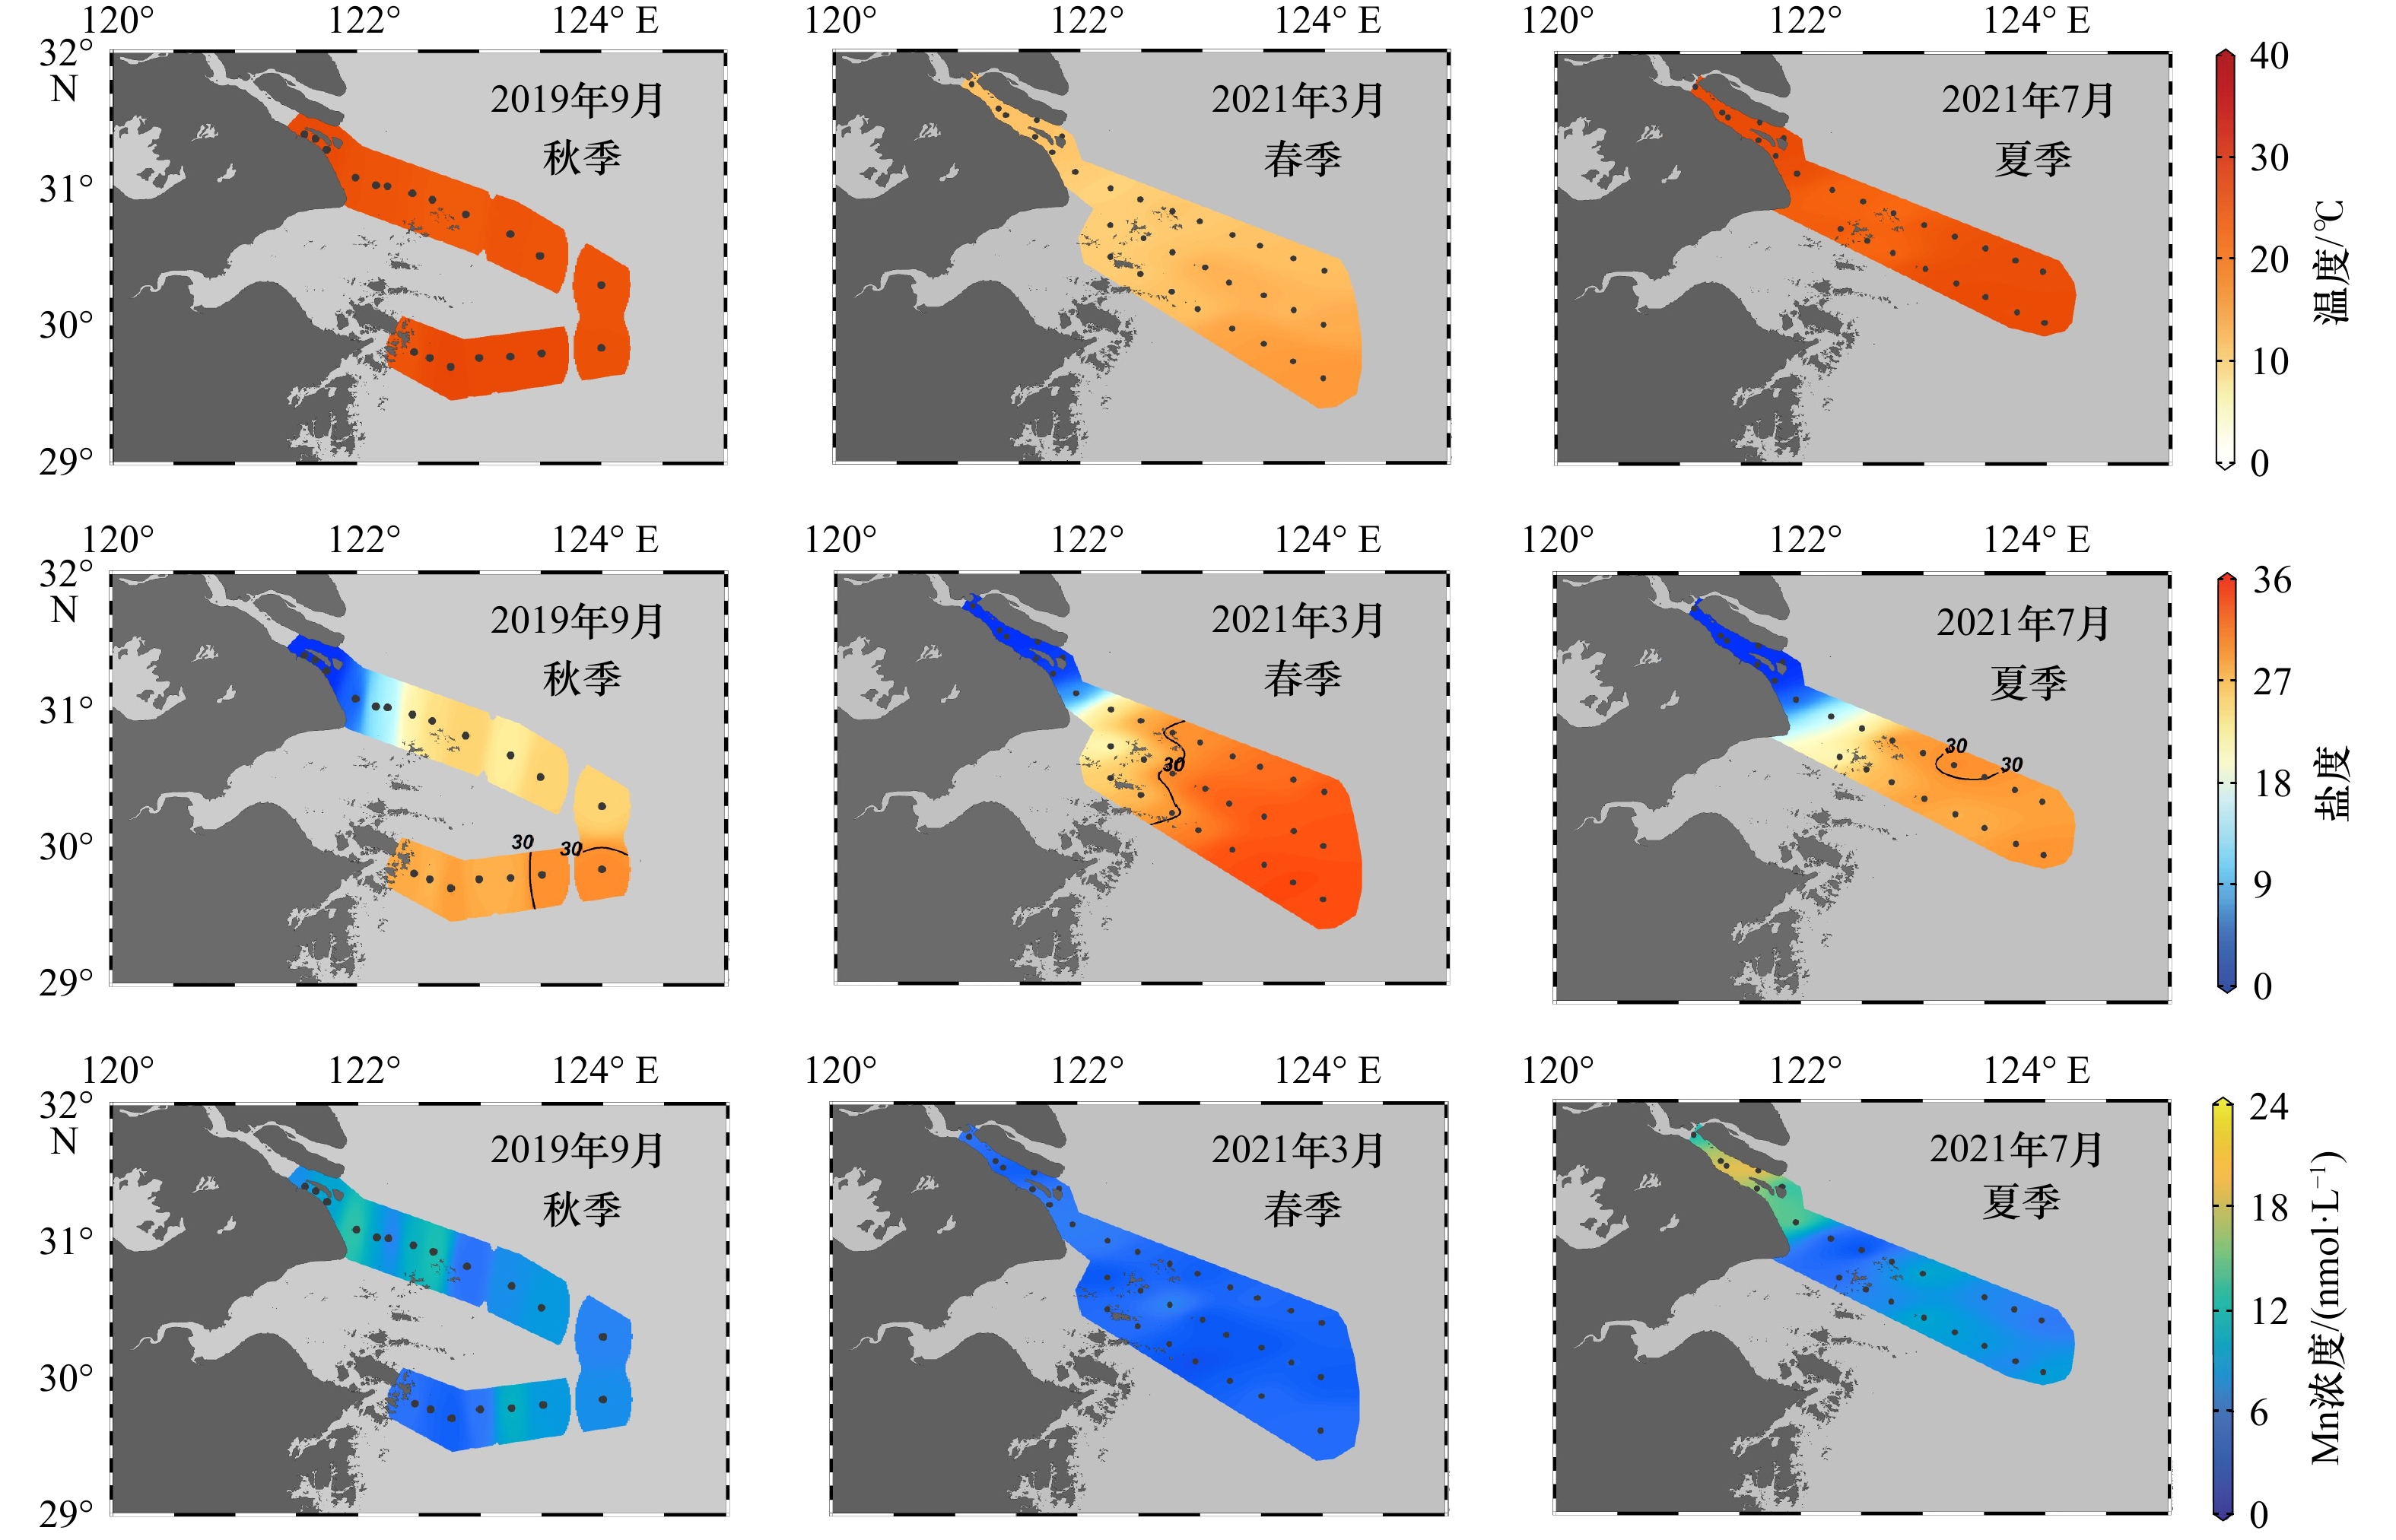
图 2 长江口及其邻近水域表层水体中盐度、温度和溶解Mn浓度的分布
Fig. 2 The distributions of salinity, temperature and dissolved Mn concentration in the surface of the Changjiang River Estuary and its adjacent area

图 3 长江口及其邻近水域表层水体溶解Mn跨越盐度梯度的分布状况
Fig. 3 Distributions of dissolved Mn across salinity gradients in the surface of the Changjiang River Estuary and its adjacent area
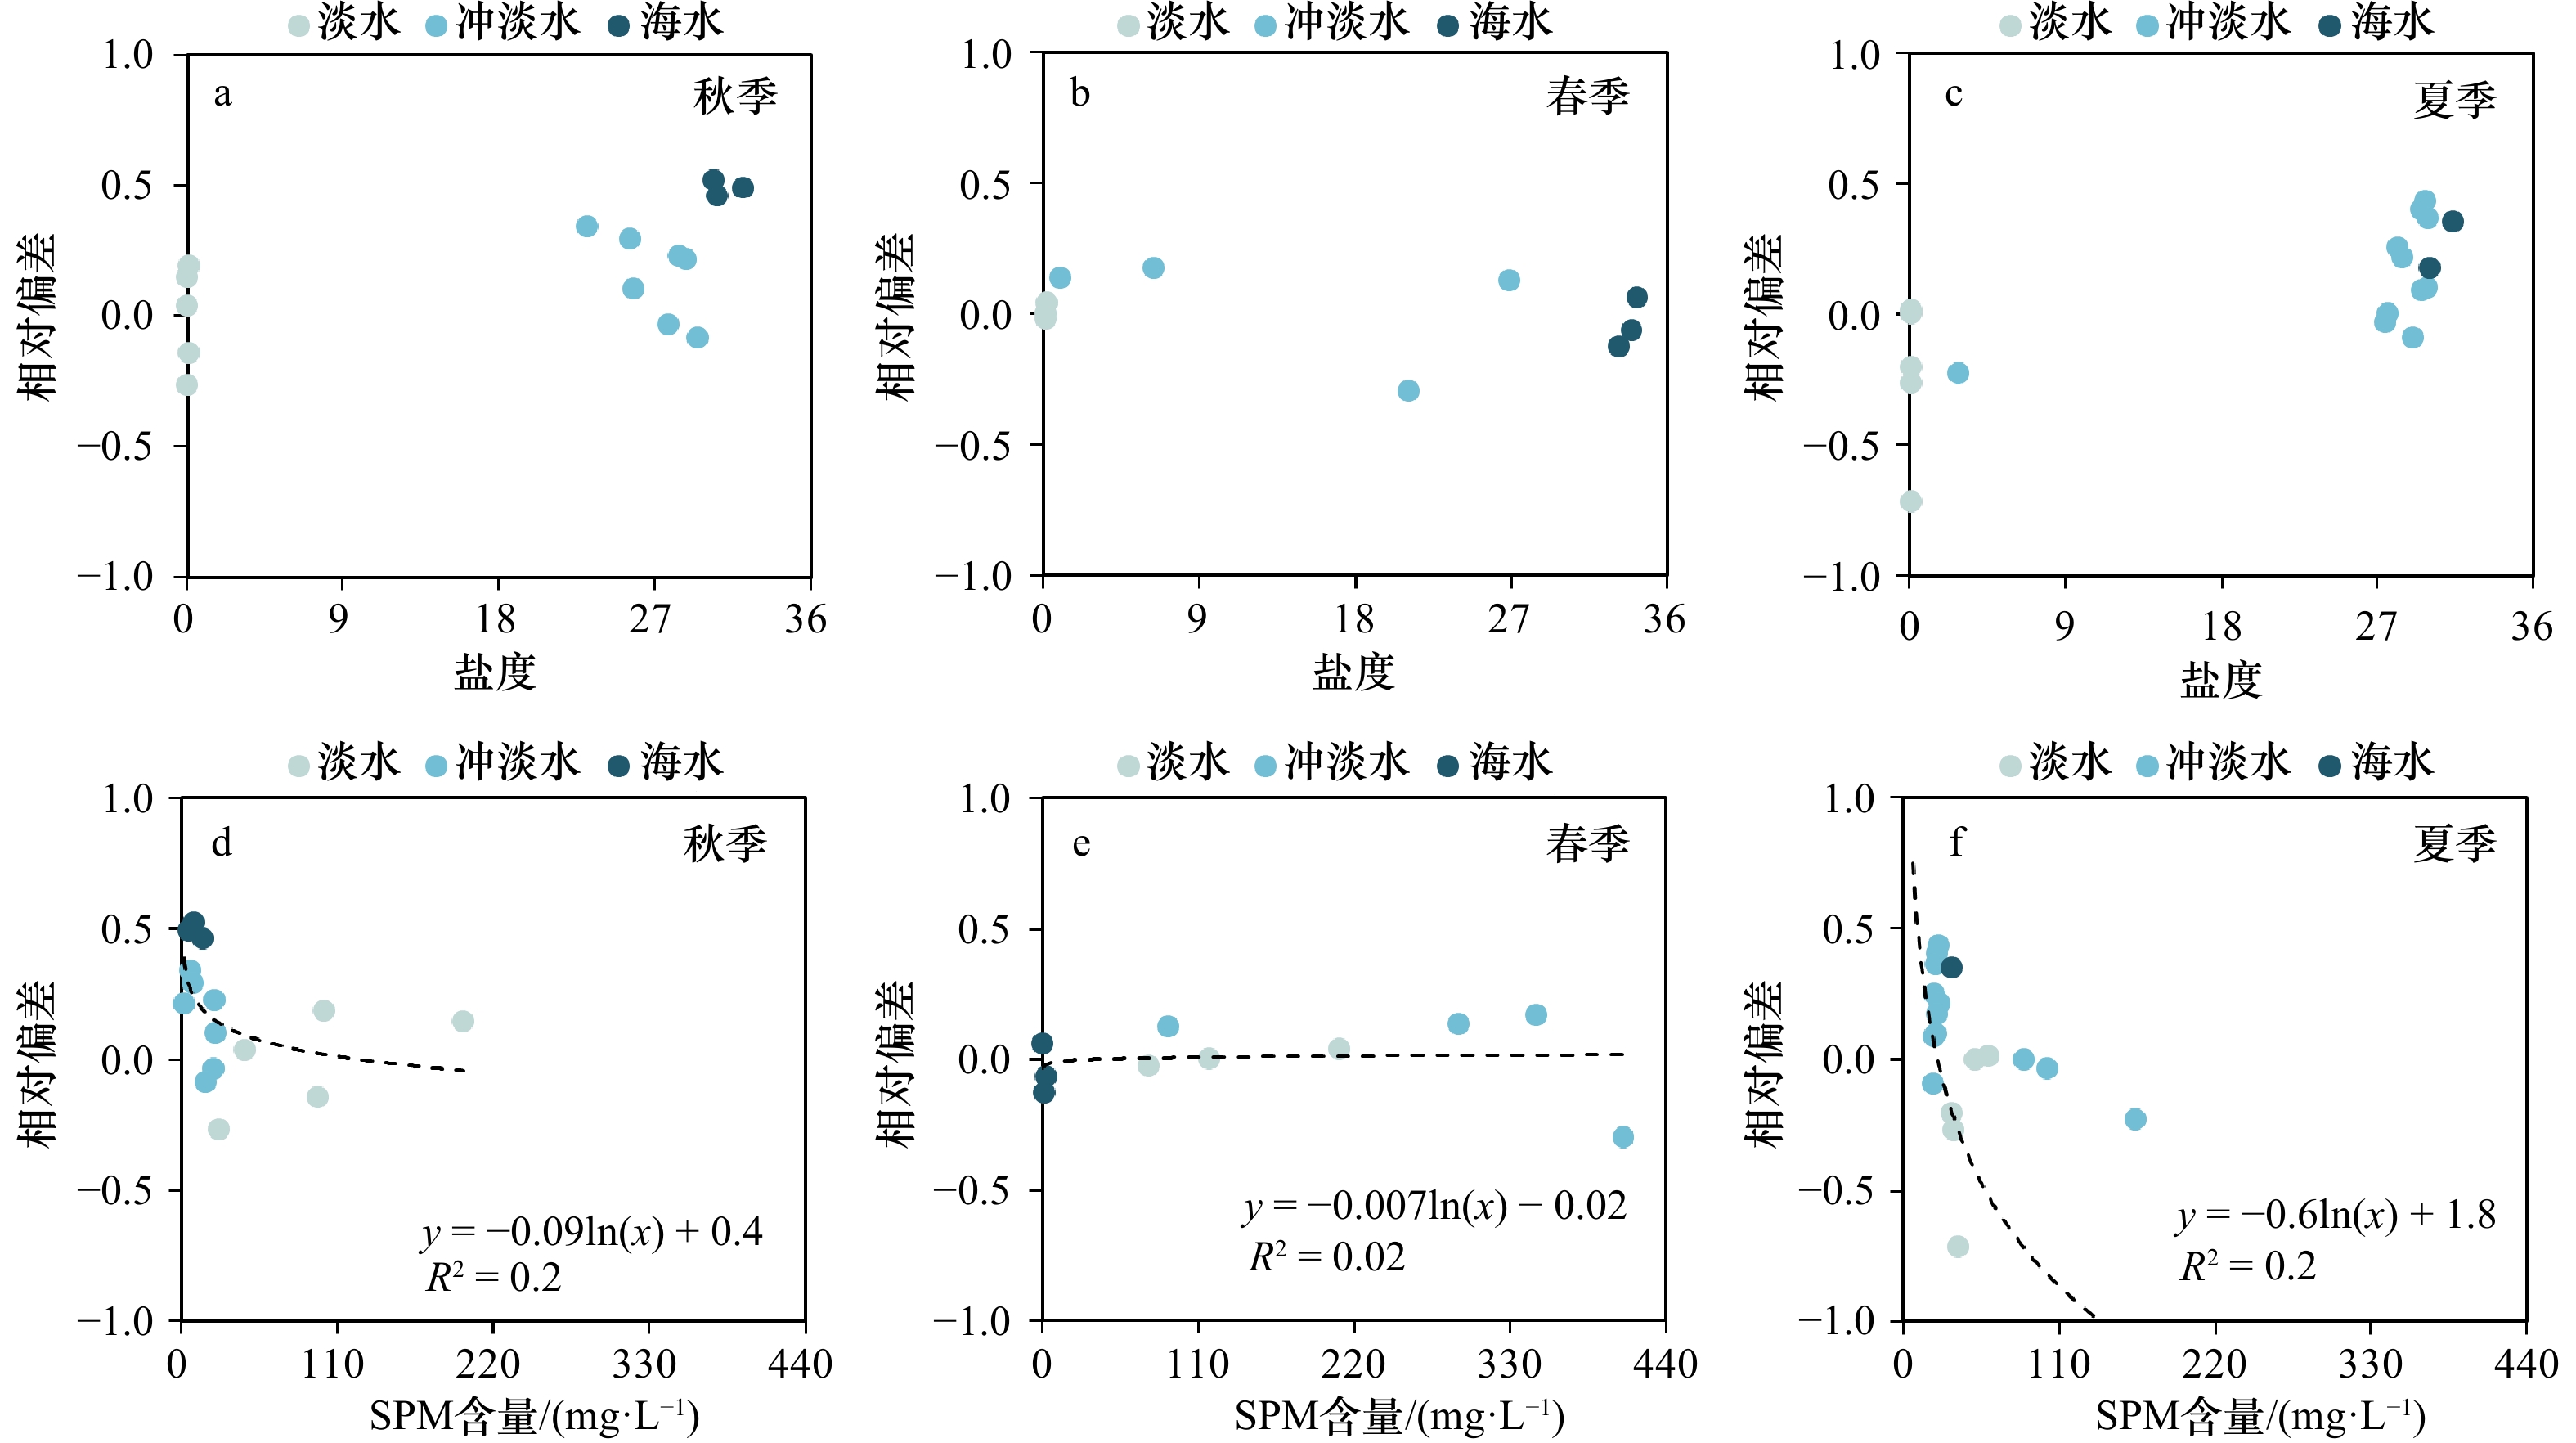
图 4 秋季、春季、夏季溶解Mn浓度的估算相对偏差与盐度(a−c)和SPM含量(d−f)的关系
Fig. 4 Relationships between the estimated relative deviation of dissolved Mn concentrations and salinity (a−c), and SPM content (d−f) in autumn, spring and summer

图 5 3个季节整体SPM含量与盐度(a)、Mn浓度与SPM含量(b)以及Mn浓度的估算相对偏差与SPM含量(c)的关系
Fig. 5 The relationships between SPM content and salinity (a), Mn concentration and SPM content (b), and the estimated relative deviation of dissolved Mn concentrations and SPM content (c) in three seasons
表 1 长江口及其邻近水域表层水体的盐度、温度和溶解Mn浓度
Tab. 1 Salinity, temperature and dissolved Mn concentration in the surface of the Changjiang River Estuary and its adjacent area
季节 水域 盐度 温度/℃ 溶解Mn浓度/(nmol·L−1) 样本数 范围 均值 样本数 范围 均值 样本数 范围 均值 秋季 全水域 24 0.0~32.1 18.9 ± 11.6 21 26.4~29.5 28.0 ± 1.0 21 3.8~12.9 7.8 ± 2.5 淡水 5 0.0~0.1 0.04 ± 0.05 5 28.7~28.9 28.8 ± 0.1 5 6.2~9.7 8.0 ± 1.3 冲淡水 16 2.8~29.5 22.6 ± 7.0 14 26.4~29.5 27.7 ± 1.0 14 3.8~12.9 7.7 ± 2.9 海水 3 30.4~30.6 31.0 ± 0.8 2 27.6~29.0 28.3 ± 0.7 2 7.3~8.3 7.8 ± 0.5 春季 全水域 32 0.2~34.8 23.6 ± 13.4 32 10.1~17.0 12.8 ± 1.7 31 2.7~15.7 4.4 ± 1.0 淡水 5 0.2~0.3 0.2 ± 0.02 5 12.1~12.7 12.4 ± 0.2 5 3.1~5.5 4.5 ± 1.0 冲淡水 10 1.0~29.6 19.2 ± 11.0 10 10.1~12.3 12.3 ± 0.6 10 3.2~6.1 4.9 ± 1.0 海水 17 30.4~34.8 33.1 ± 1.4 17 11.4~17.0 13.8 ± 1.8 16 2.7~7.0 4.1 ± 0.9 夏季 全水域 24 0.1~31.4 18.5 ± 13.2 24 22.9~28.8 27.3 ± 1.8 22 2.0~20.5 9.7 ± 5.0 淡水 7 0.1~0.2 0.1 ± 0.01 7 28.4~28.6 28.5 ± 0.07 6 10.9~20.5 16.0 ± 3.7 冲淡水 14 2.8~30.0 25.0 ± 7.4 14 23.9~28.8 27.0 ± 1.7 14 2.0~15.4 7.4 ± 3.2 海水 3 30.1~31.4 30.8 ± 0.6 3 22.9~28.0 26.2 ± 2.3 2 6.9~7.7 7.3 ± 0.4  下载: 导出CSV
表 2 长江口至东海区域中表层盐度和溶解Mn浓度的历史数据对比
Tab. 2 The comparison of historical salinity and dissolved Mn concentrations in the surface from the Changjiang River Estuary to the East China Sea
研究区域 时间 纬度 经度 盐度(平均值) 溶解Mn浓度(平均值)/(nmol·L−1) 参考文献 长江口表层水 2021年3月 29°~32°N 120°~125°E 0.2~34.8
(23.6)2.7~15.7
(4.4)本研究 2021年7月 29°~32°N 120°~125°E 0.1~31.4
(18.5)2.0~20.5
(9.7)2019年9月 29°~32°N 120°~125°E 0.0~32.1
(18.9)3.8~12.9
(7.8)长江口表层水 2012年3月 29°~33°N 120°~124°E 0.2~33.9
(25.1)2.5~55.1
(11.5)文献[25] 2012年7月 29°~33°N 120°~124°E 0.1~32.3
(23.2)4.2~74.1
(16.5)长江口、东海表层水 2011年5月 23°~34°N 120°~128°E 24.4~34.6
(32.2)2.6~21.8
(7.7)文献[23] 2011年8月 27°~34°N 120°~128°E 21.5~33.8
(29.6)4.2~15.5
(9.6)2011年11月 29°~32°N 120°~128°E 24.3~33.8
(31.1)2.5~13.9
(6.5)东海表层水 2015年10月 26°~32°N 120°~128°E 20.4~34.9
(32.4)2.2~10.7
(6.1)文献[30]
下载: 导出CSV
表 3 世界部分河流、河口、边缘海及大洋的表层溶解Mn浓度
Tab. 3 Surface dissolved Mn concentrations of rivers, estuaries, marginal seas and oceans in the world
类别 采样区域 溶解Mn浓度/(nmol·L−1) 参考文献 河流 长江 3.1~20.5 本研究 长江 7.2~82.9 文献[15] 哥伦比亚河 60.0~240.0 文献[7] 哈得孙河 33.0~1 460.0 文献[26] 珠江 1.5~512.3 文献[32] 河口 长江口咸水 2.0~15.4 本研究 哥伦比亚河口 12. 0~40.0 文献[33] 哈得孙河河口 33.0~1 640.0 文献[26] 杰克逊港口 24.5~1 172.7 文献[34] 长江口海水 2.7~8.3 本研究 边缘海 东海 1.5~21.8 文献[30] 南海 1.8~16.2 文献[35] 威德尔海 0.2~0.4 文献[36] 马尾藻海 0.7~4.3 文献[37] 大洋 西北太平洋 1.2~2.6 文献[38] 南大洋 0.04~0.6 文献[39]
下载: 导出CSV
表 4 各季节溶解 Mn 浓度与其他环境因子的皮尔逊相关性
Tab. 4 Pearson correlation between dissolved Mn concentration and other environmental factors in different seasons
季节 盐度 温度 溶解无机氮浓度 磷酸盐浓度 硅酸盐浓度 叶绿素浓度 溶解氧浓度 悬浮颗粒物含量 春季 −0.33 −0.25 0.33 0.16 0.29 0.20 −0.12 0.38 夏季 −0.36* −0.25 0.35 0.27 0.30 0.53** −0.15 0.18 秋季 −0.74** 0.51* 0.60* 0.028 0.35 0.039 −0.57** −0.26 注:**指相关性在0.01级别上显著(双尾检验);*指相关性在0.05级别上显著(双尾检验)。
下载: 导出CSV
-
[1] Sun Yao, Gao Ruohan, Li Zhiwei, et al. Composition and evolution of continental crust at orogenic belts: constraints from a 3-D crustal model of Southeast China[J]. Journal of Geophysical Research: Solid Earth, 2022, 127(12): e2022JB025057. doi: 10.1029/2022JB025057 [2] Landing W M, Bruland K W. Manganese in the North Pacific[J]. Earth and Planetary Science Letters, 1980, 49(1): 45−56. doi: 10.1016/0012-821X(80)90149-1 [3] Kitayama K, Kitayama M, Osafune T, et al. Subcellular localization of iron and manganese superoxide dismutase in Chlamydomonas reinhardtii (Chlorophyceae)[J]. Journal of Phycology, 1999, 35(1): 136−142. doi: 10.1046/j.1529-8817.1999.3510136.x [4] 任景玲, 张桂玲, 刘素美, 等. 海洋中锰的生物地球化学循环研究[J]. 海洋科学进展, 2012, 30(3): 432−440. doi: 10.3969/j.issn.1671-6647.2012.03.014Ren Jingling, Zhang Guiling, Liu Sumei, et al. Review on the study of biogeochemical cycle of manganese in the oceans[J]. Advances in Marine Science, 2012, 30(3): 432−440. doi: 10.3969/j.issn.1671-6647.2012.03.014 [5] Dau H, Haumann M. Eight steps preceding O-O bond formation in oxygenic photosynthesis—A basic reaction cycle of the photosystem II manganese complex[J]. Biochimica et Biophysica Acta (BBA)-Bioenergetics, 2007, 1767(6): 472−483. doi: 10.1016/j.bbabio.2007.02.022 [6] Shiller A M. Manganese in surface waters of the Atlantic Ocean[J]. Geophysical Research Letters, 1997, 24(12): 1495−1498. doi: 10.1029/97GL01456 [7] Aguilar-Islas A M, Bruland K W. Dissolved manganese and silicic acid in the Columbia River plume: a major source to the California current and coastal waters off Washington and Oregon[J]. Marine Chemistry, 2006, 101(3/4): 233−247. [8] Baker A R, Jickells T D, Witt M, et al. Trends in the solubility of iron, aluminium, manganese and phosphorus in aerosol collected over the Atlantic Ocean[J]. Marine Chemistry, 2006, 98(1): 43−58. doi: 10.1016/j.marchem.2005.06.004 [9] Burdige D J. The biogeochemistry of manganese and iron reduction in marine sediments[J]. Earth-Science Reviews, 1993, 35(3): 249−284. doi: 10.1016/0012-8252(93)90040-E [10] Boyle E A, Bergquist B A, Kayser R A, et al. Iron, manganese, and lead at Hawaii Ocean Time-series station ALOHA: temporal variability and an intermediate water hydrothermal plume[J]. Geochimica et Cosmochimica Acta, 2005, 69(21): 5165−5166. doi: 10.1016/j.gca.2005.03.006 [11] Delgadillo-Hinojosa F, Segovia-Zavala J A, Huerta-Díaz M A, et al. Influence of geochemical and physical processes on the vertical distribution of manganese in Gulf of California waters[J]. Deep-Sea Research Part I: Oceanographic Research Papers, 2006, 53(8): 1301−1319. doi: 10.1016/j.dsr.2006.06.002 [12] SCOR Working Group. GEOTRACES—An international study of the global marine biogeochemical cycles of trace elements and their isotopes[J]. Geochemistry, 2007, 67(2): 85−131. doi: 10.1016/j.chemer.2007.02.001 [13] van Hulten M, Middag R, Dutay J C, et al. Manganese in the west Atlantic Ocean in the context of the first global ocean circulation model of manganese[J]. Biogeosciences, 2017, 14(5): 1123−1152. doi: 10.5194/bg-14-1123-2017 [14] Zhang Zhouling, Cao Zhimian, Grasse P, et al. Dissolved silicon isotope dynamics in large river estuaries[J]. Geochimica et Cosmochimica Acta, 2020, 273: 367−382. [15] Moore R M, Burton J D, Williams P J L, et al. The behaviour of dissolved organic material, iron and manganese in estuarine mixing[J]. Geochimica et Cosmochimica Acta, 1979, 43(6): 919−926. doi: 10.1016/0016-7037(79)90229-1 [16] Church T M. Biogeochemical factors influencing the residence time of microconstituents in a large tidal estuary, Delaware Bay[J]. Marine Chemistry, 1986, 18(2/4): 393−406. [17] Wilke R J, Dayal R. The behavior of iron, manganese and silicon in the Peconic River Estuary, New York[J]. Estuarine, Coastal and Shelf Science, 1982, 15(5): 577−586. doi: 10.1016/0272-7714(82)90009-9 [18] Li Yuanhui, Burkhardt L, Teraoka H. Desorption and coagulation of trace elements during estuarine mixing[J]. Geochimica et Cosmochimica Acta, 1984, 48(10): 1879−1884. doi: 10.1016/0016-7037(84)90371-5 [19] Yang Shilun, Xu Kehui, Milliman J D, et al. Decline of Yangtze River water and sediment discharge: impact from natural and anthropogenic changes[J]. Scientific Reports, 2015, 5: 12581. doi: 10.1038/srep12581 [20] Sun Xueshi, Fan Dejiang, Liu Ming, et al. Persistent impact of human activities on trace metals in the Yangtze River Estuary and the East China Sea: evidence from sedimentary records of the last 60 years[J]. Science of the Total Environment, 2019, 654: 878−889. doi: 10.1016/j.scitotenv.2018.10.439 [21] 李伟, 王玉衡, 汪嘉宁, 等. 2011年春、夏季黄、东海水团与水文结构分布特征[J]. 海洋与湖沼, 2012, 43(3): 615−623. doi: 10.11693/hyhz201203032032Li Wei, Wang Yuheng, Wang Jianing, et al. Distributions of water masses and hydrographic structures in the Yellow Sea and East China Sea in spring and summer 2011[J]. Oceanologia et Limnologia Sinica, 2012, 43(3): 615−623. doi: 10.11693/hyhz201203032032 [22] Li Wei, Wang Yuheng, Wang Jianing, et al. Distributions of water masses and hydrographic structures in the Yellow Sea and East China Sea in spring and summer 2011[J]. Oceanologia et Limnologia Sinica, 2012, 43(3): 615−623. [23] Wang Zhaowei, Ren Jingling, Jiang Shuo, et al. Geochemical behavior of dissolved manganese in the East China Sea: seasonal variation, estuarine removal, and regeneration under suboxic conditions[J]. Geochemistry, Geophysics, Geosystems, 2016, 17(2): 282−299. doi: 10.1002/2015GC006128 [24] Zhang Jing, Liu Sumei, Ren Jingling, et al. Nutrient gradients from the eutrophic Changjiang (Yangtze River) Estuary to the oligotrophic Kuroshio waters and re-evaluation of budgets for the East China Sea Shelf[J]. Progress in Oceanography, 2007, 74(4): 449−478. doi: 10.1016/j.pocean.2007.04.019 [25] 杨亭亭, 任景玲, 王召伟, 等. 长江口及邻近海域溶解态锰的分布及影响因素[J]. 海洋科学进展, 2016, 34(2): 260−270. doi: 10.3969/j.issn.1671-6647.2016.02.011Yang Tingting, Ren Jingling, Wang Zhaowei, et al. Distributions and influence factors of dissolved manganese in the Changjiang Estuary and its adjacent area[J]. Advances in Marine Science, 2016, 34(2): 260−270. doi: 10.3969/j.issn.1671-6647.2016.02.011 [26] Yang Min, Sañudo-Wilhelmy S A. Cadmium and manganese distributions in the Hudson River Estuary: interannual and seasonal variability[J]. Earth and Planetary Science Letters, 1998, 160(3/4): 403−418. [27] Ge Yuncong, Zhang Ruifeng, Jiang Ziyuan, et al. Determination of Fe, Ni, Cu, Zn, Cd and Pb in seawater by isotope dilution automatic solid-phase extraction-ICP-MS[J]. Acta Oceanologica Sinica, 2022, 41(8): 129−136. doi: 10.1007/s13131-022-2016-2 [28] 李健华. 近海与河口区域沉积层与上覆水体间水动力的数学模型及特性研究[D]. 广州: 华南理工大学, 2018.Li Jianhua. Study on hydrodynamic mathematical model and its characteristics between sediment and overlying water in the offshore and estuarine areas[D]. Guangzhou: South China University of Technology, 2018. [29] 苏育嵩, 李凤岐, 王凤钦. 渤、黄、东海水型分布与水系划分[J]. 海洋学报, 1996, 18(6): 1−7.Su Yusong, Li Fengqi, Wang Fengqin. Water pattern distribution and water system division in Bohai Sea, Yellow Sea and East China Sea[J]. Haiyang Xuebao, 1996, 18(6): 1−7. [30] Zhang Yuan, Li Lei, Ren Jingling, et al. Distribution and influencing factors of dissolved manganese in the Yellow Sea and the East China Sea[J]. Marine Chemistry, 2021, 234: 104002. doi: 10.1016/j.marchem.2021.104002 [31] Peers G, Price N M. A role for manganese in superoxide dismutases and growth of iron-deficient diatoms[J]. Limnology and Oceanography, 2004, 49(5): 1774−1783. doi: 10.4319/lo.2004.49.5.1774 [32] Zhang Jing. Biogeochemistry of Chinese estuarine and coastal waters: nutrients, trace metals and biomarkers[J]. Regional Environmental Change, 2002, 3(1/3): 65−76. [33] Klinkhammer G P, Chin C S, Wilson C, et al. Distributions of dissolved manganese and fluorescent dissolved organic matter in the Columbia River Estuary and plume as determined by in situ measurement[J]. Marine Chemistry, 1997, 56(1/2): 1−14. [34] Hatje V, Apte S C, Hales L T, et al. Dissolved trace metal distributions in Port Jackson Estuary (Sydney Harbour), Australia[J]. Marine Pollution Bulletin, 2003, 46(6): 719−730. doi: 10.1016/S0025-326X(03)00061-4 [35] Wang Zhaowei, Ren Jingling, Zhang Ruifeng, et al. Physical and biological controls of dissolved manganese on the northern slope of the South China Sea[J]. Deep-Sea Research Part II: Topical Studies in Oceanography, 2019, 167: 25−33. doi: 10.1016/j.dsr2.2018.07.006 [36] Dellwig O, Bosselmann K, Kölsch S, et al. Sources and fate of manganese in a tidal basin of the German Wadden Sea[J]. Journal of Sea Research, 2007, 57(1): 1−18. doi: 10.1016/j.seares.2006.07.006 [37] Sunda W G, Huntsman S A. Effect of sunlight on redox cycles of manganese in the southwestern Sargasso Sea[J]. Deep-Sea Research Part A. Oceanographic Research Papers, 1988, 35(8): 1297−1317. doi: 10.1016/0198-0149(88)90084-2 [38] Yakushev E, Pakhomova S, Sørenson K, et al. Importance of the different manganese species in the formation of water column redox zones: observations and modeling[J]. Marine Chemistry, 2009, 117(1/4): 59−70. [39] Middag R, de Baar H J W, Laan P, et al. Dissolved manganese in the Atlantic sector of the Southern Ocean[J]. Deep-Sea Research Part II: Topical Studies in Oceanography, 2011, 58(25/26): 2661−2677. [40] Yemenicioglu S, Erdogan S, Tugrul S. Distribution of dissolved forms of iron and manganese in the Black Sea[J]. Deep-Sea Research Part II: Topical Studies in Oceanography, 2006, 53(17/19): 1842−1855. [41] Minakawa M, Noriki S, Tsunogai S. Manganese in the East China Sea and the Yellow Sea[J]. Geochemical Journal, 1996, 30(1): 41−55. doi: 10.2343/geochemj.30.41 [42] Thamdrup B, Glud R N, Hansen J W. Manganese oxidation and in situ manganese fluxes from a coastal sediment[J]. Geochimica et Cosmochimica Acta, 1994, 58(11): 2563−2570. doi: 10.1016/0016-7037(94)90032-9 [43] 王保栋. 长江口及邻近海域富营养化状况及其生态效应[D]. 青岛: 中国海洋大学, 2006.Wang Baodong. Eutrophication status and its ecological effects in the Changjiang Estuary and adjacent coastal waters[D]. Qingdao: Ocean University of China, 2006. [44] 窦衍光. 长江口邻近海域沉积物粒度和元素地球化学特征及其对沉积环境的指示[D]. 青岛: 国家海洋局第一海洋研究所, 2007.Dou Yanguang. Characteristics of sediment granularity, element geochemistry and their significance for identifying sedimentary environment in the contiguous sea areas of Changjiang River Estuary[D]. Qingdao: The First Institute of Oceanography, State Oceanic Administration, 2007. [45] Zhou J L, Liu Y P, Abrahams P W. Trace metal behaviour in the Conwy Estuary, North Wales[J]. Chemosphere, 2003, 51(5): 429−440. doi: 10.1016/S0045-6535(02)00853-6 -

计量
- 文章访问数: 540
- HTML全文浏览量: 213
- PDF下载量: 98
- 被引次数: 0
