

Detection method of red tide based on the spectral features from HY-1C/D satellite: Take red Noctiluca scintillans blooms as an example
-
摘要: 红夜光藻是我国主要的赤潮优势种,在渤海、黄海、东海和南海均有发生。近年来,红夜光藻赤潮发生频率明显上升,监测需求迫切。但红夜光藻赤潮发生具有分布范围广、变化速度快、多呈条带状分布的特点,其探测对卫星影像空间分辨率、覆盖范围和重访周期要求高。虽然水色卫星在赤潮监测中发挥了重要作用,但其空间分辨率低,无法准确探测条带状分布的红夜光藻赤潮。海洋一号C、D(HY-1C/D)卫星搭载的海岸带成像仪(Coastal Zone Imager,CZI)以其高空间分辨率、大幅宽和短重访周期的优势,被越来越多地用于赤潮监测。现有的红夜光藻赤潮HY-1C/D CZI探测模型大多基于深度学习方法,需要大量赤潮样本,但赤潮样本获取困难,影响模型的精度。因此,本文以2022年3月发生在广东省汕尾市红海湾的红夜光藻赤潮为例,分析了红夜光藻赤潮光谱特征,基于红夜光藻赤潮在红光和近红外波段的高反射特性和浑浊水体在绿光波段的高反射特性,构建了一个面向HY-1C/D CZI的红夜光藻赤潮探测方法。实验结果表明,该方法可以有效地探测赤潮,并避免浑浊水体的干扰,精确率和F1-Score达到89.72%和0.90。而且,该方法具有较好的适用性,可适用于不同海洋环境、不同宽波段卫星传感器的红夜光藻赤潮探测。
-
关键词:
- 赤潮 /
- 红夜光藻 /
- 遥感探测 /
- HY-1C/D CZI /
- 光谱特征
Abstract: Red Noctiluca scintillans is the main red tide species in China, which often occurs in the Bohai Sea, Yellow Sea, East China Sea and South China Sea. Recently, the red N. scintillans blooms occurred frequently, leading to an urgent need for their monitoring. However, the occurrence of red N. scintillans blooms is characterized by wide distribution range, rapid change and strip distribution. Therefore, the high spatial resolution, large coverage and short revisit period satellites are needed for red N. scintillans blooms monitoring. Although, ocean color satellites have played an important role in red tide detection, they cannot detect the strip distributed red N. scintillans blooms for their low spatial resolution. The Coastal Zone Imager (CZI) onboard HY-1C/D satellite, with high spatial resolution, wide swath and short revisit cycle, has been increasingly used for red tide monitoring. Most existing red N. scintillans blooms detection methods for HY-1C/D CZI are based on deep learning methods, which need a large number of training samples. However, the training samples are difficult to obtain, which affects the accuracy of the models. Therefore, taking red N. scintillans bloom occurred in the Honghai Bay, Guangdong Province in March 2022 as an example, the spectral features of red N. scintillans blooms were analyzed in this paper, the red tide detection method based on the high reflectance features of red N. scintillans blooms in the red and near infrared bands and turbid water in the green band was constructed for HY-1C/D CZI. The experimental results show that based on the method, red N. scintillans blooms can be detected effectively in the turbid water, with precision and F1-Score of 89.72% and 0.90 respectively. Moreover, the method has good applicability, and it is proved to be suitable for the detection of red N. scintillans blooms in different marine environments. Also, it is applicable to different broad band sensors.-
Key words:
- red tide /
- red Noctiluca scintillans /
- remote sensing detection /
- HY-1C/D CZI /
- spectral features
-
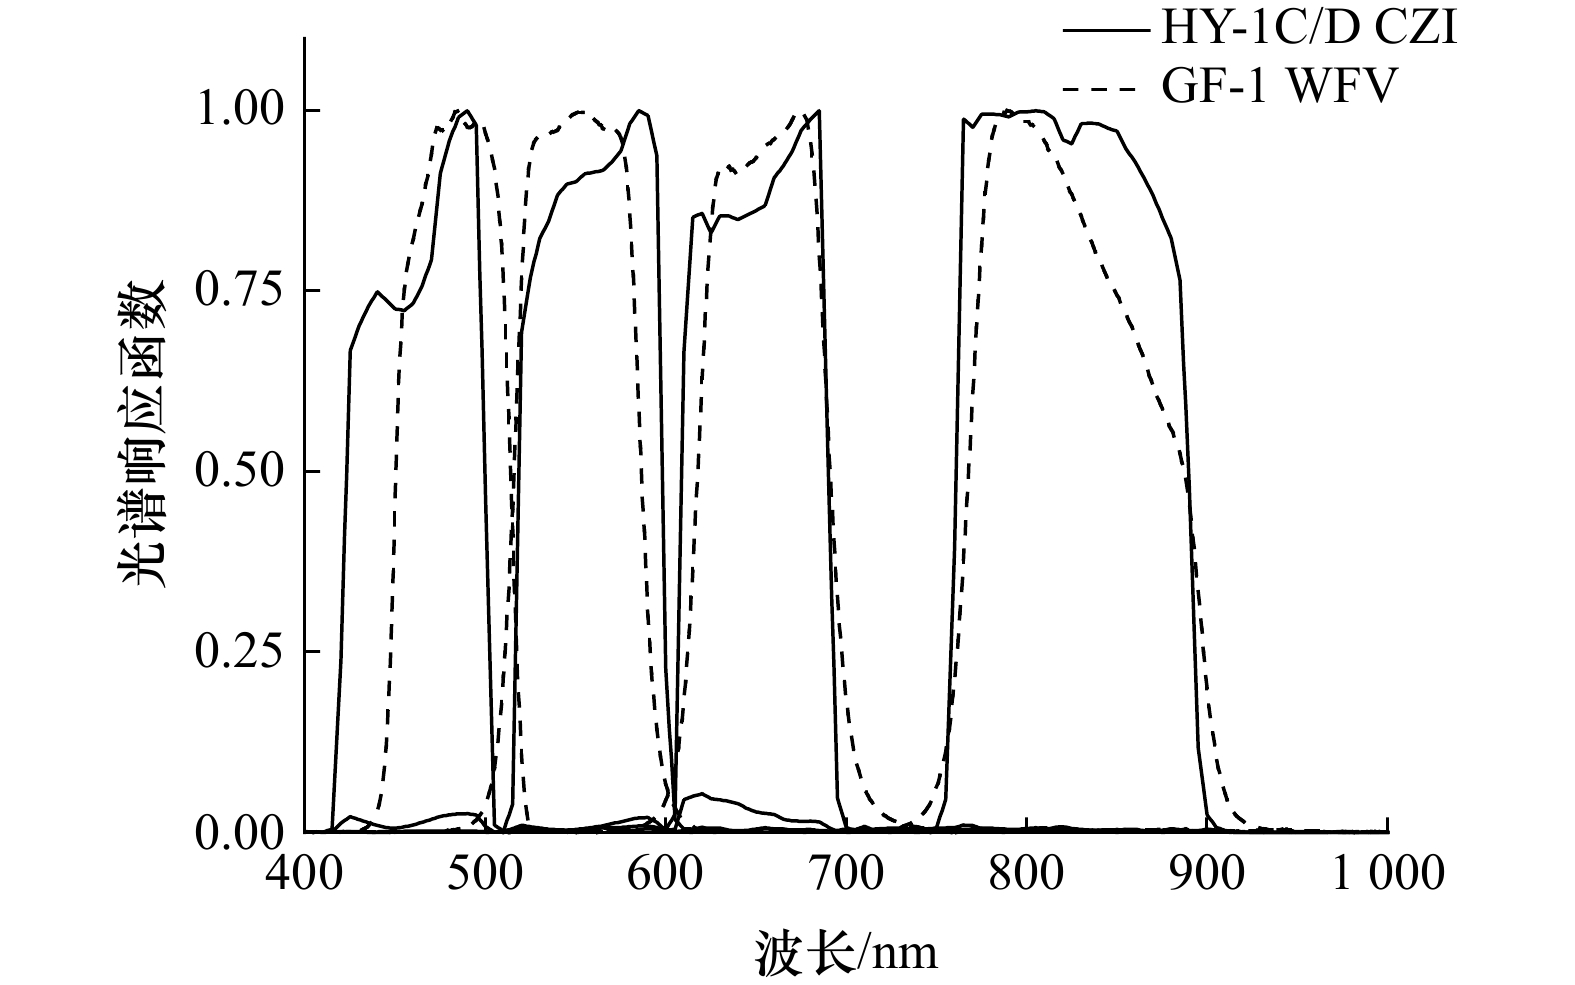
图 1 HY-1C/D CZI、GF-1 WFV光谱响应函数
Fig. 1 Spectral response functions of HY-1C/D CZI and GF-1 WFV

图 3 不同类型水体样本分布示意图与光谱曲线
Fig. 3 Schematic distribution and spectral curves of different types of water bodies
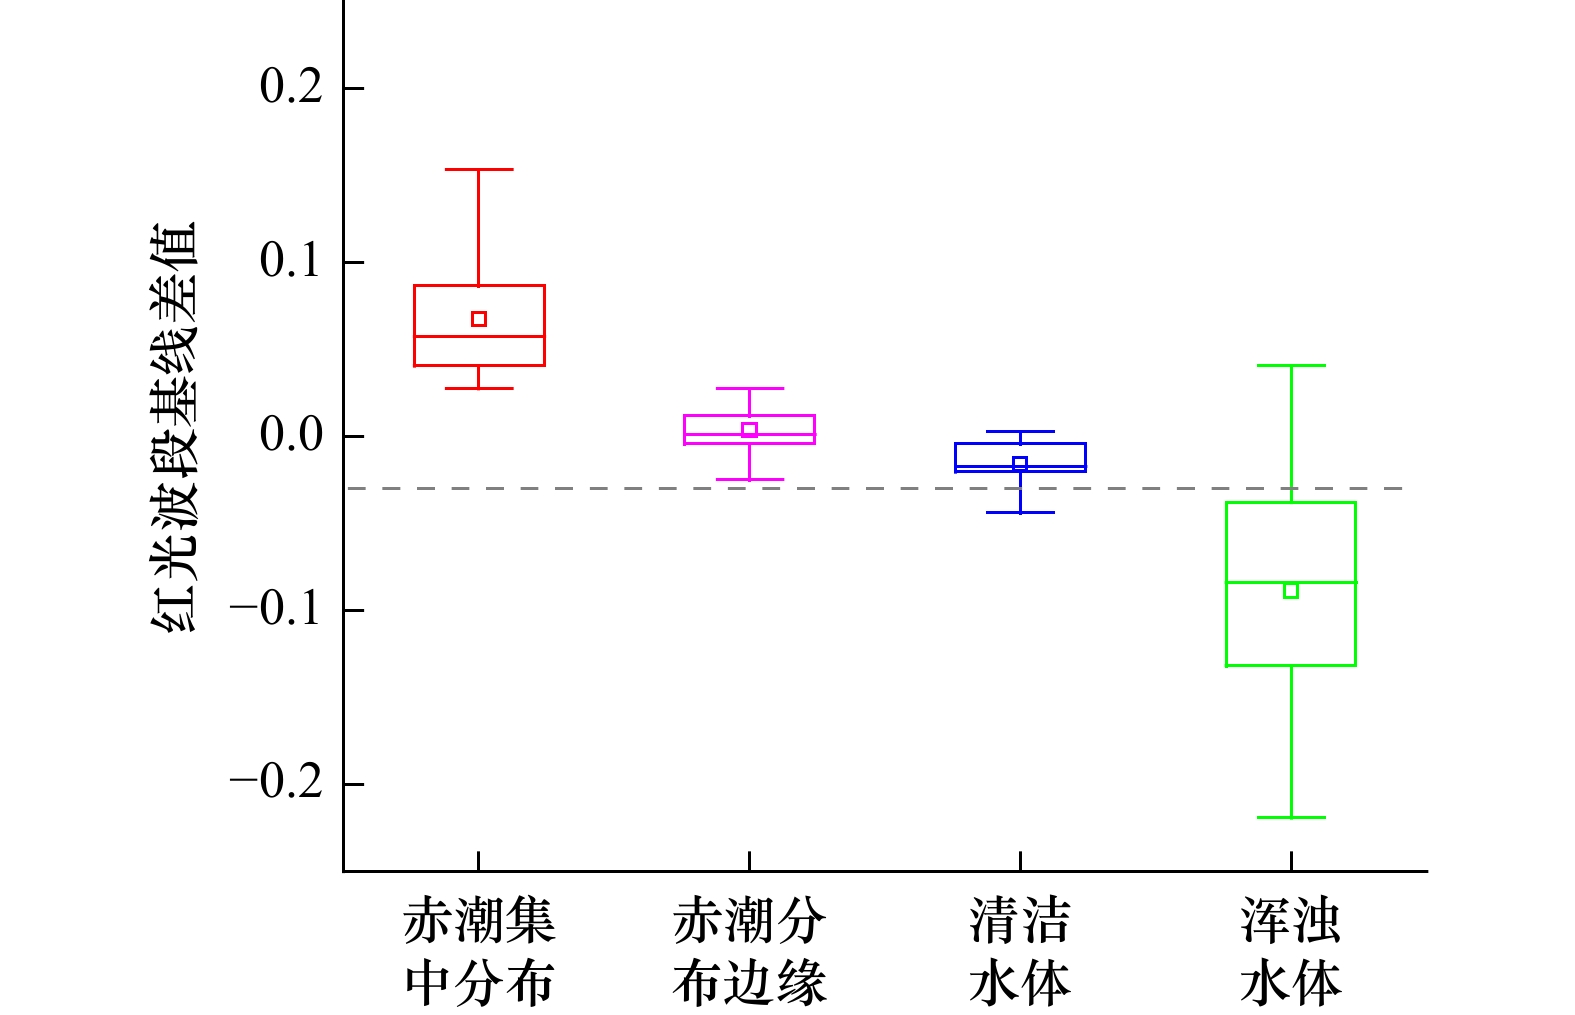
图 5 红光波段基线差值统计结果
Fig. 5 Statistical results of the values of the baseline difference in the red band
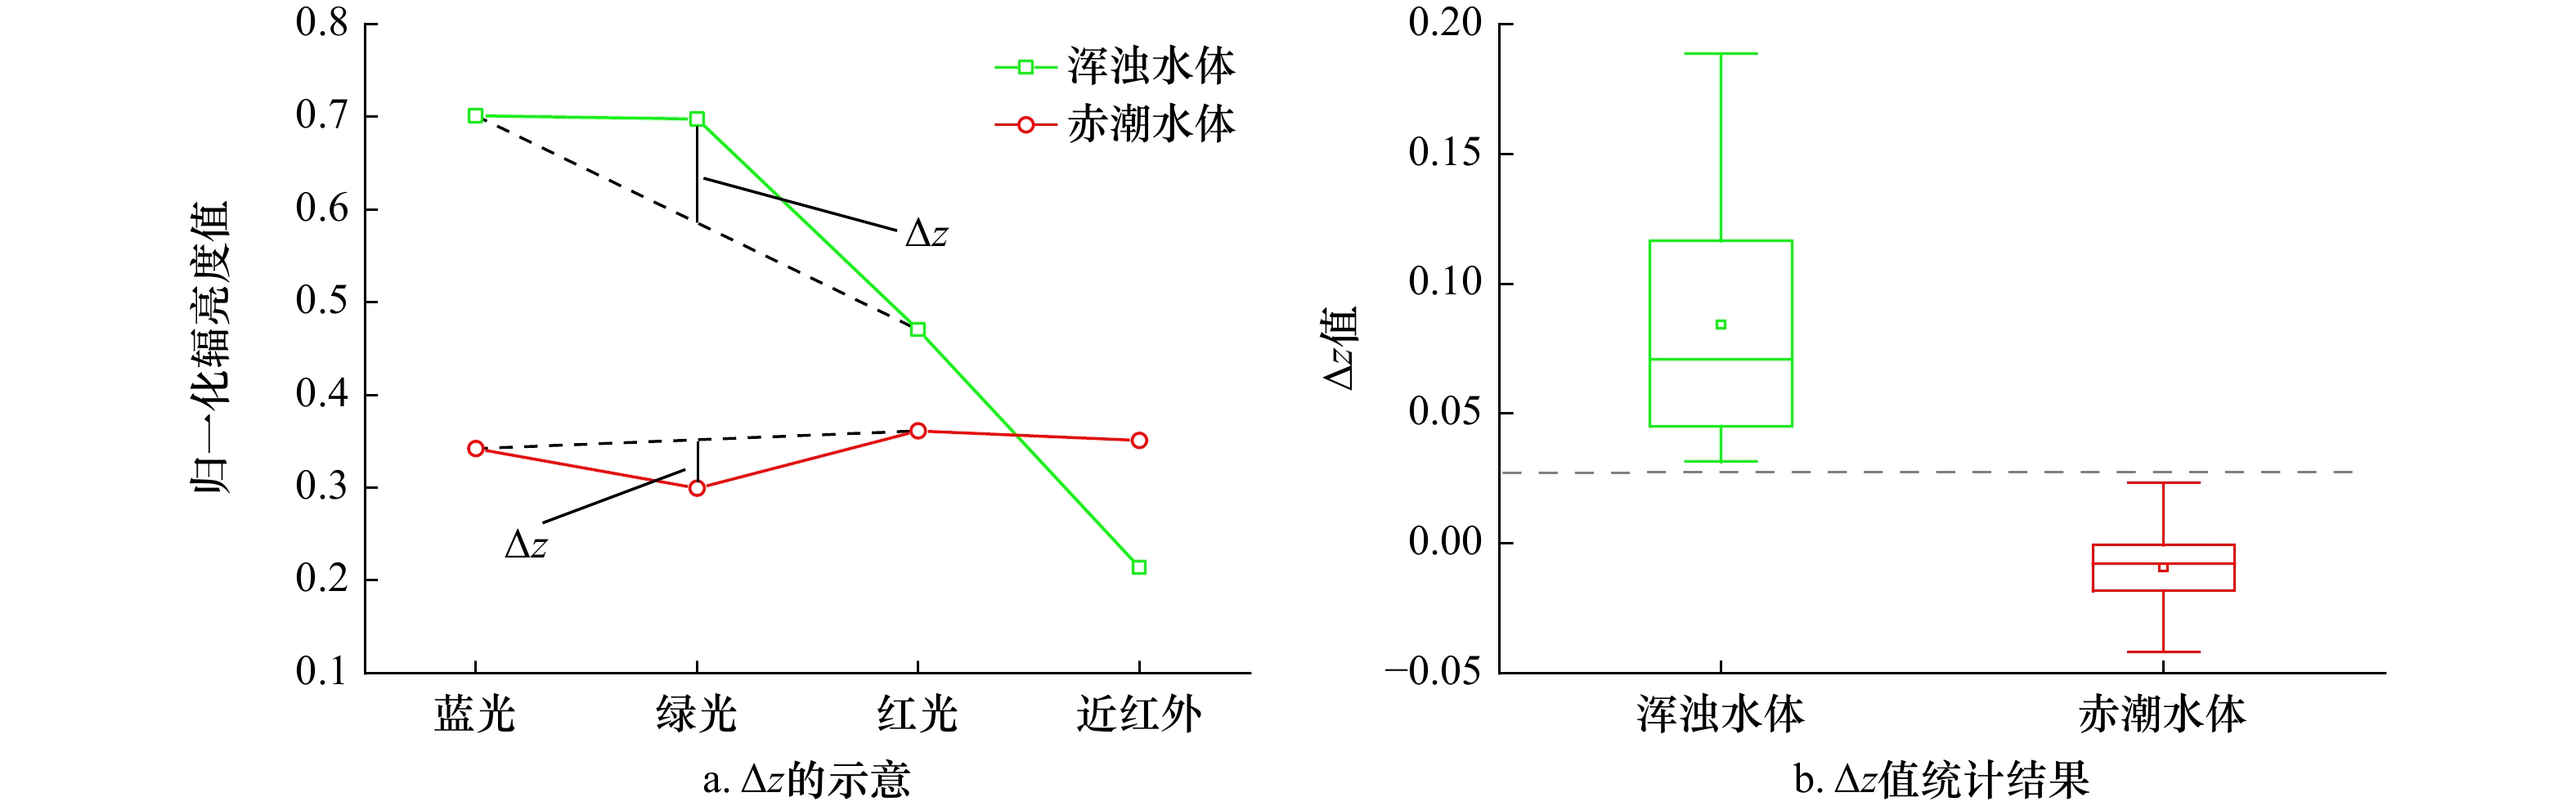
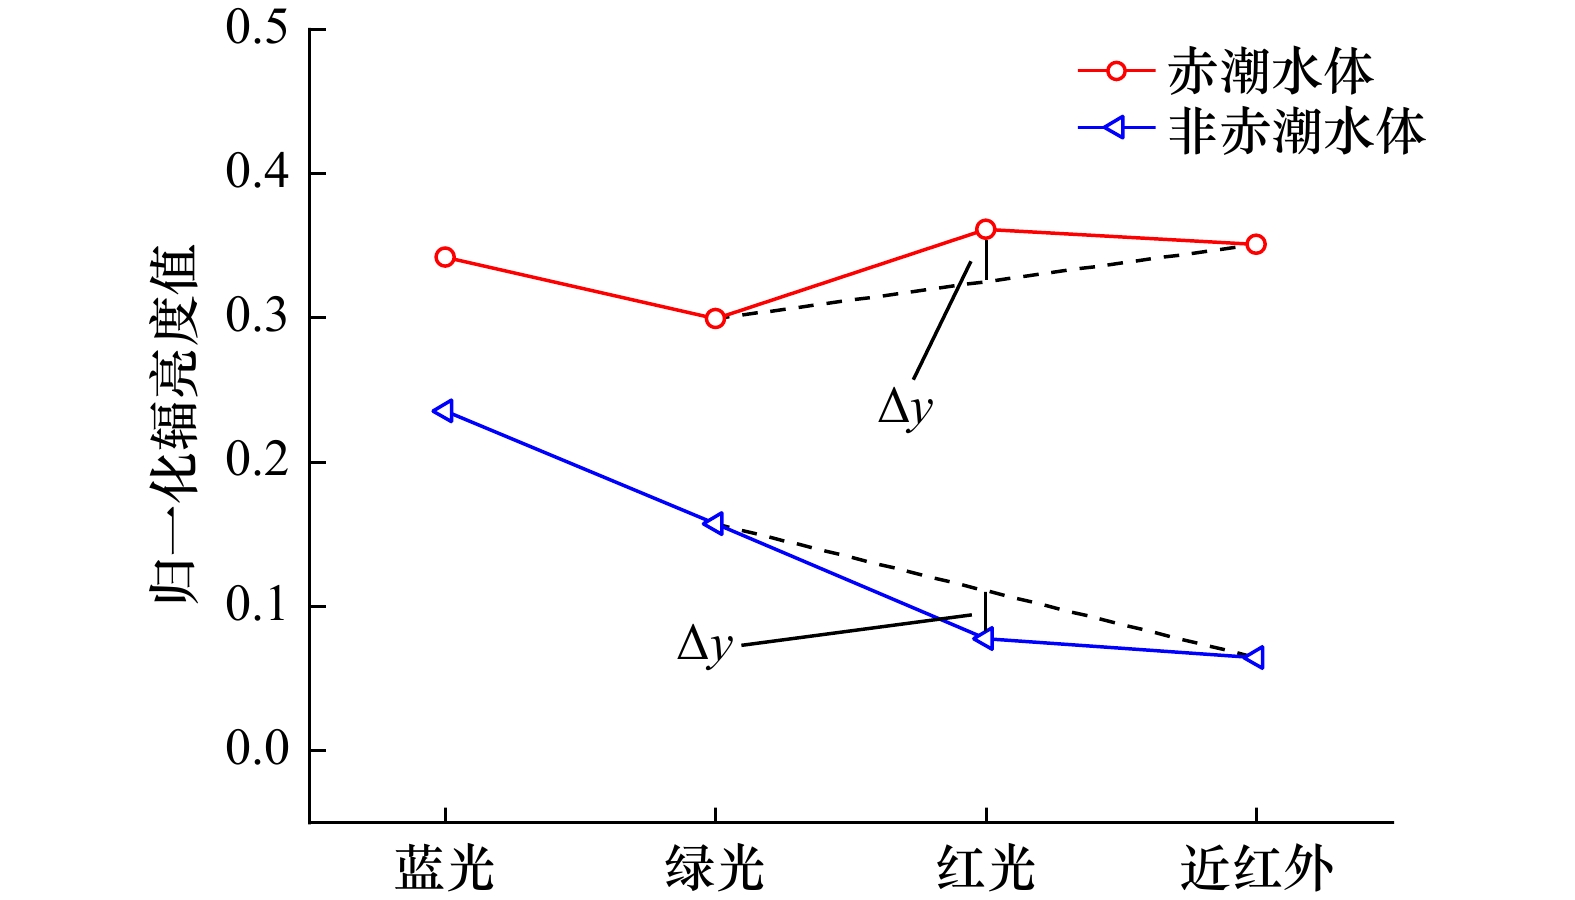
图 6 绿光波段基线差的示意图与统计结果
Fig. 6 Schematic and statistical results of the baseline difference in the green band

图 7 不同倍数加和局部赤潮探测结果
Fig. 7 Local red tide detection results of different multiplicative summation

图 8 不同倍数加和赤潮探测精度
Fig. 8 Accuracy of red tide detection by different multiplicative summation

图 9 基于光谱特征的赤潮探测方法流程图
Fig. 9 Flowchart of red tide detection method based on spectral features

图 10 HY-1C/D CZI影像赤潮探测结果(红色表示赤潮)
Fig. 10 HY-1C/D CZI image red tide detection results (red indicates red tide)

图 11 HY-1C/D CZI影像局部赤潮探测结果(红色表示赤潮)
Fig. 11 Local red tide detection results of HY-1C/D CZI image (red indicates red tide)

图 12 浑浊水体区域赤潮探测结果(红色表示赤潮)
Fig. 12 Red tide detection results in turbid water areas (red indicates red tide)

图 13 不同赤潮探测方法结果对比(红色表示赤潮)
Fig. 13 Comparison of results of different red tide detection methods (red indicates red tide)

图 14 不同赤潮探测方法局部赤潮探测结果(红色表示赤潮)
Fig. 14 Local red tide detection results of different red tide detection methods (red indicates red tide)
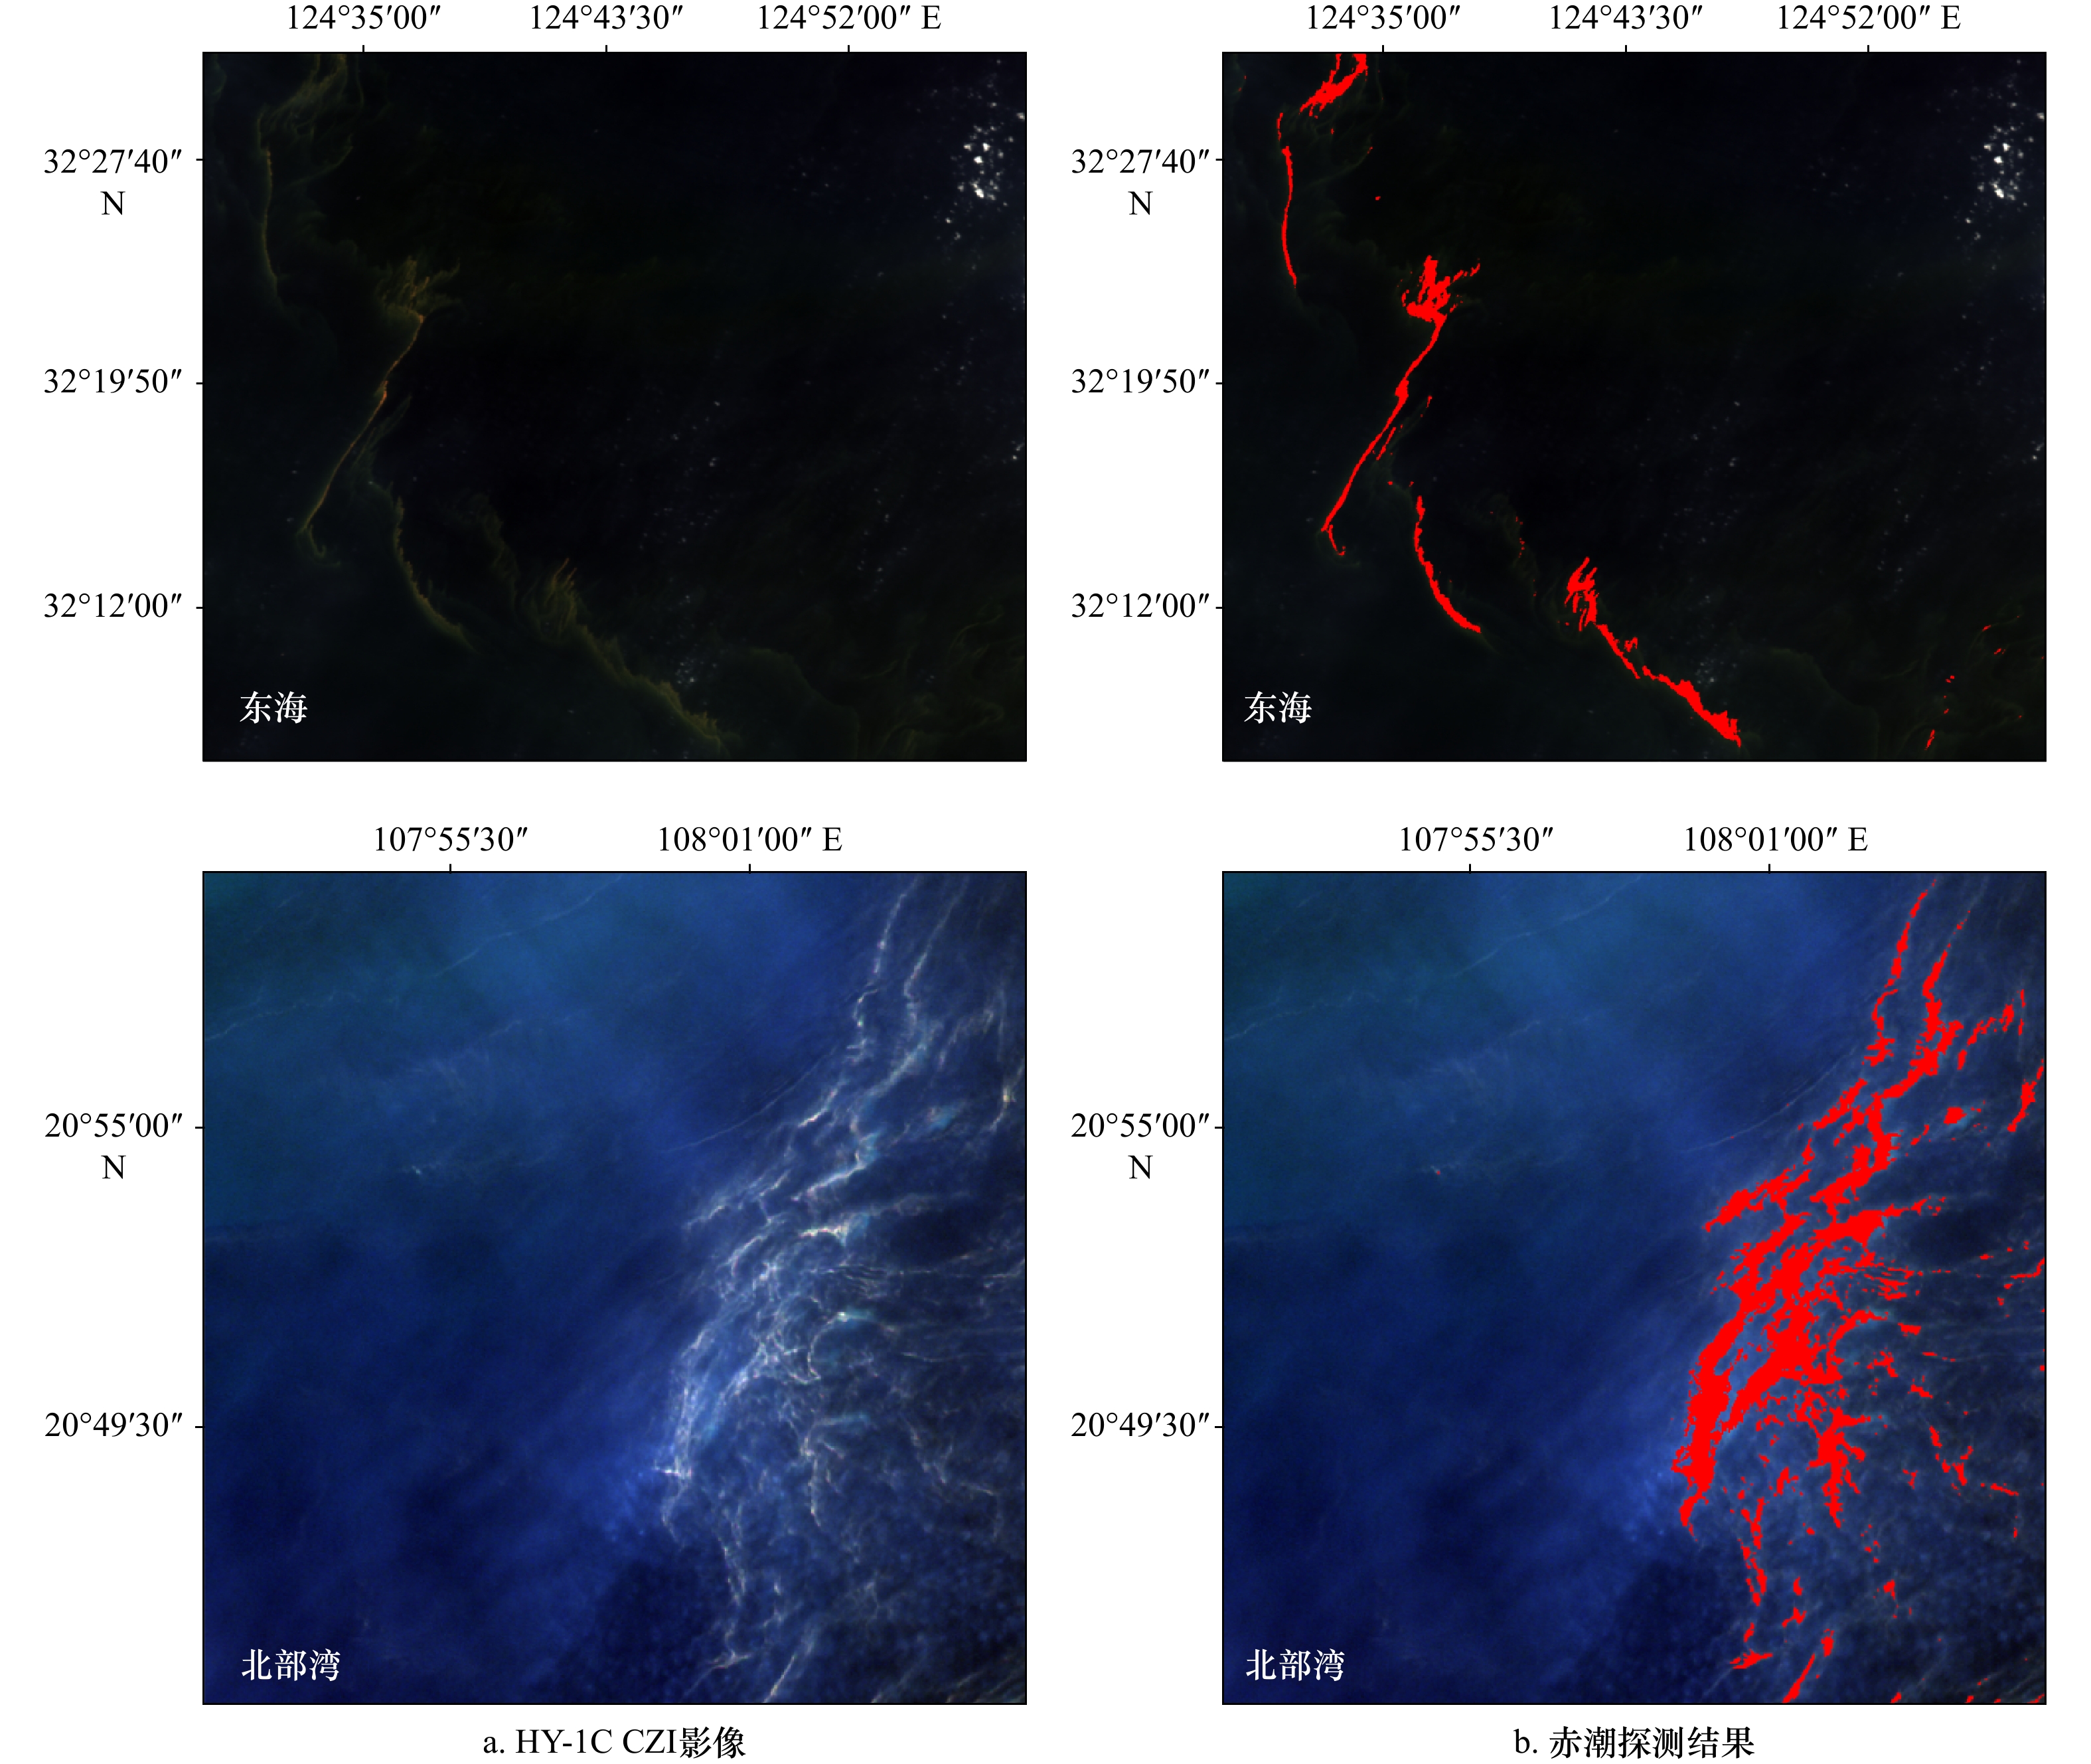
图 15 不同海洋环境HY-1C CZI影像赤潮探测结果(红色表示赤潮)
Fig. 15 Red tide detection results of HY-1C CZI images in different marine environments (red indicates red tide)
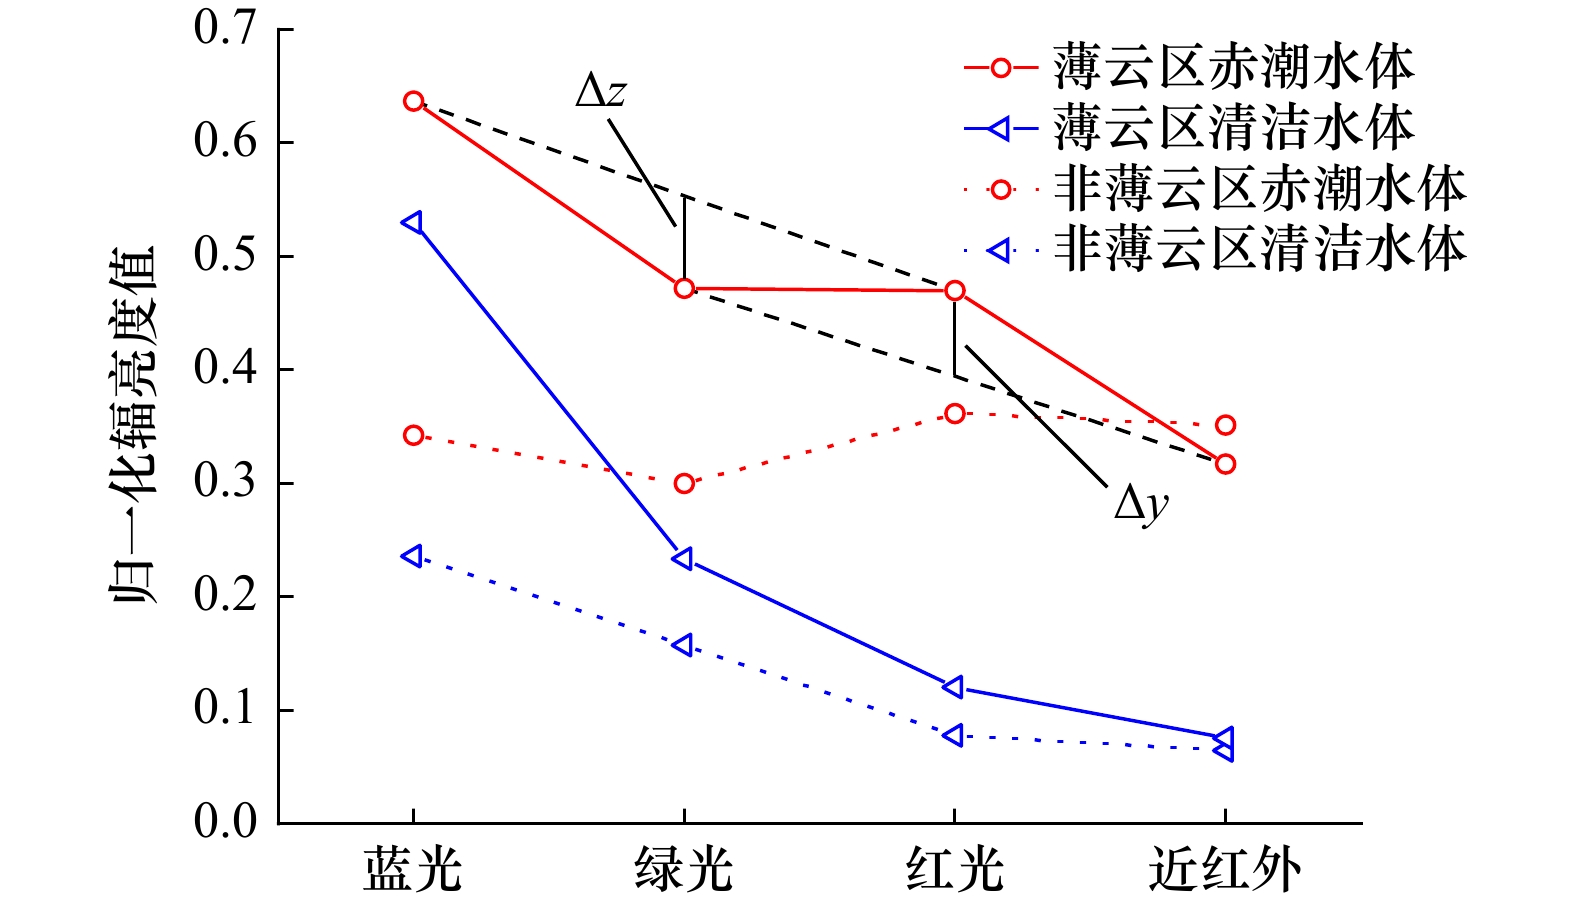
图 16 有无薄云覆盖下不同类型水体光谱曲线
Fig. 16 Spectral curves of different types of water bodies with and without thin cloud cover
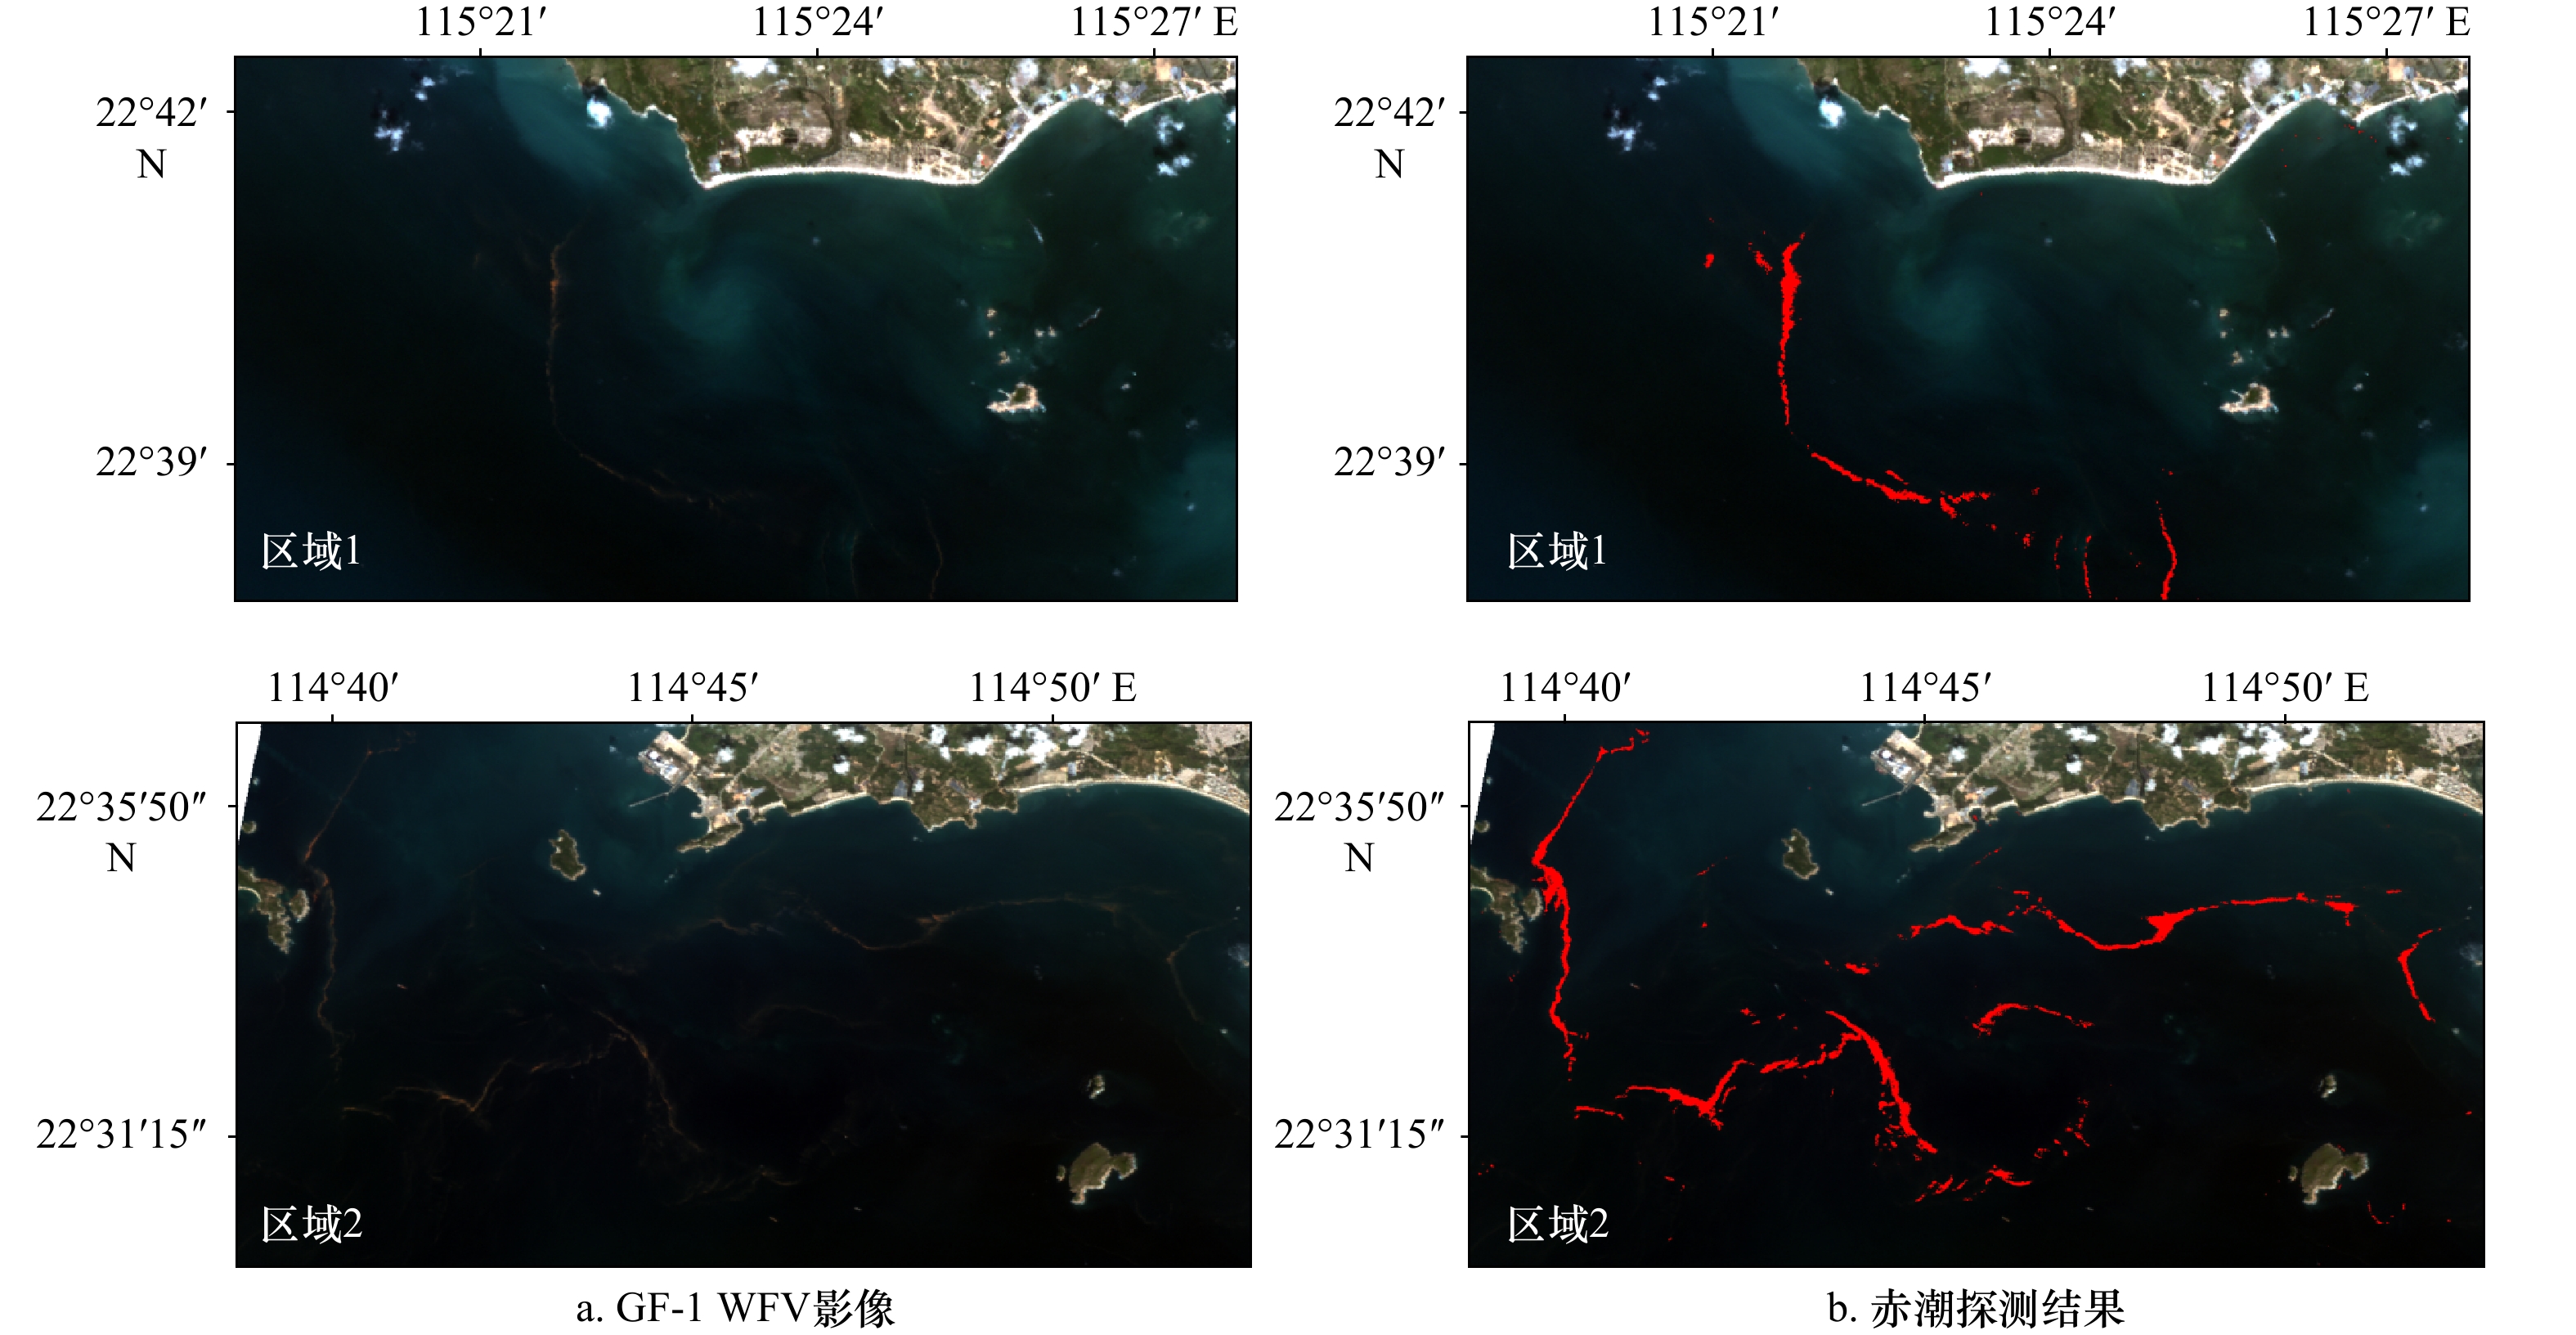
图 17 GF-1 WFV影像赤潮探测结果(红色表示赤潮)
Fig. 17 GF-1 WFV image red tide detection results (red indicates red tide)
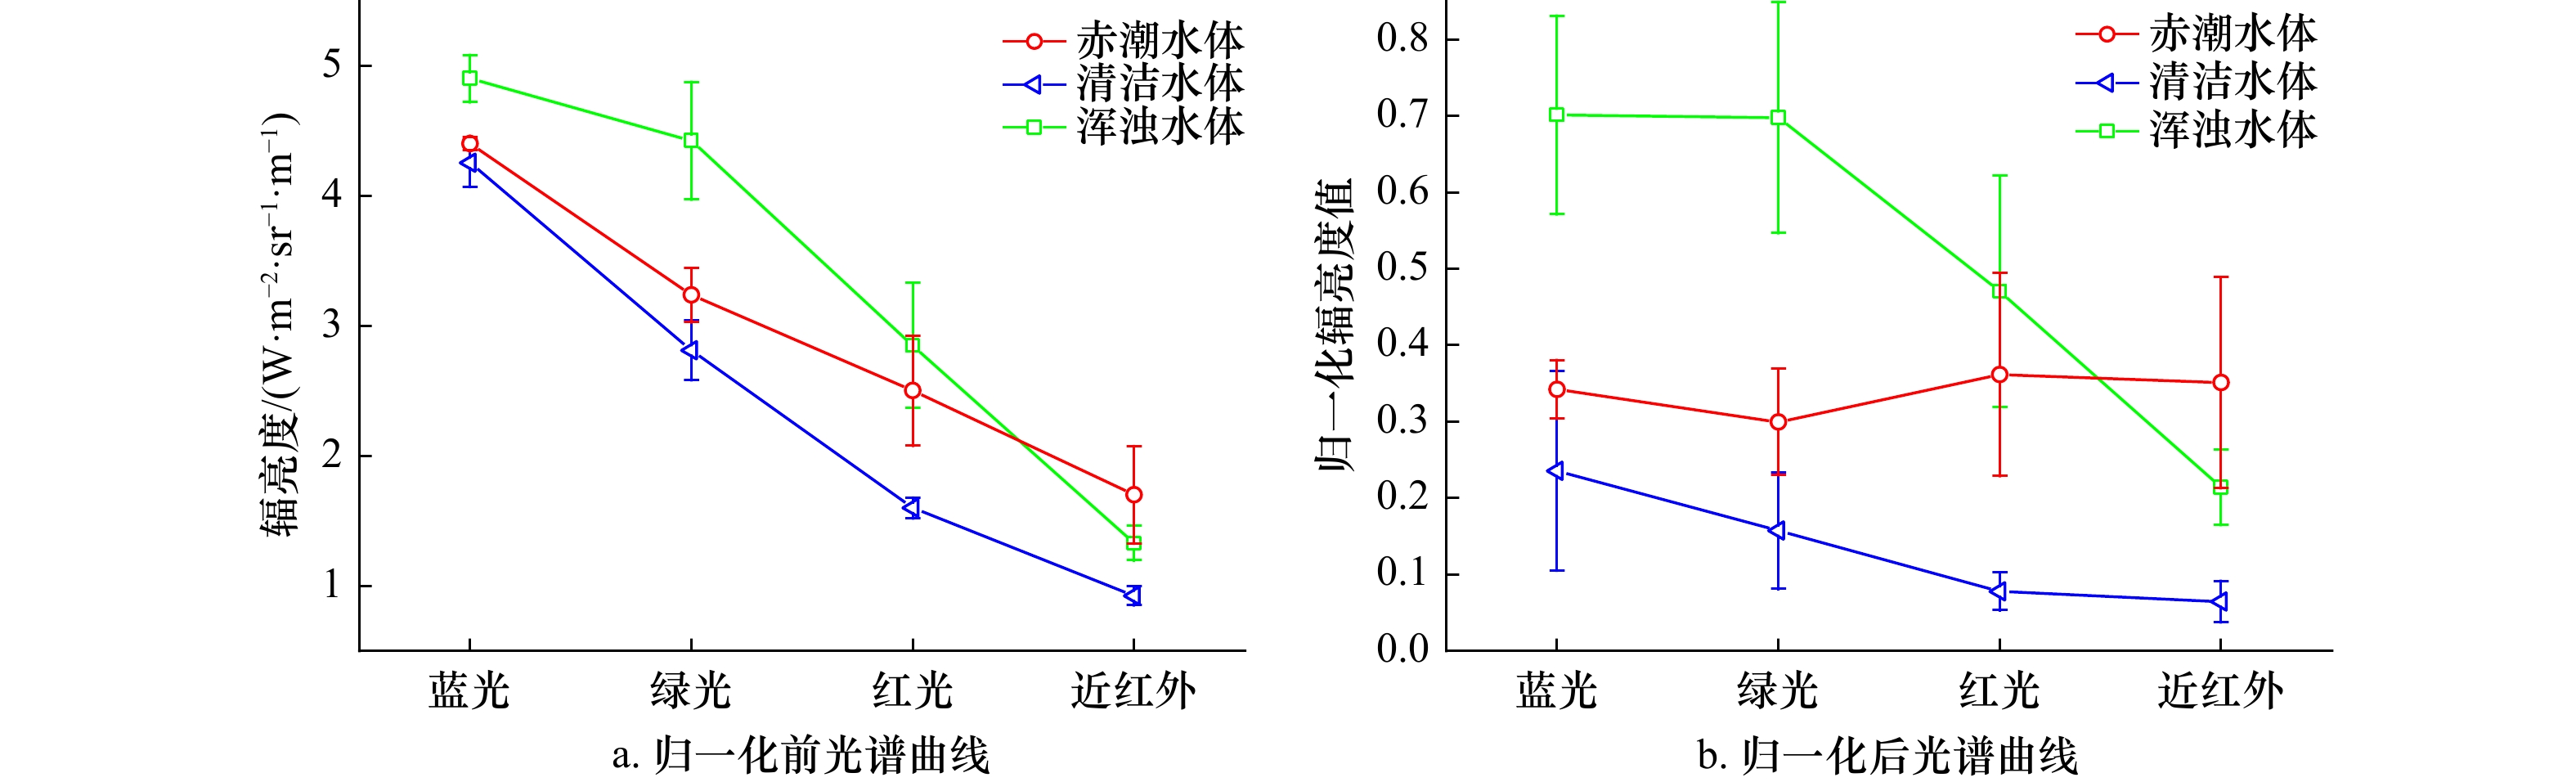
图 18 归一化处理前后不同类型水体光谱曲线
Fig. 18 Spectral curves of different types of water bodies before and after normalization
表 1 HY-1C/D CZI和GF-1 WFV卫星传感器参数
Tab. 1 HY-1C/D CZI and GF-1 WFV satellite sensor parameters
传感器 波段 光谱范围/
nm中心波长/
nm空间分辨率/
m幅宽/
km重访周期/
dHY-1C/D CZI 1 420~500 460 50 950 3 2 520~600 560 50 950 3 3 610~690 650 50 950 3 4 760~890 825 50 950 3 GF-1 WFV 1 450~520 485 16 800 4 2 520~600 560 16 800 4 3 630~690 660 16 800 4 4 760~900 830 16 800 4  下载: 导出CSV
表 2 所用卫星影像详细信息
Tab. 2 Detailed information of satellite images used
传感器 成像时间 纬度 经度 覆盖区域 HY-1D CZI 2022年3月13日 19° 29' 44"~24° 33' 38"N 108° 00' 00"~118° 09' 04"E 广东红海湾 HY-1C CZI 2022年3月14日 19° 39' 52"~24° 44' 10"N 110° 10' 55"~120° 18' 59"E 广东红海湾 2020年8月17日 31° 38' 33"~34° 44' 11"N 124° 14' 34"~135° 27' 05"E 东海 2021年2月14日 16° 50' 08"~21° 52' 53"N 105° 48' 27"~115° 37' 30"E 广西北部湾 GF-1 WFV 2022年3月13日 21° 48' 09"~24° 03' 14"N 114° 34' 08"~117° 12' 22"E 广东红海湾
下载: 导出CSV
表 3 不同方法赤潮探测精度
Tab. 3 Accuracy of red tide detection by different methods
方法 总体精度/% 精确率/% 召回率/% F1-Score Kappa系数 RTSI 98.42 89.72 90.16 0.90 0.89 GF1_RI 97.02 81.90 79.76 0.81 0.79
下载: 导出CSV
-
[1] 崔廷伟, 张杰, 马毅, 等. 赤潮光谱特征及其形成机制[J]. 光谱学与光谱分析, 2006, 26(5): 884−886. doi: 10.3321/j.issn:1000-0593.2006.05.025Cui Tingwei, Zhang Jie, Ma Yi, et al. Study of red tide spectral characteristics and its mechanism[J]. Spectroscopy and Spectral Analysis, 2006, 26(5): 884−886. doi: 10.3321/j.issn:1000-0593.2006.05.025 [2] 谢宏英, 王金辉, 马祖友, 等. 赤潮灾害的研究进展[J]. 海洋环境科学, 2019, 38(3): 482−488. doi: 10.12111/j.mes20190323Xie Hongying, Wang Jinhui, Ma Zuyou, et al. Review of harmful algal blooms hazard[J]. Marine Environmental Science, 2019, 38(3): 482−488. doi: 10.12111/j.mes20190323 [3] do Rosário Gomes H, Goes J I, Matondkar S G P, et al. Massive outbreaks of Noctiluca scintillans blooms in the Arabian Sea due to spread of hypoxia[J]. Nature Communications, 2014, 5(1): 4862. doi: 10.1038/ncomms5862 [4] 齐琳, 胡传民, 陆应诚, 等. 基于HY-1C/D卫星CZI的海洋、湖泊中漂浮藻藻华的光谱分析与识别[J]. 遥感学报, 2023, 27(1): 157−170. doi: 10.11834/jrs.20235009Qi Lin, Hu Chuanmin, Lu Yingcheng, et al. Spectral analysis and identification of floating algal blooms in oceans and lakes based on HY-1C/D CZI observations[J]. National Remote Sensing Bulletin, 2023, 27(1): 157−170. doi: 10.11834/jrs.20235009 [5] 杨幸幸, 杨颖, 许彩燕, 等. 福建和浙江海域夜光藻赤潮2009−2019年的变化及主要环境因子分析[C]//第三届海洋开发与管理学术年会论文集. 北京: 海洋出版社, 2019: 76−83.Yang Xingxing, Yang Ying, Xu Caiyan, et al. Changes of red tide of nocturnal algae in Fujian and Zhejiang warers from 2009 to 2019 and analysis of main environment factors[C]//Proceedings of the Third Annual Conference on Ocean Development and Management. Beijing: China Ocean Press, 2019: 76−83. [6] Gower J, King S. Validation of chlorophyll fluorescence derived from MERIS on the west coast of Canada[J]. International Journal of Remote Sensing, 2007, 28(3/4): 625−635. [7] Gower J, King S, Goncalves P. Global monitoring of plankton blooms using MERIS MCI[J]. International Journal of Remote Sensing, 2008, 29(21): 6209−6216. doi: 10.1080/01431160802178110 [8] Lee M S, Park K A, Micheli F. Derivation of red tide index and density using geostationary ocean color imager (GOCI) data[J]. Remote Sensing, 2021, 13(2): 298. doi: 10.3390/rs13020298 [9] Shen Fang, Tang Rugang, Sun Xuerong, et al. Simple methods for satellite identification of algal blooms and species using 10-year time series data from the East China Sea[J]. Remote Sensing of Environment, 2019, 235: 111484. doi: 10.1016/j.rse.2019.111484 [10] Tao Bangyi, Mao Zhihua, Lei Hui, et al. A novel method for discriminating Prorocentrum donghaiense from diatom blooms in the East China Sea using MODIS measurements[J]. Remote Sensing of Environment, 2015, 158: 267−280. doi: 10.1016/j.rse.2014.11.004 [11] Tao Bangyi, Mao Zhihua, Wang Difeng, et al. The use of MERIS fluorescence bands for red tides monitoring in the East China Sea[C]//Proceedings of SPIE 8175, Remote Sensing of the Ocean, Sea Ice, Coastal Waters, and Large Water Regions 2011. Prague: SPIE, 2011: 439−446. [12] Liu Rongjie, Xiao Yanfang, Ma Yi, et al. Red tide detection based on high spatial resolution broad band optical satellite data[J]. ISPRS Journal of Photogrammetry and Remote Sensing, 2022, 184: 131−147. doi: 10.1016/j.isprsjprs.2021.12.009 [13] Liu Rongjie, Zhang Jie, Cui Binge, et al. Red tide detection based on high spatial resolution broad band satellite data: a case study of GF-1[J]. Journal of Coastal Research, 2019, 90(SI): 120−128. [14] 刘建强, 叶小敏, 宋庆君, 等. HY-1C/D海洋水色卫星产品体系及其典型应用[J]. 遥感学报, 2023, 27(1): 1−13. doi: 10.11834/jrs.20235002Liu Jianqiang, Ye Xiaomin, Song Qingjun, et al. Products of HY-1C/D ocean color satellites and their typical applications[J]. National Remote Sensing Bulletin, 2023, 27(1): 1−13. doi: 10.11834/jrs.20235002 [15] Cao Mengmeng, Qing Song, Jin E, et al. A spectral index for the detection of algal blooms using Sentinel-2 Multispectral Instrument (MSI) imagery: a case study of Hulun Lake, China[J]. International Journal of Remote Sensing, 2021, 42(12): 4514−4535. doi: 10.1080/01431161.2021.1897186 [16] Yunus A P, Dou Jie, Sravanthi N. Remote sensing of chlorophyll- a as a measure of red tide in Tokyo Bay using hotspot analysis[J]. Remote Sensing Applications: Society and Environment, 2015, 2: 11−25. doi: 10.1016/j.rsase.2015.09.002 [17] 陈曦. 基于MODIS和HJ-1数据的赤潮遥感监测[D]. 福州: 福州大学, 2014.Chen Xi. Red tide remote sensing monitoring based on MODIS and HJ-1 data[D]. Fuzhou: Fuzhou University, 2014. [18] Lee M S, Park K A, Chae J, et al. Red tide detection using deep learning and high-spatial resolution optical satellite imagery[J]. International Journal of Remote Sensing, 2020, 41(15): 5838−5860. doi: 10.1080/01431161.2019.1706011 [19] Zhao Xin, Liu Rongjie, Ma Yi, et al. Red tide detection method for HY-1D coastal zone imager based on U-net convolutional neural network[J]. Remote Sensing, 2022, 14(1): 88. [20] Cui Hanlin, Chen Shuguo, Hu Lianbo, et al. HY1C/D-CZI Noctiluca scintillans bloom recognition network based on hybrid convolution and self-attention[J]. Remote Sensing, 2023, 15(7): 1757. doi: 10.3390/rs15071757 [21] Lin Mingsen, Zou Bin, Zeng Tao, et al. Marine environmental monitoring with GF-1 data[C]//Proceedings of 2016 IEEE International Geoscience and Remote Sensing Symposium. Beijing: IEEE, 2016: 3750−3753. [22] 葛化鑫, 刘荣杰, 赵鑫, 等. 中高空间分辨率宽波段光学卫星传感器参数赤潮探测影响研究[J]. 海洋学报, 2022, 44(12): 136−147.Ge Huaxin, Liu Rongjie, Zhao Xin, et al. Impact of medium and high spatial resolution wide band optical satellite sensor parameters on red tide detection[J]. Haiyang Xuebao, 2022, 44(12): 136−147. [23] Kreyszig E. Advanced Engineering Mathematics[M]. 10th ed. New Delhi: Wiley, 2011: 154−196. [24] Congalton R G. A review of assessing the accuracy of classifications of remotely sensed data[J]. Remote Sensing of Environment, 1991, 37(1): 35−46. doi: 10.1016/0034-4257(91)90048-B [25] Powers D M W. Evaluation: from precision, recall and F-measure to ROC, informedness, markedness & correlation[J]. Journal of Machine Learning Technologies, 2011, 2(1): 37−63. [26] 蔡丽娜. 舟山近岸海域水体光谱特性分析[J]. 安徽农业科学, 2012, 40(16): 9070−9071, 9090 doi: 10.3969/j.issn.0517-6611.2012.16.104Cai Lina. Analysis of nearshore water spectral character in Zhoushan[J]. Journal of Anhui Agricultural Sciences, 2012, 40(16): 9070−9071,9090. doi: 10.3969/j.issn.0517-6611.2012.16.104 [27] 方圣辉, 张加晋. 不同泥沙含量水体光谱特性分析[J]. 测绘信息与工程, 2007, 32(6): 47−49. doi: 10.3969/j.issn.1007-3817.2007.06.020Fang Shenghui, Zhang Jiajin. Spectral property analysis of water suspended sediment concentrations[J]. Journal of Geomatics, 2007, 32(6): 47−49. doi: 10.3969/j.issn.1007-3817.2007.06.020 [28] 雷惠, 潘德炉, 陶邦一, 等. 东海典型水体的黄色物质光谱吸收及分布特征[J]. 海洋学报, 2009, 31(2): 57−62.Lei Hui, Pan Delu, Tao Bangyi, et al. The spectral absorption and distribution characteristics of CDOM in the typical waters of the East China Sea[J]. Haiyang Xuebao, 2009, 31(2): 57−62. [29] Xie Qiling, Yan Nanyang, Yang Xue, et al. Synoptic view of an unprecedented red Noctiluca scintillans bloom in the Beibu Gulf, China[J]. Science of the Total Environment, 2023, 863: 160980. doi: 10.1016/j.scitotenv.2022.160980 -


计量
- 文章访问数: 387
- HTML全文浏览量: 315
- PDF下载量: 67
- 被引次数: 0
