

Cases study of intraseasonal variability of velocity happened in spring in the northern South China Sea
-
摘要: 在南海北部,与中尺度涡相关的季节内变异特征十分显著,通过比较不同时期流场的季节内变异特征,有助于揭示不同动力不稳定中尺度涡对季节内活动的影响。本文以南海北部2009年春季和2020年春季为例,分析了两个时期中尺度涡的动力不稳定性,从而探究季节内变异特征。基于潜标实测流速数据,本文进行了动能谱分析,结果显示这两个时期的流场季节内变异具有相似特征,显著周期分别为10~60 d和30~90 d。季节内信号主要出现在200 m以上的上表层水域,其中30~90 d的季节内流是对应观测期间的主要季节内成分。滞后回归分析和动力不稳定性的计算表明,2009年春季的季节内变异受移动快但强度弱的表层中尺度涡影响,动力不稳定性由斜压不稳定和正压不稳定共同调制;而2020年春季的季节内变异是受强斜压性的中尺度涡影响,通过流速垂向切变增强,从而较快地触发流场季节内变异的发生。本文研究结果有助于深入了解中尺度涡对南海北部季节内活动的影响机制,为海洋动力学和气候研究提供了重要的参考和理论基础。Abstract: The intraseasonal variability (ISV) associated with mesoscale eddies in the northern South China Sea has been significant. Comparing the intraseasonal variability of flow at different times helps to elucidate the influence of mesoscale eddies with various dynamic instability, therefore, this study analyzed the dynamic instability of mesoscale eddies in the spring of 2009 and 2020 in the northern South China Sea, to figure out the characteristics of intraseasonal variability. Based on mooring velocity data, it conducted kinetic spectral analysis, and the results demonstrated that the ISV with period of 10‒60 days in 2009 and the ISV with period of 30‒90 days in 2020 displayed a similar vertical feature, with strong intraseasonal signals primarily occurring in the upper layer above 200 m. Moreover, the ISV with period of 30‒90 days was the main intraseasonal component during the corresponding observation period. Lag-regression analysis and calculation of dynamic instability showed that the intraseasonal variation of spring 2009 was affected by fast-moving but weak surface mesoscale eddies, and the dynamic instability was modulated by baroclinic instability and barotropic instability. On the other hand, the intraseasonal variability in the spring of 2020 was influenced by strong baroclinic mesoscale eddies, which might trigger the occurrence of intraseasonal variability in the flow fields more rapidly through enhanced vertical shear of velocity. The findings of this study contribute to a deeper understanding of the impact mechanisms of mesoscale eddies on intraseasonal activities in the northern South China Sea, providing important references and a theoretical basis for ocean dynamics and climate research.
-
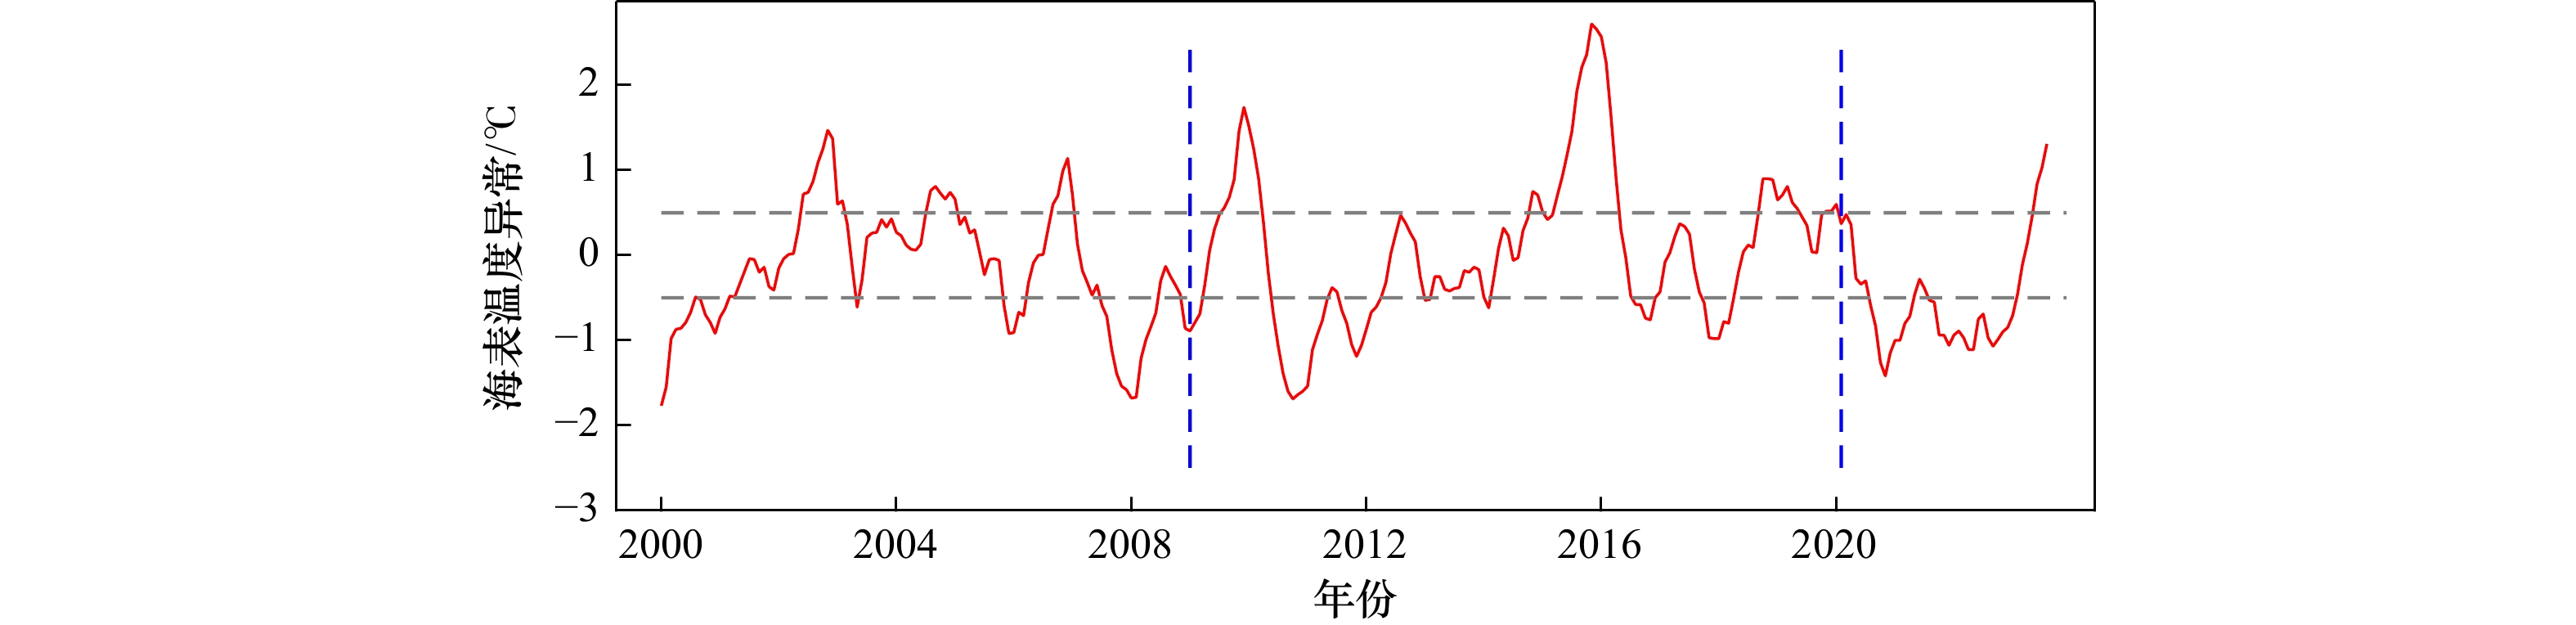
图 1 Niño3.4指数
统计数据来自 NOAA,时间为2000‒2023年,两条蓝色虚线分别表示2008/2009年和2019/2020年,两条灰色虚线分别为±0.5℃海表温度异常
Fig. 1 Niño3.4 index
Statistical data from NOAA, 2000‒2023, the two dashed blue lines represent the years 2008/2009 and 2019/2020 respectively, the two gray dashed lines are±0.5℃ sea surface temperature anomalies respectively
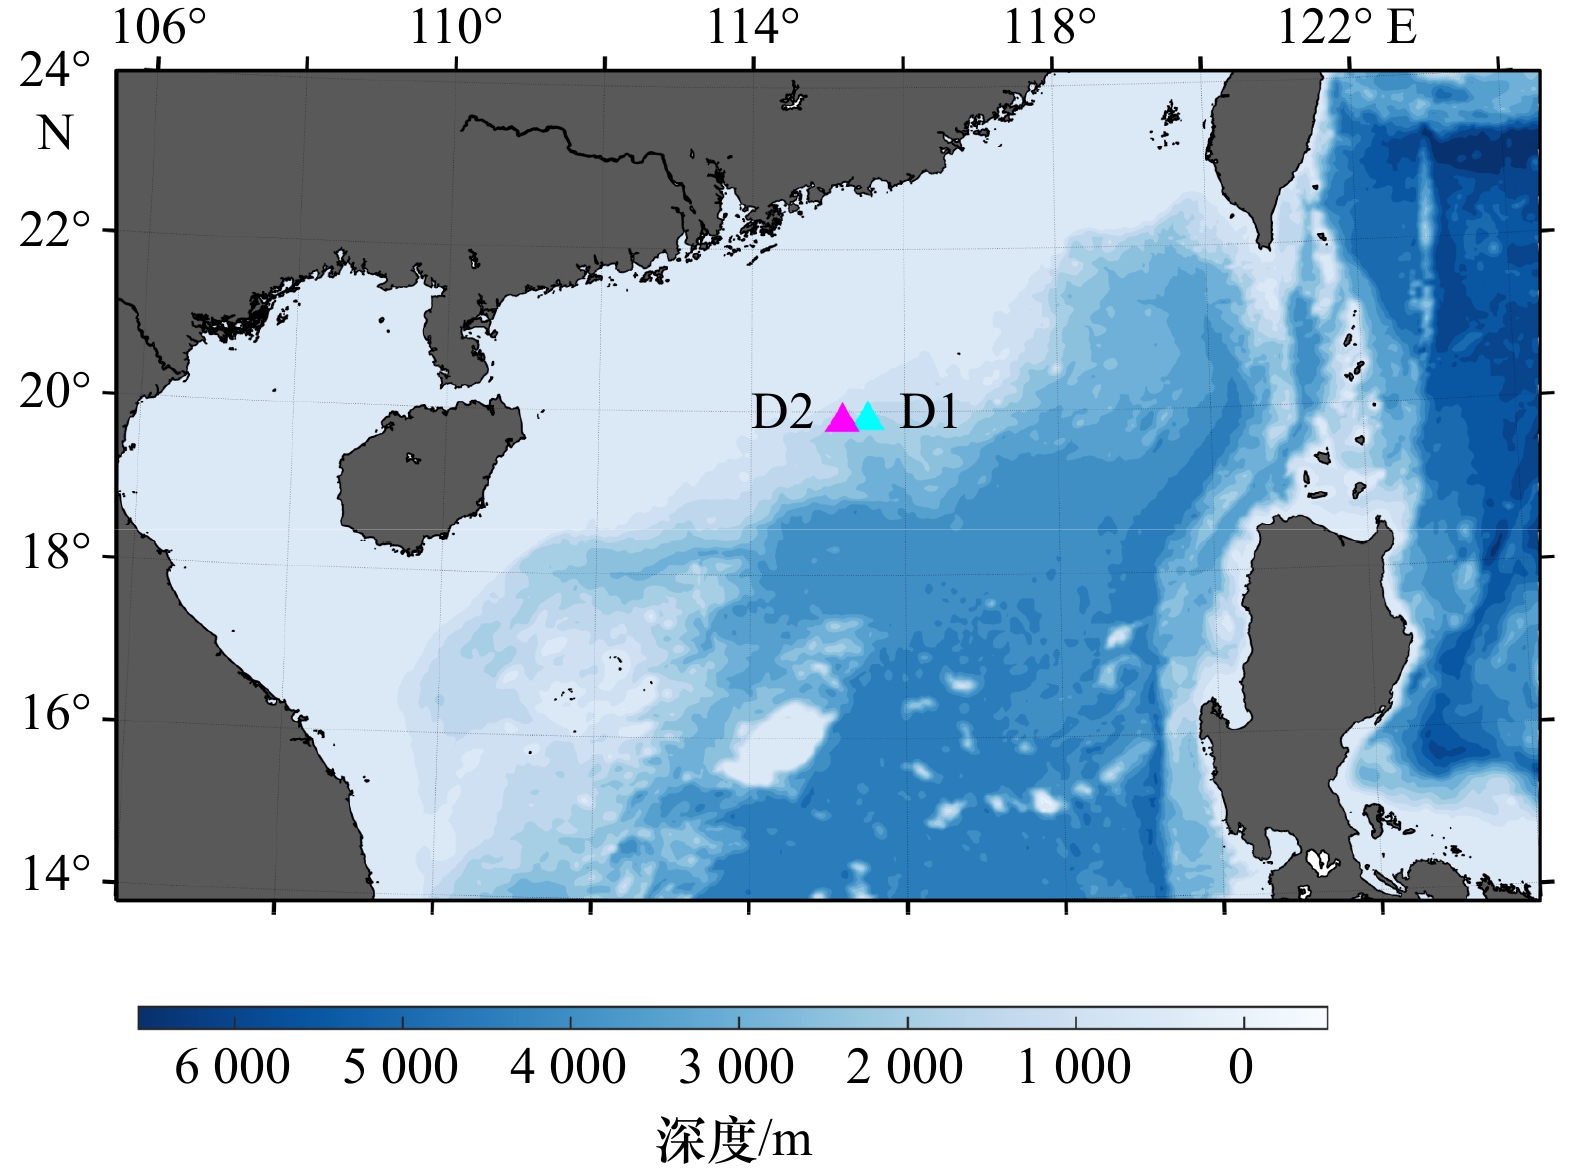
图 2 站位分布情况
青色三角形为D1站位点,品红色三角形为D2站位点
Fig. 2 Station distribution
Cyan triangle is Station D1, magenta triangle is Station D2

图 3 站位D1(a)和站位D2(b)不同深度的动能功率谱分析
蓝色、红色和黄色线分别代表150 m、250 m和400 m深度
Fig. 3 Kinetic energy power spectrum analysis at different depths at Station D1 (a) and Station D2 (b)
Blue, red and yellow lines represent depths of 150 m, 250 m and 400 m respectively

图 4 站位D1(a)和站位D2(b)各个主要周期动能的垂向分布
上层图(a1, b1)为原始动能,中层图(a2, b2)为短周期的季节内动能,下层图(a3, b3)为长周期的季节内动能。a2. 10~60 d,b2. 10~30 d,a3. 60~90 d,b3. 30~90 d
Fig. 4 Vertical distribution of major periodic kinetic energy at Station D1 (a) and Station D2 (b)
The upper figures (a1, b1) are the original kinetic energy, the middle figures (a2, b2) are the short-period intraseasonal kinetic energy, and the lower figures (a3, b3) are the long-period intraseasonal kinetic energy. a2. 10‒60 d, b2. 10‒30 d, a3. 60‒90 d, b3. 30‒90 d

图 5 2009年春季(a‒c)和2020年春季(d‒f),基于OW方法识别的表层中尺度涡及地转流
青色三角形为D1站位点,品红色三角形为D2站位点;红星表示为当日反气旋涡中心,橙线为反气旋涡移动路径;蓝星表示为当日气旋涡中心,绿线为气旋涡移动路径
Fig. 5 Surface mesoscale eddies and geostrophic current identified by OW method in spring 2009 (a‒c) and spring 2020 (d‒f)
Cyan triangle is Station D1, magenta triangle is Station D2; the red star represents the center of the anticycle eddy , and the orange line is the corresponding moving path, while the blue star represents the center of the cycle eddy, and the green line is the corresponding moving path

图 6 D1站位(a,c)和D2站位(b,d)的季节内动能(a, b)与对应季节内SLA的时间序列(c,d)
Fig. 6 Time series of intraseason kinetic energy (a, b) and corresponding intra-season SLA (c, d) for Station D1 (a, c) and Station D2 (b, d), respectively

图 7 D1站位点表层中尺度与季节内经向流滞后‒回归得到的海表面高度异常
a‒d. “‒”表示为表层中尺度涡超前季节内流28 d、21 d、14 d、7 d;f‒i. “+”表示表层中尺度涡滞后季节内流7 d、14 d、21 d、28 d。青色三角形表示D1站位点
Fig. 7 Sea level anomalies from surface mesoscale eddies and intraseasonal meridional flow lag-regression at Station D1
a‒d. “‒” represents the intraseasonal meridional flow lead the surface mesoscale eddy 28 d, 21 d, 14 d, 7 d; f‒i. “+” represents the intraseasonal meridional flow lag the surface mesoscale eddy 7 d, 14 d, 21 d, 28 d. Cyan triangle represents Station D1

图 8 D2站位点表层中尺度与季节内的经向流滞后‒回归得到的海表面高度异常
a‒d. “‒”表示为表层中尺度涡超前季节内流28 d、21 d、14 d、7 d;f‒i. “+”表示为表层中尺度涡滞后季节内流7 d、14 d、21 d、28 d。品红色三角形表示D2站位点
Fig. 8 Sea level anomalies from surface mesoscale eddies and intraseasonal meridional flow lag-regression at Station D2
a‒d. “‒” represents the intraseasonal meridional flow lead the surface mesoscale eddy 28 d, 21 d, 14 d, 7 d; f‒i. “+” represents the intraseasonal meridional flow lag the surface mesoscale eddy 7 d, 14 d, 21 d, 28 d. Magenta triangle represents Station D2
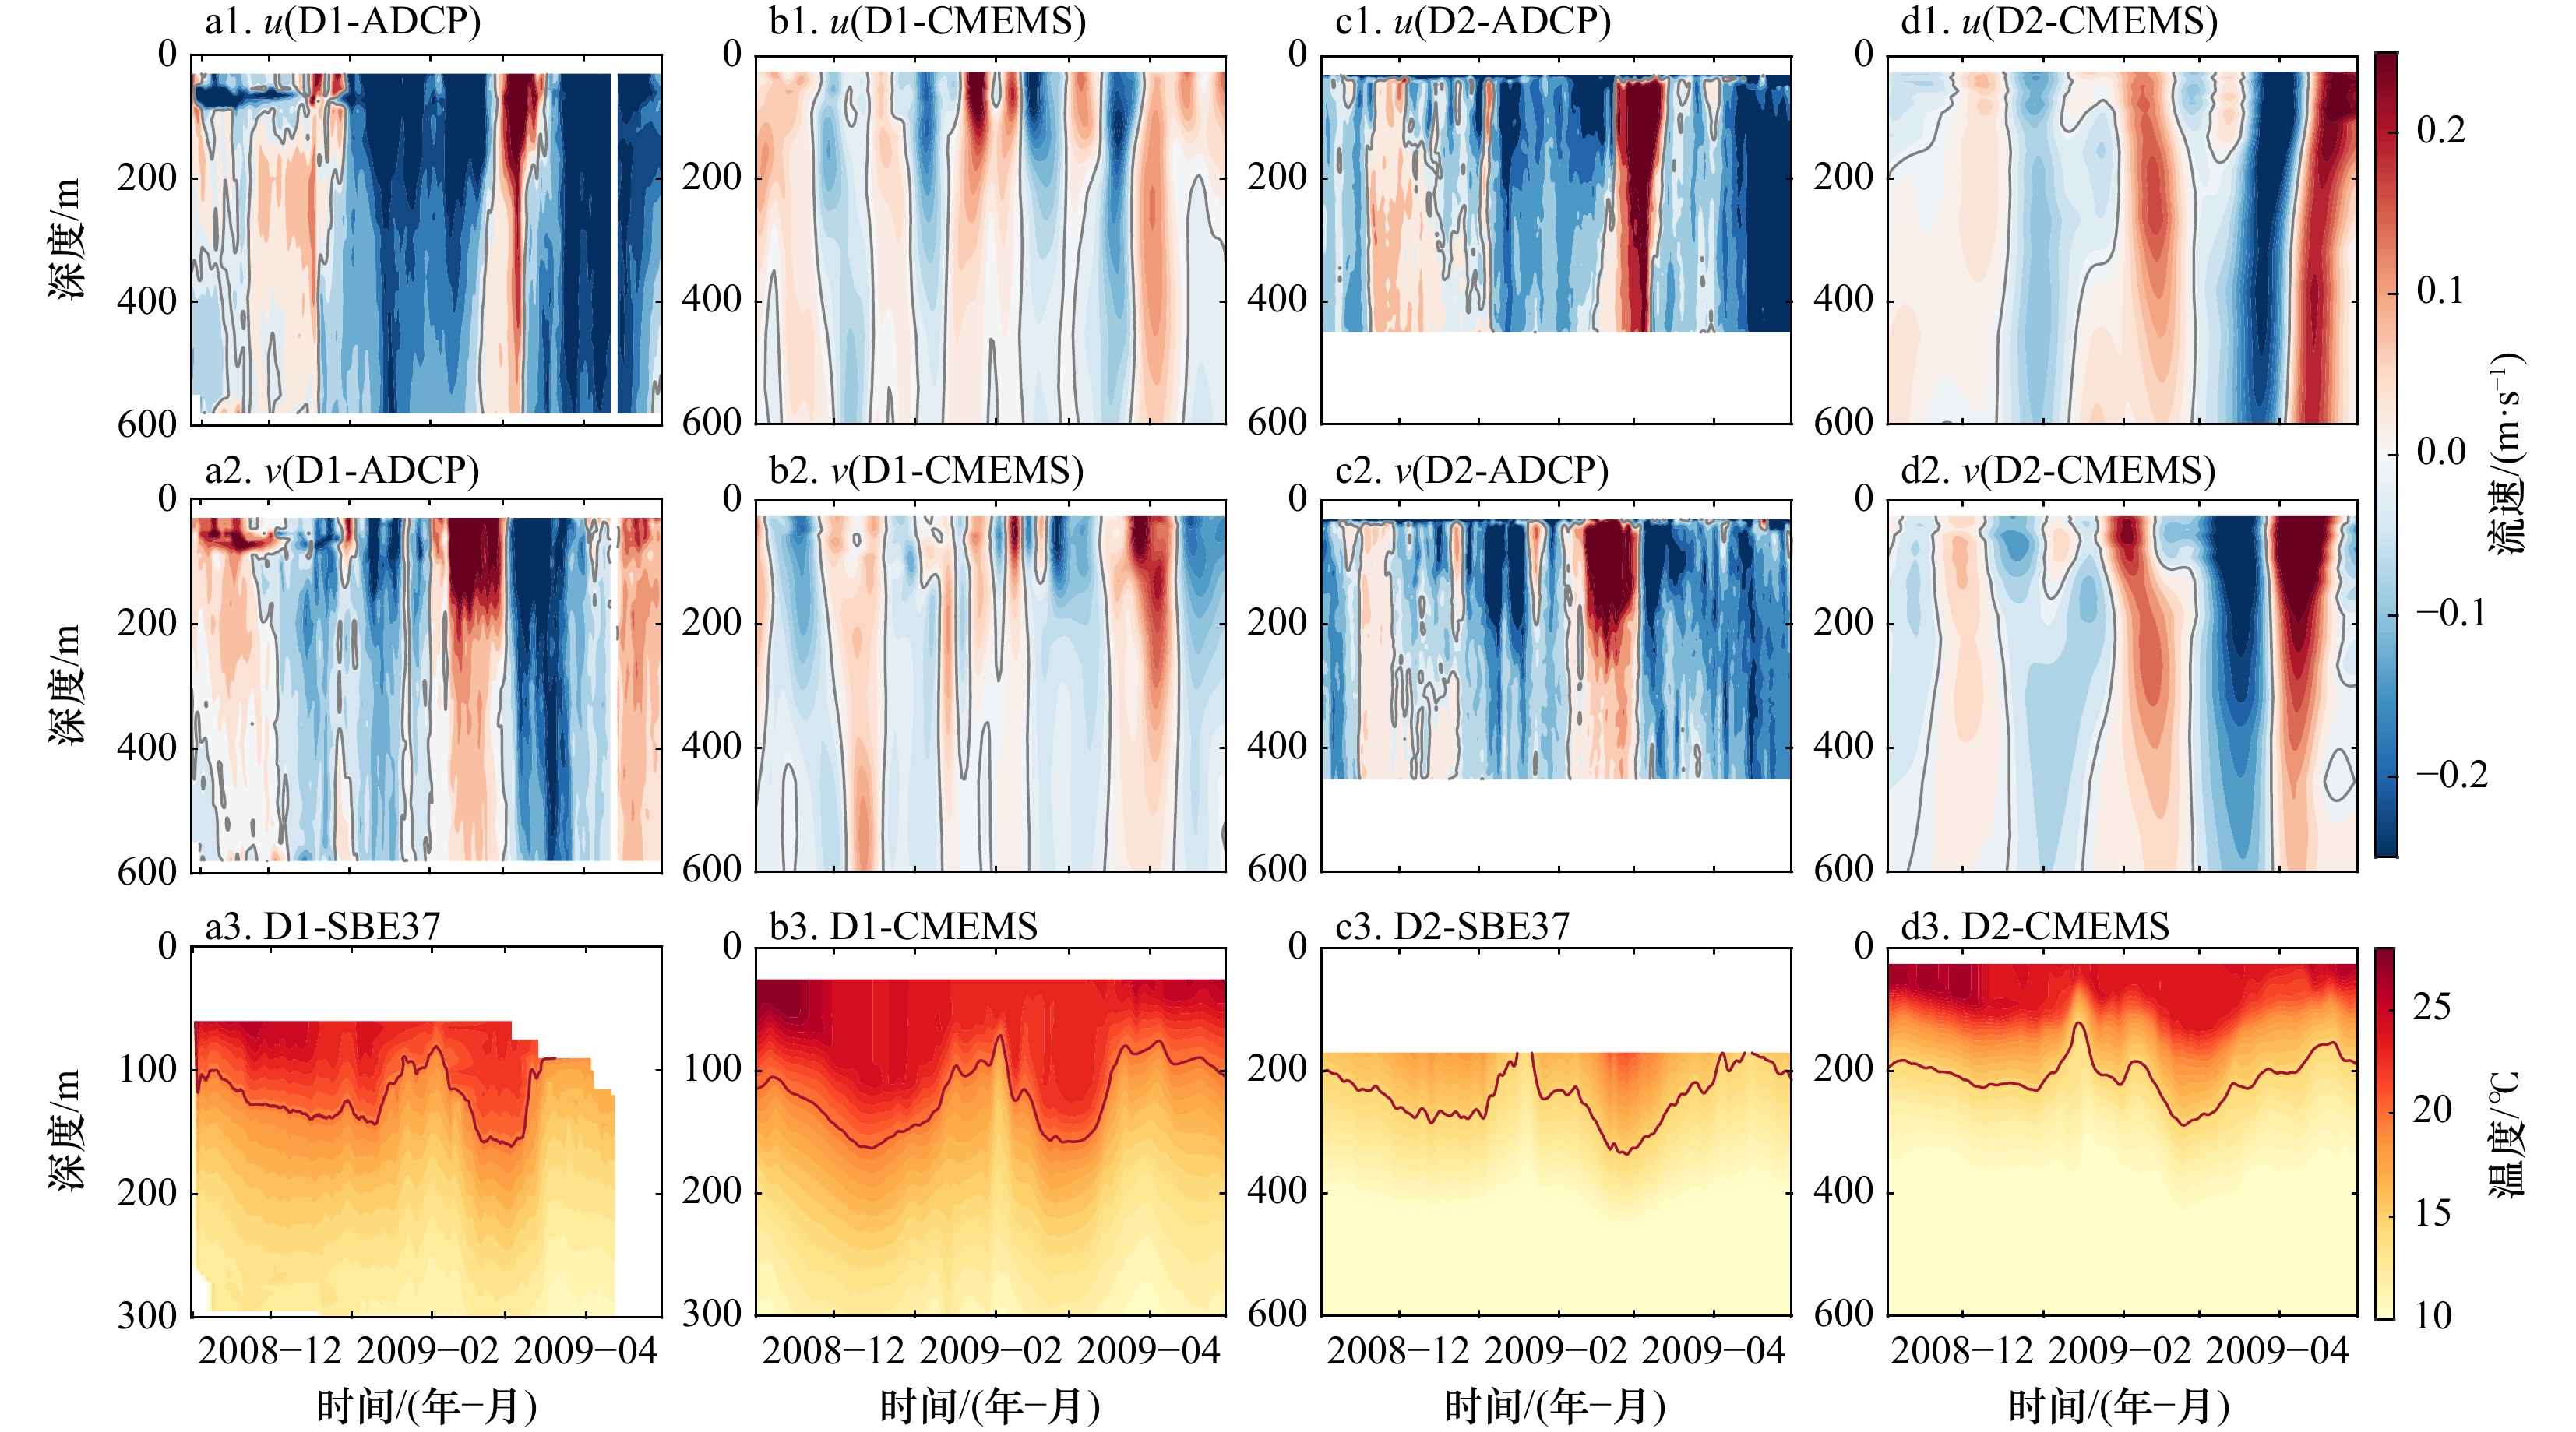
图 9 两个站位的潜标实测数据(a,c)与CMEMS再分析数据(b,d)对比
上层图(a1‒d1)为流速u的对比,中层图(a2‒d2)为流速v的对比,下层图(a3‒d3)为温度的对比;其中,a3与b3的等值线为20℃等值线,c3与d3的等值线为17℃等值线
Fig. 9 Comparison between the observed data of the two mooring stations (a, c) and CMEMS reanalysis data (b, d)
The upper figure (a1‒d1) are the comparison of u, the middle figure (a2‒d2) is the comparison of v, and the lower figure (a3‒d3) is the comparison of temperature. Among them, the contours of a3 and b3 are 20℃ contours, and the contours of c3 and d3 are 17℃ contours
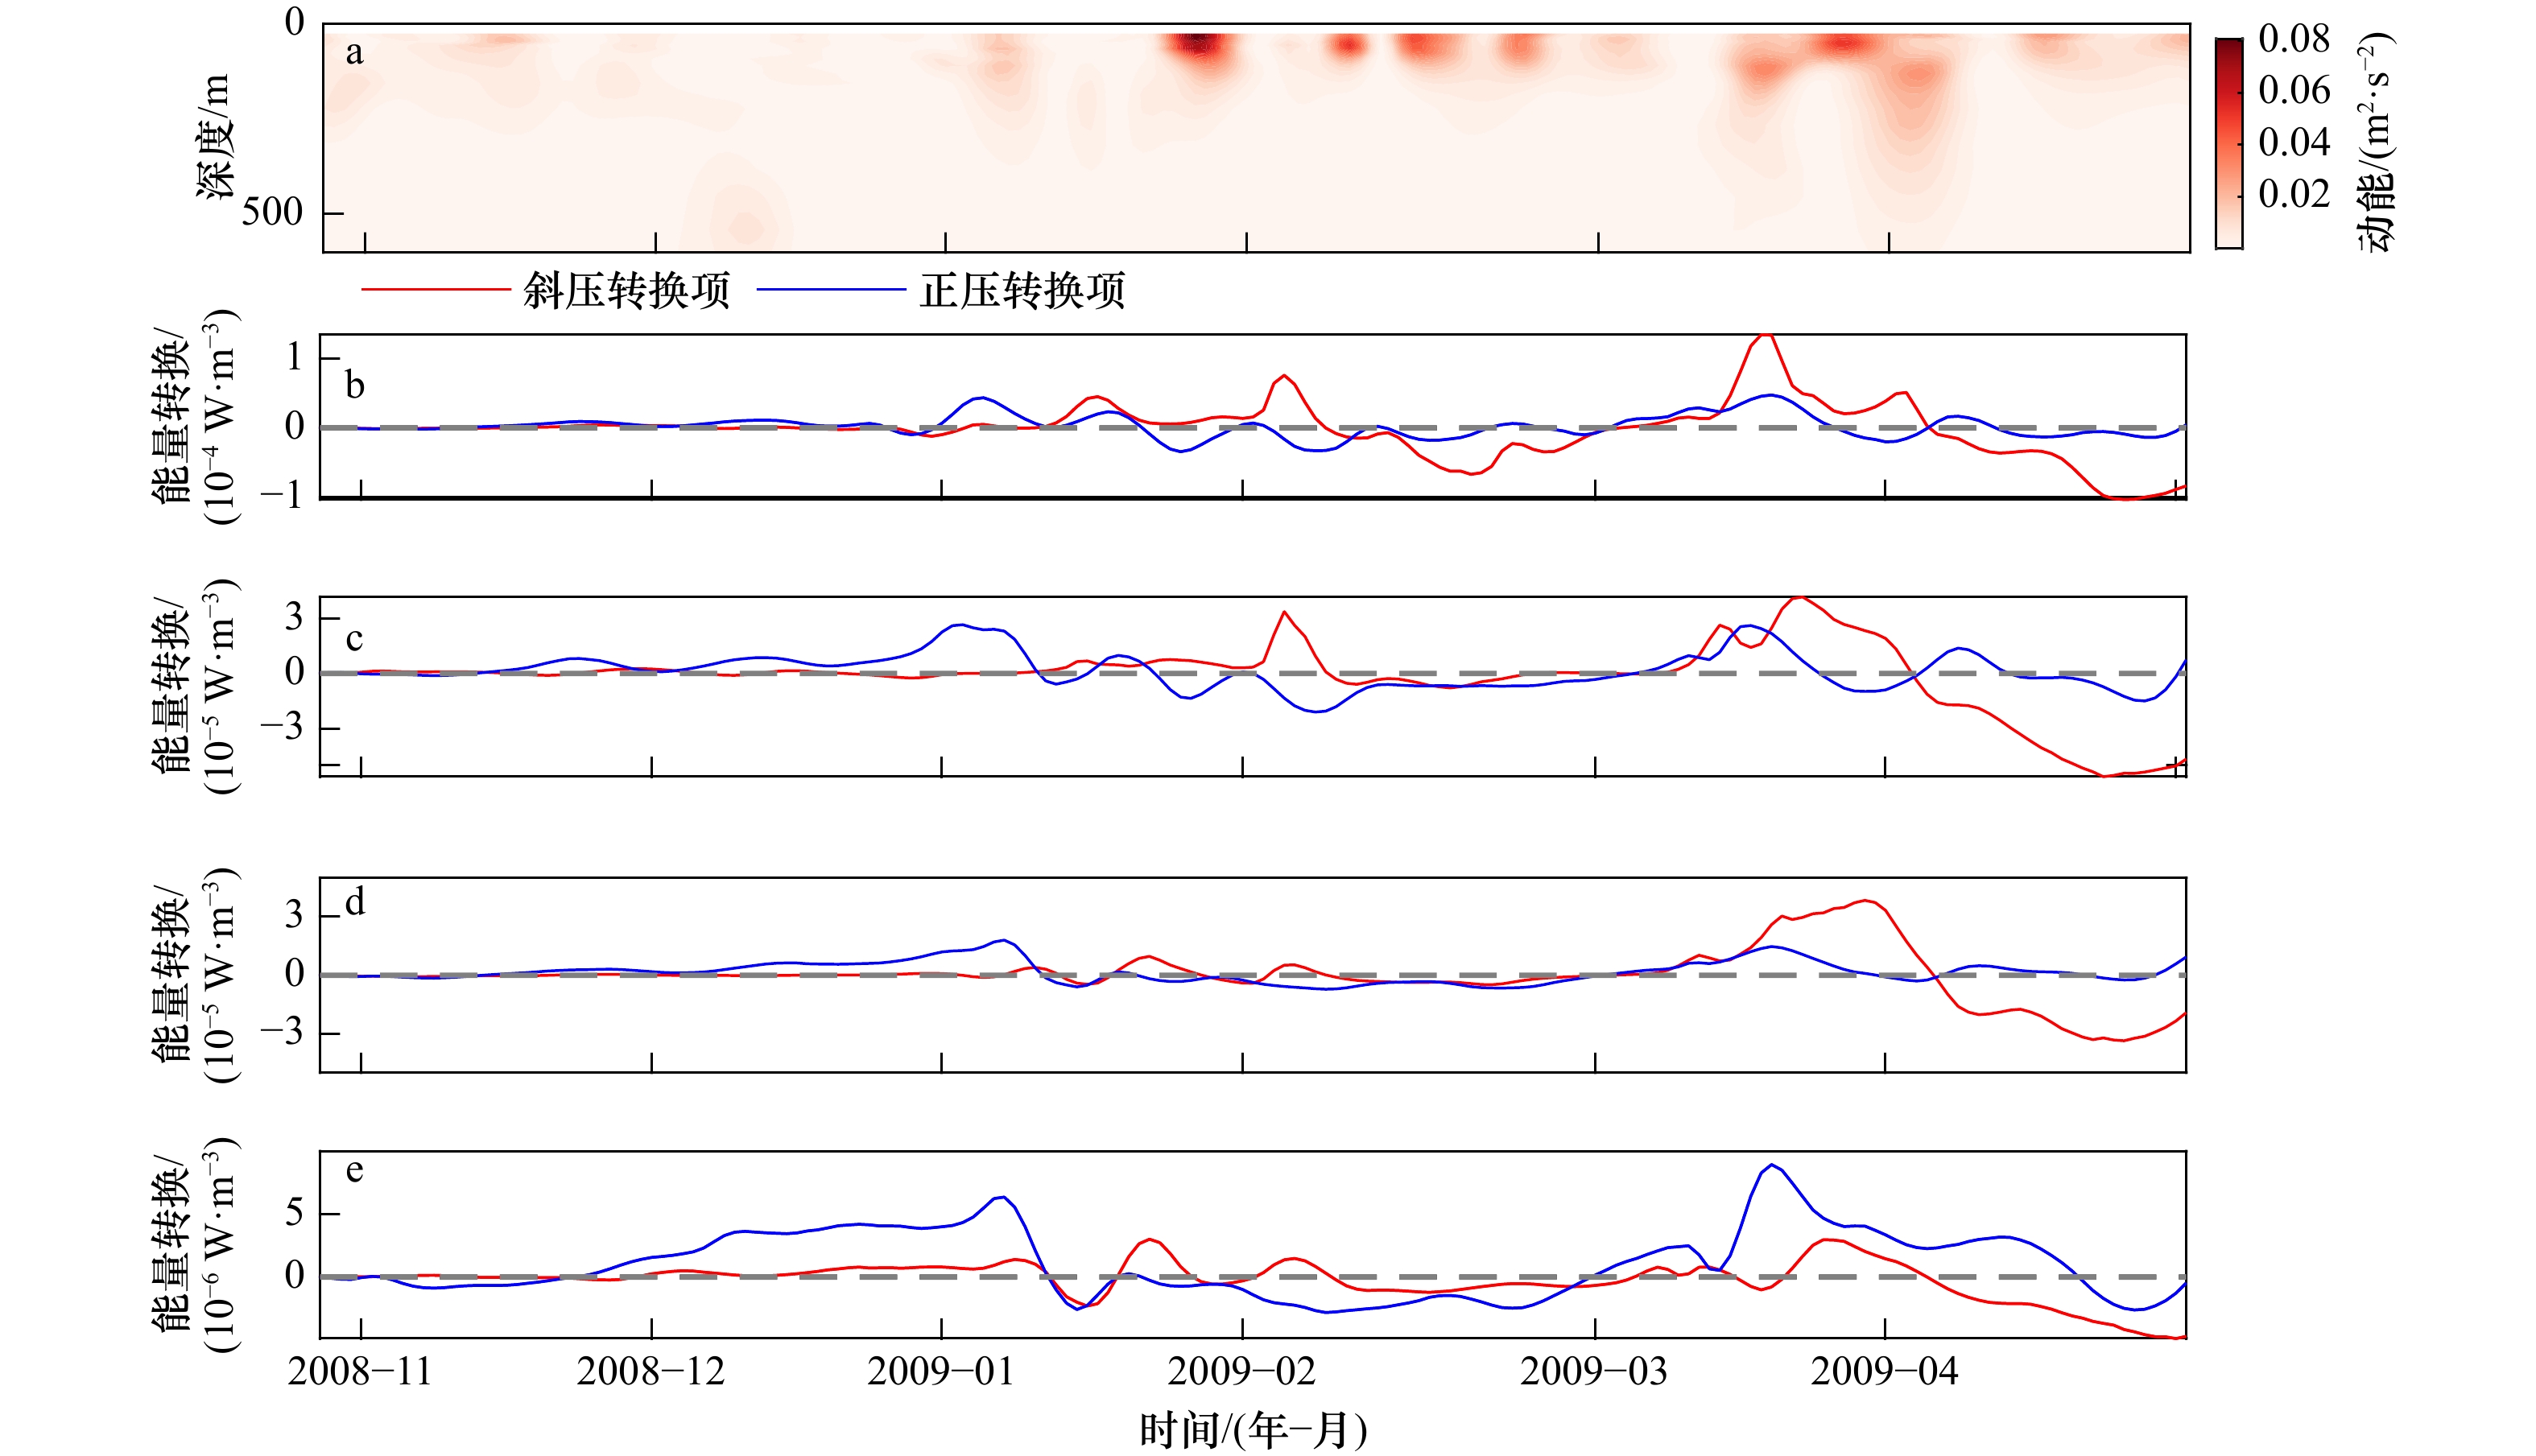
图 10 D1站位点CMEMS再分析数据的季节内动能和不同水深的斜压变换项与正压变换项时间序列,对应季节内变异周期为10~60 d
a. 季节内动能;b‒e. 不同水深的斜压变换项与正压变换项,分别为110 m、155 m、222 m、318 m
Fig. 10 The time series of intraseasonal kinetic energy and baroclinic transformation terms and barotropic transformation terms of different depths in CMEMS reanalysis data of Stations D1, corresponding to the intraseasonal period of 10‒60 days
a. Intraseasonal kinetic energy; b‒e. baroclinic transformation terms and barotropic transformation terms at respectively 110 m, 155 m, 222 m, 318 m
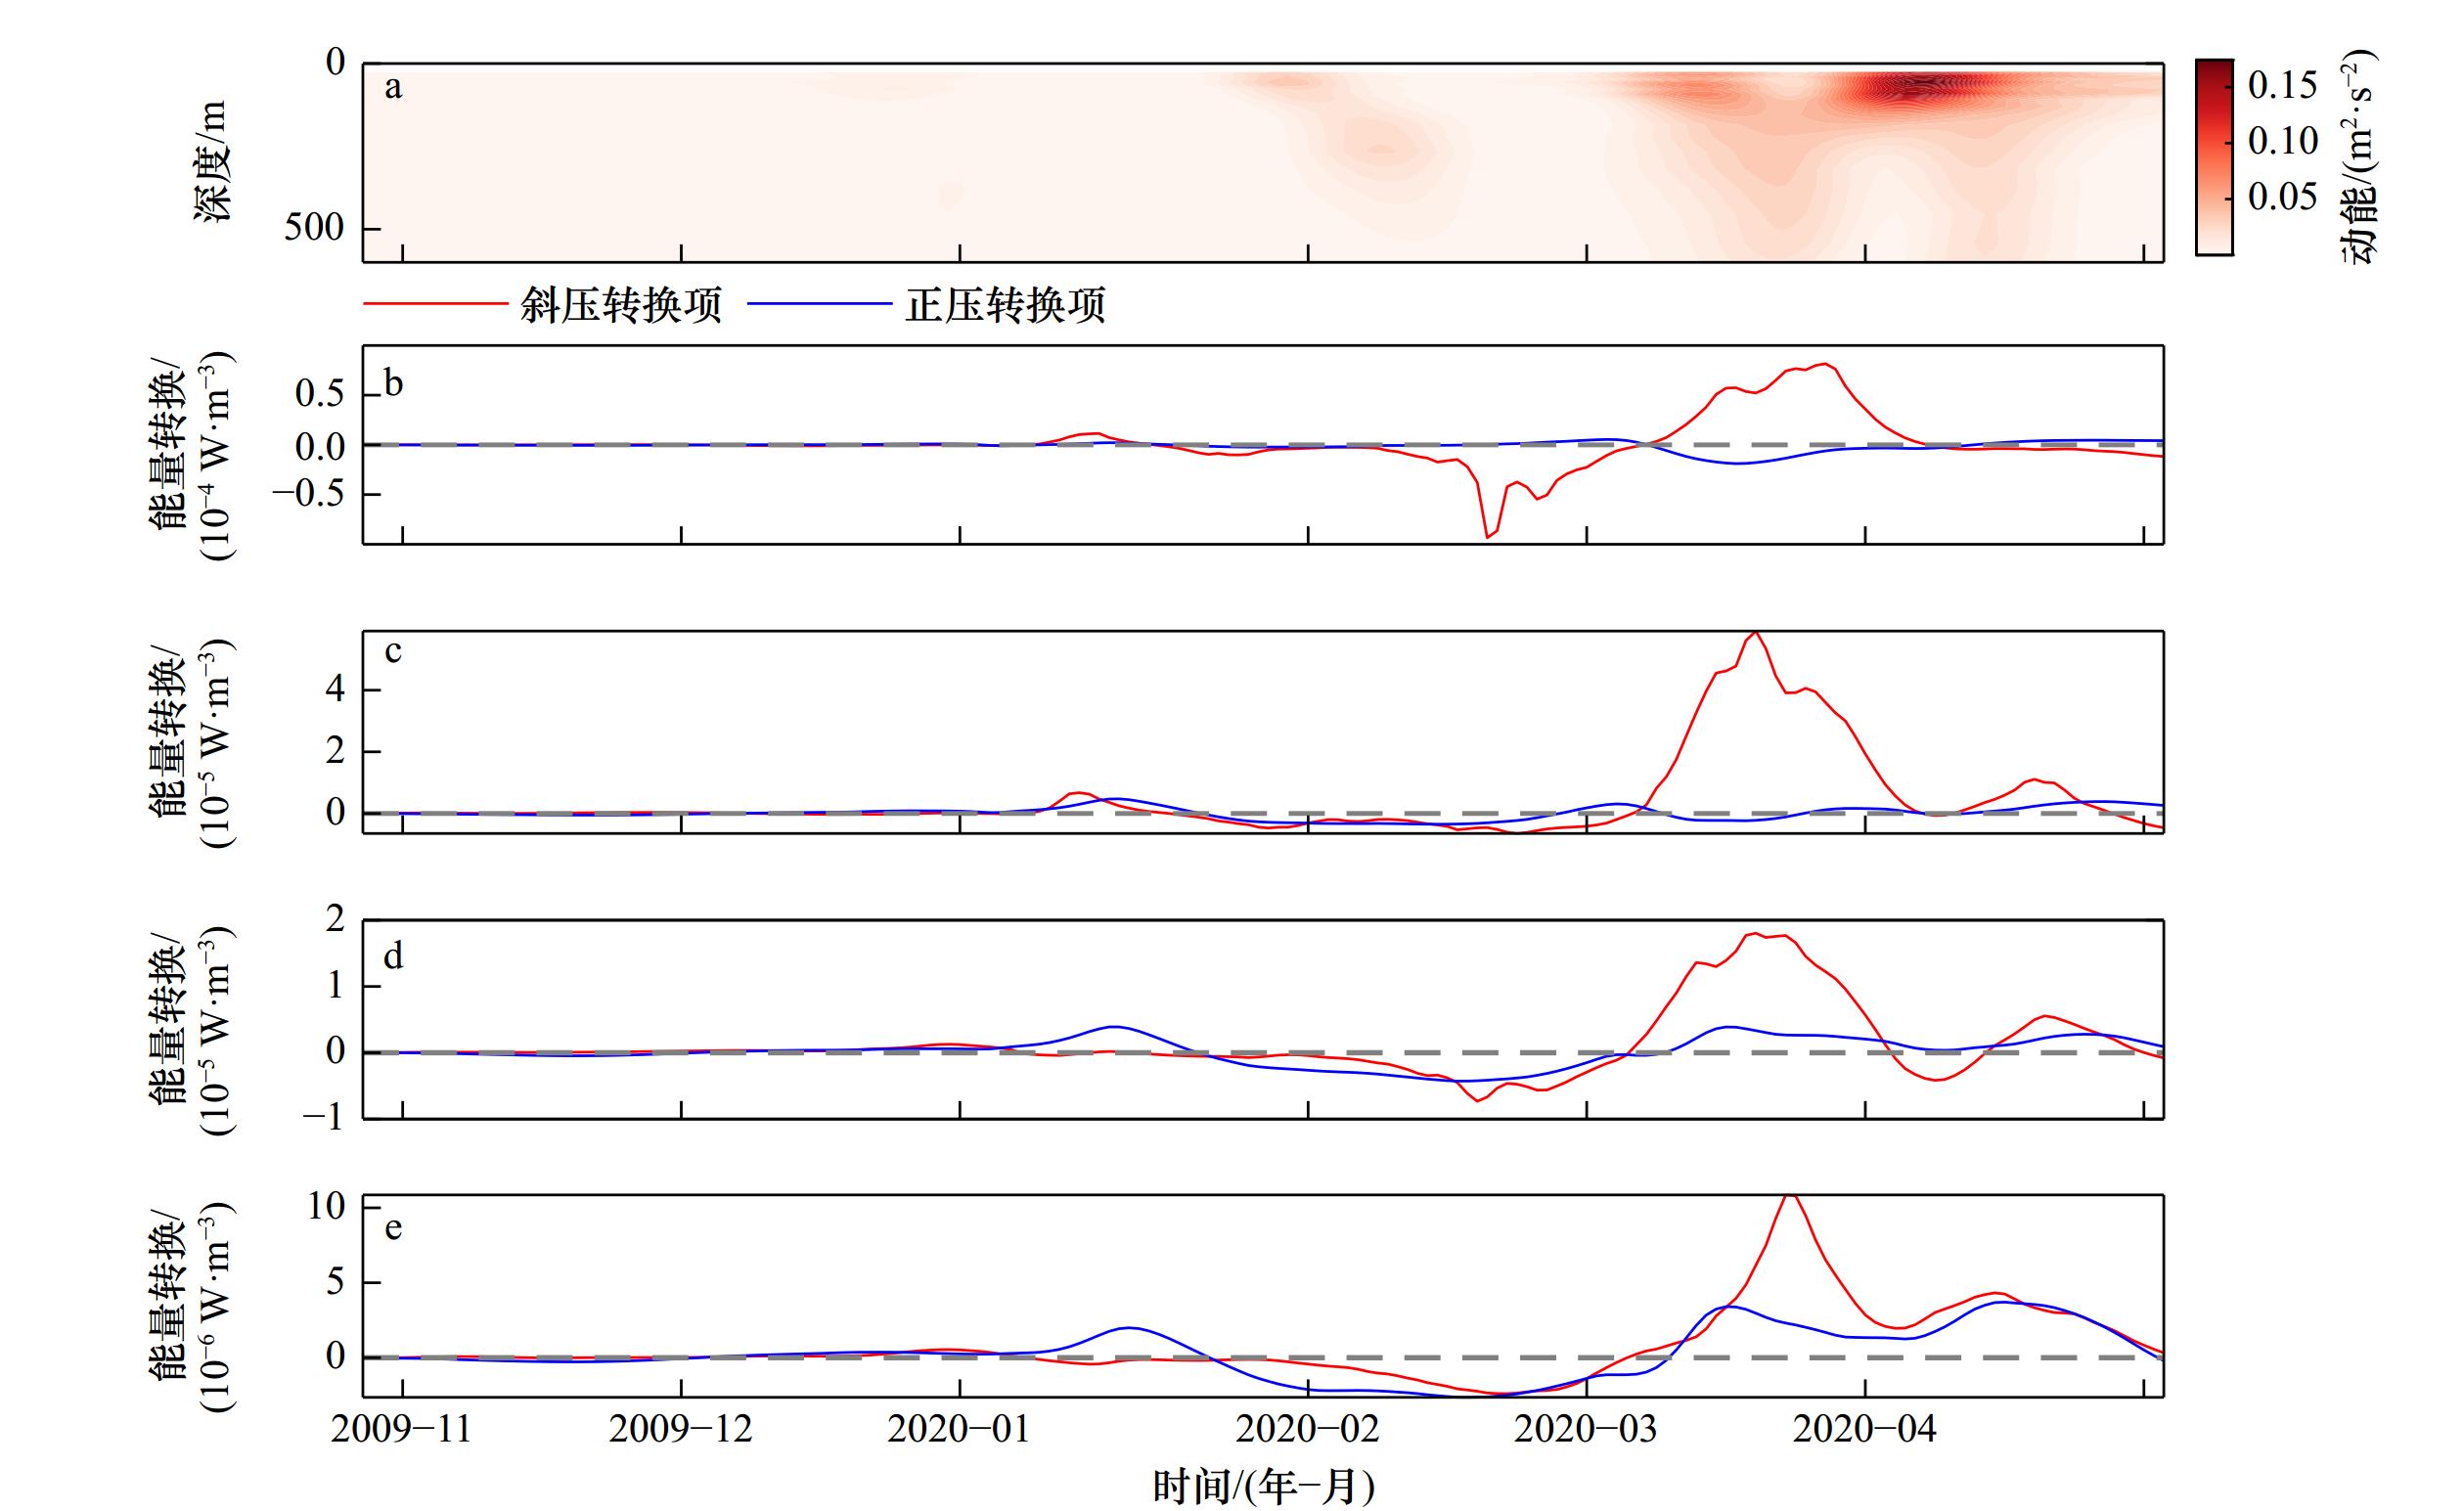
图 11 D2站位点CMEMS再分析数据的季节内动能和不同水深的斜压变换项与正压变换项时间序列,对应季节内变异周期为30~90 d
a. 季节内动能;b‒e. 不同水深的斜压变换项与正压变换项,分别为110 m、155 m、222 m、318 m
Fig. 11 The time series of intraseasonal kinetic energy and baroclinic transformation terms and barotropic transformation terms of different depths in CMEMS reanalysis data of Stations D2, corresponding to the intraseasonal period of 30‒90 days
a. Intraseasonal kinetic energy; b‒e. baroclinic transformation terms and barotropic transformation terms at respectively 110 m, 155 m, 222 m, 318 m
表 1 D1潜标的配置与记录情况
Tab. 1 Details of D1 instruments and recod
观测时间 观测仪器 观测范围/m 采样时长/min 2008年4‒10月 300k ADCP(向上) 8~104 10 75k ADCP(向下) 104~586 10 SBE37 76、106、136、166、226、256、316 10 2008年10月至2009年4月 300k ADCP(向上) 8~104 10 75k ADCP(向下) 104~584 10 SBE37 76、106、166、256、316 10 2009年4‒11月 300k ADCP(向上) 8~88 1 75k ADCP(向下) 88~600 1 SBE37 78、198、348 2 2009年11月至2010年5月 300k ADCP(向上) 8~128 1 75k ADCP(向下) 128~600 1 SBE37 107、225、371 2  下载: 导出CSV
表 2 D2潜标的配置与记录情况
Tab. 2 Details of D2 instruments and recod
观测时间 观测仪器 观测范围 /m 采样时长 /min 2019年5月至
2020年11月75k ADCP(向下) 10~450 60 SBE37 166、471、779、988 2
下载: 导出CSV
表 3 季节内流速与初始流速标准差之比
Tab. 3 The standard deviation of ratio of intraseasonal flow to initial flow
10~60 d 60~90 d 10~30 d 30~90 d D1‒150 m 0.414 4 / 0.556 7 0.510 3 / 0.600 9 / / D1‒250 m 0.334 4 / 0.541 5 0.848 8 / 0.902 1 / / D2‒150 m / / 0.306 2 / 0.306 2 0.649 1 / 0.851 5 D2‒250 m / / 0.265 8 / 0.322 5 0.632 4 / 0.702 4 注:行名为带通滤波的周期范围,表中左侧为纬向流的比值,右侧为经向流的比值,“/”表示没有进行相应周期带通滤波计算。
下载: 导出CSV
-
[1] Zhang Zhiwei, Zhao Wei, Tian Jiwei, et al. Spatial structure and temporal variability of the zonal flow in the Luzon Strait[J]. Journal of Geophysical Research: Oceans, 2015, 120(2): 759−776. doi: 10.1002/2014JC010308 [2] Hu Jianyu, Kawamura H, Hong Huasheng, et al. A review on the currents in the South China Sea: seasonal circulation, South China Sea warm current and Kuroshio intrusion[J]. Journal of Oceanography, 2000, 56(6): 607−624. doi: 10.1023/A:1011117531252 [3] Shu Yeqiang, Wang Qiang, Zu Tingting. Progress on shelf and slope circulation in the northern South China Sea[J]. Science China Earth Sciences, 2018, 61(5): 560−571. doi: 10.1007/s11430-017-9152-y [4] Wang Guihua, Wang Chunzai, Huang Ruixin. Interdecadal variability of the eastward current in the South China Sea associated with the summer Asian monsoon[J]. Journal of Climate, 2010, 23(22): 6115−6123. doi: 10.1175/2010JCLI3607.1 [5] Wyrtki K. Physical oceanography of the Southeast Asian waters[R]. Naga Report Scientific Results of Marine Investigations of the South China Sea & the Gulf of Thailand, California: ICAc Press, 1961. [6] Chen Xiao, Qiu Bo, Cheng Xuhua, et al. Intra-seasonal variability of Pacific-origin sea level anomalies around the Philippine Archipelago[J]. Journal of Oceanography, 2015, 71(3): 239−249. doi: 10.1007/s10872-015-0281-9 [7] FARRAR J T, WELLER R A. Intraseasonal variability near 10°N in the eastern tropical Pacific Ocean[J]. Journal of Geophysical Research: Atmospheres, 2006, 111(C5): C05015. [8] Roxy M, Tanimoto Y. Influence of sea surface temperature on the intraseasonal variability of the South China Sea summer monsoon[J]. Climate Dynamics, 2012, 39(5): 1209−1218. doi: 10.1007/s00382-011-1118-x [9] Yu Zhiyu, Potemra J T. Generation mechanism for the intraseasonal variability in the Indo-Australian basin[J]. Journal of Geophysical Research: Atmospheres, 2006, 111(C1): C01013. [10] Zhuang Wei, Xie Shangping, Wang Dongxiao, et al. Intraseasonal variability in sea surface height over the South China Sea[J]. Journal of Geophysical Research: Atmospheres, 2010, 115(C4): C04010. [11] Liang Zhanlin, Xie Qiang, Zeng Lili, et al. Role of wind forcing and eddy activity in the intraseasonal variability of the barrier layer in the South China Sea[J]. Ocean Dynamics, 2018, 68(3): 363−375. doi: 10.1007/s10236-018-1137-9 [12] Wang Qiang, Zhou Weidong, Zeng Lili, et al. Intraseasonal variability of cross-slope flow in the northern South China Sea[J]. Journal of Physical Oceanography, 2020, 50(7): 2071−2084. doi: 10.1175/JPO-D-19-0293.1 [13] Xu Wen, Shu Yeqiang, Wang Dongxiao, et al. Features of intraseasonal variability observed in the upper-layer current in the northern South China Sea[J]. Frontiers in Marine Science, 2021, 8: 777262. doi: 10.3389/fmars.2021.777262 [14] 王霞, 方文东, 陈荣裕. 南海北部海面高度的季节内变异及其传播特征[J]. 热带海洋学报, 2019, 38(3): 1−12.Wang Xia, Fang Wendong, Chen Rongyu. Intra-seasonal variability of sea level anomalies and their propagation features in the northern South China Sea from 25 years of satellite altimetry data[J]. Journal of Tropical Oceanography, 2019, 38(3): 1−12. [15] Yang Yikai, Zeng Lili, Wang Qiang. How much heat and salt are transported into the South China Sea by mesoscale eddies?[J]. Earth’s Future, 2021, 9(7): e2020EF001857. doi: 10.1029/2020EF001857 [16] Cheng Li, Zhang Zhiwei, Zhao Wei, et al. Temporal variability of the current in the northeastern South China Sea revealed by 2.5-year-long moored observations[J]. Journal of Oceanography, 2015, 71(4): 361−372. doi: 10.1007/s10872-015-0295-3 [17] Wang Fang, Li Yuanlong, Wang Jianing. Intraseasonal variability of the surface zonal currents in the western Tropical Pacific Ocean: characteristics and mechanisms[J]. Journal of Physical Oceanography, 2016, 46(12): 3639−3660. doi: 10.1175/JPO-D-16-0033.1 [18] Wang Qiang, Zeng Lili, Chen Ju, et al. The linkage of Kuroshio intrusion and mesoscale eddy variability in the northern South China Sea: Subsurface speed maximum[J]. Geophysical Research Letters, 2020, 47(11): e2020GL087034. doi: 10.1029/2020GL087034 [19] Chen Gengxin, Hou Yijun, Chu Xiaoqing. Mesoscale eddies in the South China Sea: Mean properties, spatiotemporal variability, and impact on thermohaline structure[J]. Journal of Geophysical Research: Oceans, 2011, 116(C6): C06018. [20] Hsin Y C, Qu Tangdong, Wu C R. Intra-seasonal variation of the Kuroshio southeast of Taiwan and its possible forcing mechanism[J]. Ocean Dynamics, 2010, 60(5): 1293−1306. doi: 10.1007/s10236-010-0294-2 [21] Xiu Peng, Chai Fei, Shi Lei, et al. A census of eddy activities in the South China Sea during 1993–2007[J]. Journal of Geophysical Research: Oceans, 2010, 115(C3): CO3012. [22] Yan Xiaomei, Kang Dujuan, Pang Chongguang, et al. Energetics analysis of the Eddy–Kuroshio interaction east of Taiwan[J]. Journal of Physical Oceanography, 2022, 52(4): 647−664. doi: 10.1175/JPO-D-21-0198.1 [23] Zhang Zhiwei, Zhao Wei, Qiu Bo, et al. Anticyclonic eddy Sheddings from Kuroshio loop and the accompanying cyclonic eddy in the northeastern South China Sea[J]. Journal of Physical Oceanography, 2017, 47(6): 1243−1259. doi: 10.1175/JPO-D-16-0185.1 [24] Wu C R, Chiang T L. Mesoscale eddies in the northern South China Sea[J]. Deep-Sea Research Part II: Topical Studies in Oceanography, 2007, 54(14/15): 1575−1588. [25] Zhao Yuhui, Yang Yang, Mao Longjiang, et al. On the genesis of the South China Sea mesoscale eddies[J]. Journal of Marine Science and Engineering, 2022, 10(2): 188. doi: 10.3390/jmse10020188 [26] 杨一凯, 曾丽丽. 挟带黑潮高盐水的中尺度涡在南海北部的时空特征[J]. 热带海洋学报, 2023, 42(3): 75−85. doi: 10.11978/2022152Yang Yikai, Zeng Lili. Spatiotemporal characteristics of mesoscale eddies with transport capability of saline Kuroshio water in the northern South China Sea[J]. Journal of Tropical Oceanography, 2023, 42(3): 75−85. doi: 10.11978/2022152 [27] 尚晓东, 徐驰, 陈桂英, 等. 海洋中尺度涡的机械能及其源汇研究[J]. 热带海洋学报, 2013, 32(2): 24−36.Shang Xiaodong, Xu Chi, Chen Guiying, et al. Review on mechanical energy of ocean mesoscale eddies and associated energy sources and sinks[J]. Journal of Tropical Oceanography, 2013, 32(2): 24−36. [28] 王东晓, 邱春华, 舒业强, 等. 南海环流多尺度动力过程演变特征与机制研究进展[J]. 海洋科学进展, 2022, 40(4): 605−623.Wang Dongxiao, Qiu Chunhua, Shu Yeqiang, et al. Progress in the dynamic process and mechanisms of multi-scale currents in the South China Sea[J]. Advances in Marine Science, 2022, 40(4): 605−623. [29] Zhong Qingwen, Chen Gengxin, Li Yuanlong, et al. Intraseasonal variability of the surface zonal current in the equatorial Indian Ocean: Seasonal differences and causes[J]. Acta Oceanologica Sinica, 2022, 41(5): 12−26. doi: 10.1007/s13131-021-1935-7 [30] Brum A L, De Azevedo J L L, Dengler M. Energetics of eddy–mean flow interactions in the deep western boundary current off the northeastern coast of Brazil[J]. Deep-Sea Research Part I: Oceanographic Research Papers, 2023, 193: 103965. doi: 10.1016/j.dsr.2023.103965 [31] Lian Zhan, Sun Baonan, Wei Zexun, et al. Comparison of eight detection algorithms for the quantification and characterization of mesoscale eddies in the South China Sea[J]. Journal of Atmospheric and Oceanic Technology, 2019, 36(7): 1361−1380. doi: 10.1175/JTECH-D-18-0201.1 [32] Zhang Zhiwei, Zhao Wei, Tian Jiwei, et al. A mesoscale eddy pair southwest of Taiwan and its influence on deep circulation[J]. Journal of Geophysical Research: Oceans, 2013, 118(12): 6479−6494. doi: 10.1002/2013JC008994 [33] Geng Wu, Xie Qiang, Chen Gengxin, et al. Numerical study on the eddy–mean flow interaction between a cyclonic eddy and Kuroshio[J]. Journal of Oceanography, 2016, 72(5): 727−745. doi: 10.1007/s10872-016-0366-0 -

计量
- 文章访问数: 385
- HTML全文浏览量: 231
- PDF下载量: 62
- 被引次数: 0
