

Variational method of ocean three-dimensional thermohaline structure and its acoustic performance evaluation
-
摘要: 基于卫星海面观测重构水下三维温盐场并获取声场特性的研究,在军事海洋等领域具有重要的实践应用价值,但其效果不但受到重构方法的影响,而且随所利用的卫星海面观测信息的不同而改变。本研究基于美国海军最新研发的利用变分法的温盐场重构,研究了利用卫星海面高度、海面温度或二者联合数据,及考虑温盐垂向梯度对重构三维温盐及声场特性的影响。结果发现,集合了海表温度、海表高度和温盐垂直梯度3个约束项的重构方案精度最高,其重构温度场和盐度场的平均误差分别为1.08℃、0.11,该方案也能更好地捕捉温盐场的空间特征。通过分析不同方案的空间特征,海面温度主要作用于捕捉混合层以浅区域的温盐特征,这对表面声学层(Sound Layer Depth, SLD)的影响较大;海面高度和温盐场的垂直梯度对混合层以深区域的反演精度都有较高提升,能够影响整个声速剖面的准确性。根据声学特征分析, SST、SSH与温盐垂直梯度同时约束时,SLD以浅声速与HYCOM相差最小,约为1 m/s;没有梯度约束时,SLD与HYCOM相差约为1.5 m/s,未能很好地反映海表面声道特征;表明声道特征对海表温度与梯度约束均较为敏感。Abstract: Research on the reconstruction of underwater three-dimensional temperature and salinity fields and the acquisition of acoustic field characteristics based on satellite sea surface observations has significant practical value in military oceans and other fields. However, its effectiveness not only depends on the reconstruction method but also changes with different sea surface observations used. Although there are few reports on related research, it has significant guiding value for the design of satellite sea surface observation schemes. In this study, based on the latest variational method applied by the US Navy, the influence of the vertical gradient of temperature and salinity and the sea surface height, sea surface temperature, and their joint use on the reconstruction of three-dimensional temperature and salinity and acoustic field characteristics were investigated. The results showed that the reconstruction scheme incorporating the three constraint items had the highest accuracy, with average reconstruction errors of 1.08℃ for temperature field and 0.11 for salinity field, and could better capture the spatial features of the temperature and salinity fields. By analyzing the spatial characteristics of different schemes, the sea surface temperature mainly plays a role in capturing the temperature and salinity characteristics of the shallow region of the mixing layer, which has a great influence on the Sound Layer Depth (SLD). Both the sea surface height and the vertical gradient of warm salt field can improve the inversion accuracy of mixed layer and deep area, which can affect the accuracy of the whole sound velocity profile. According to the analysis of acoustic characteristics, when SST, SSH, and the gradient were constrained simultaneously, the SLD had the smallest difference from HYCOM in the shallow sound speed, which was about 1 m/s. When there was no gradient constraint, the SLD differed significantly from HYCOM and failed to reflect the surface duct characteristics. It can be seen that the surface duct is more sensitive to sea surface temperature and gradient constraints.
-
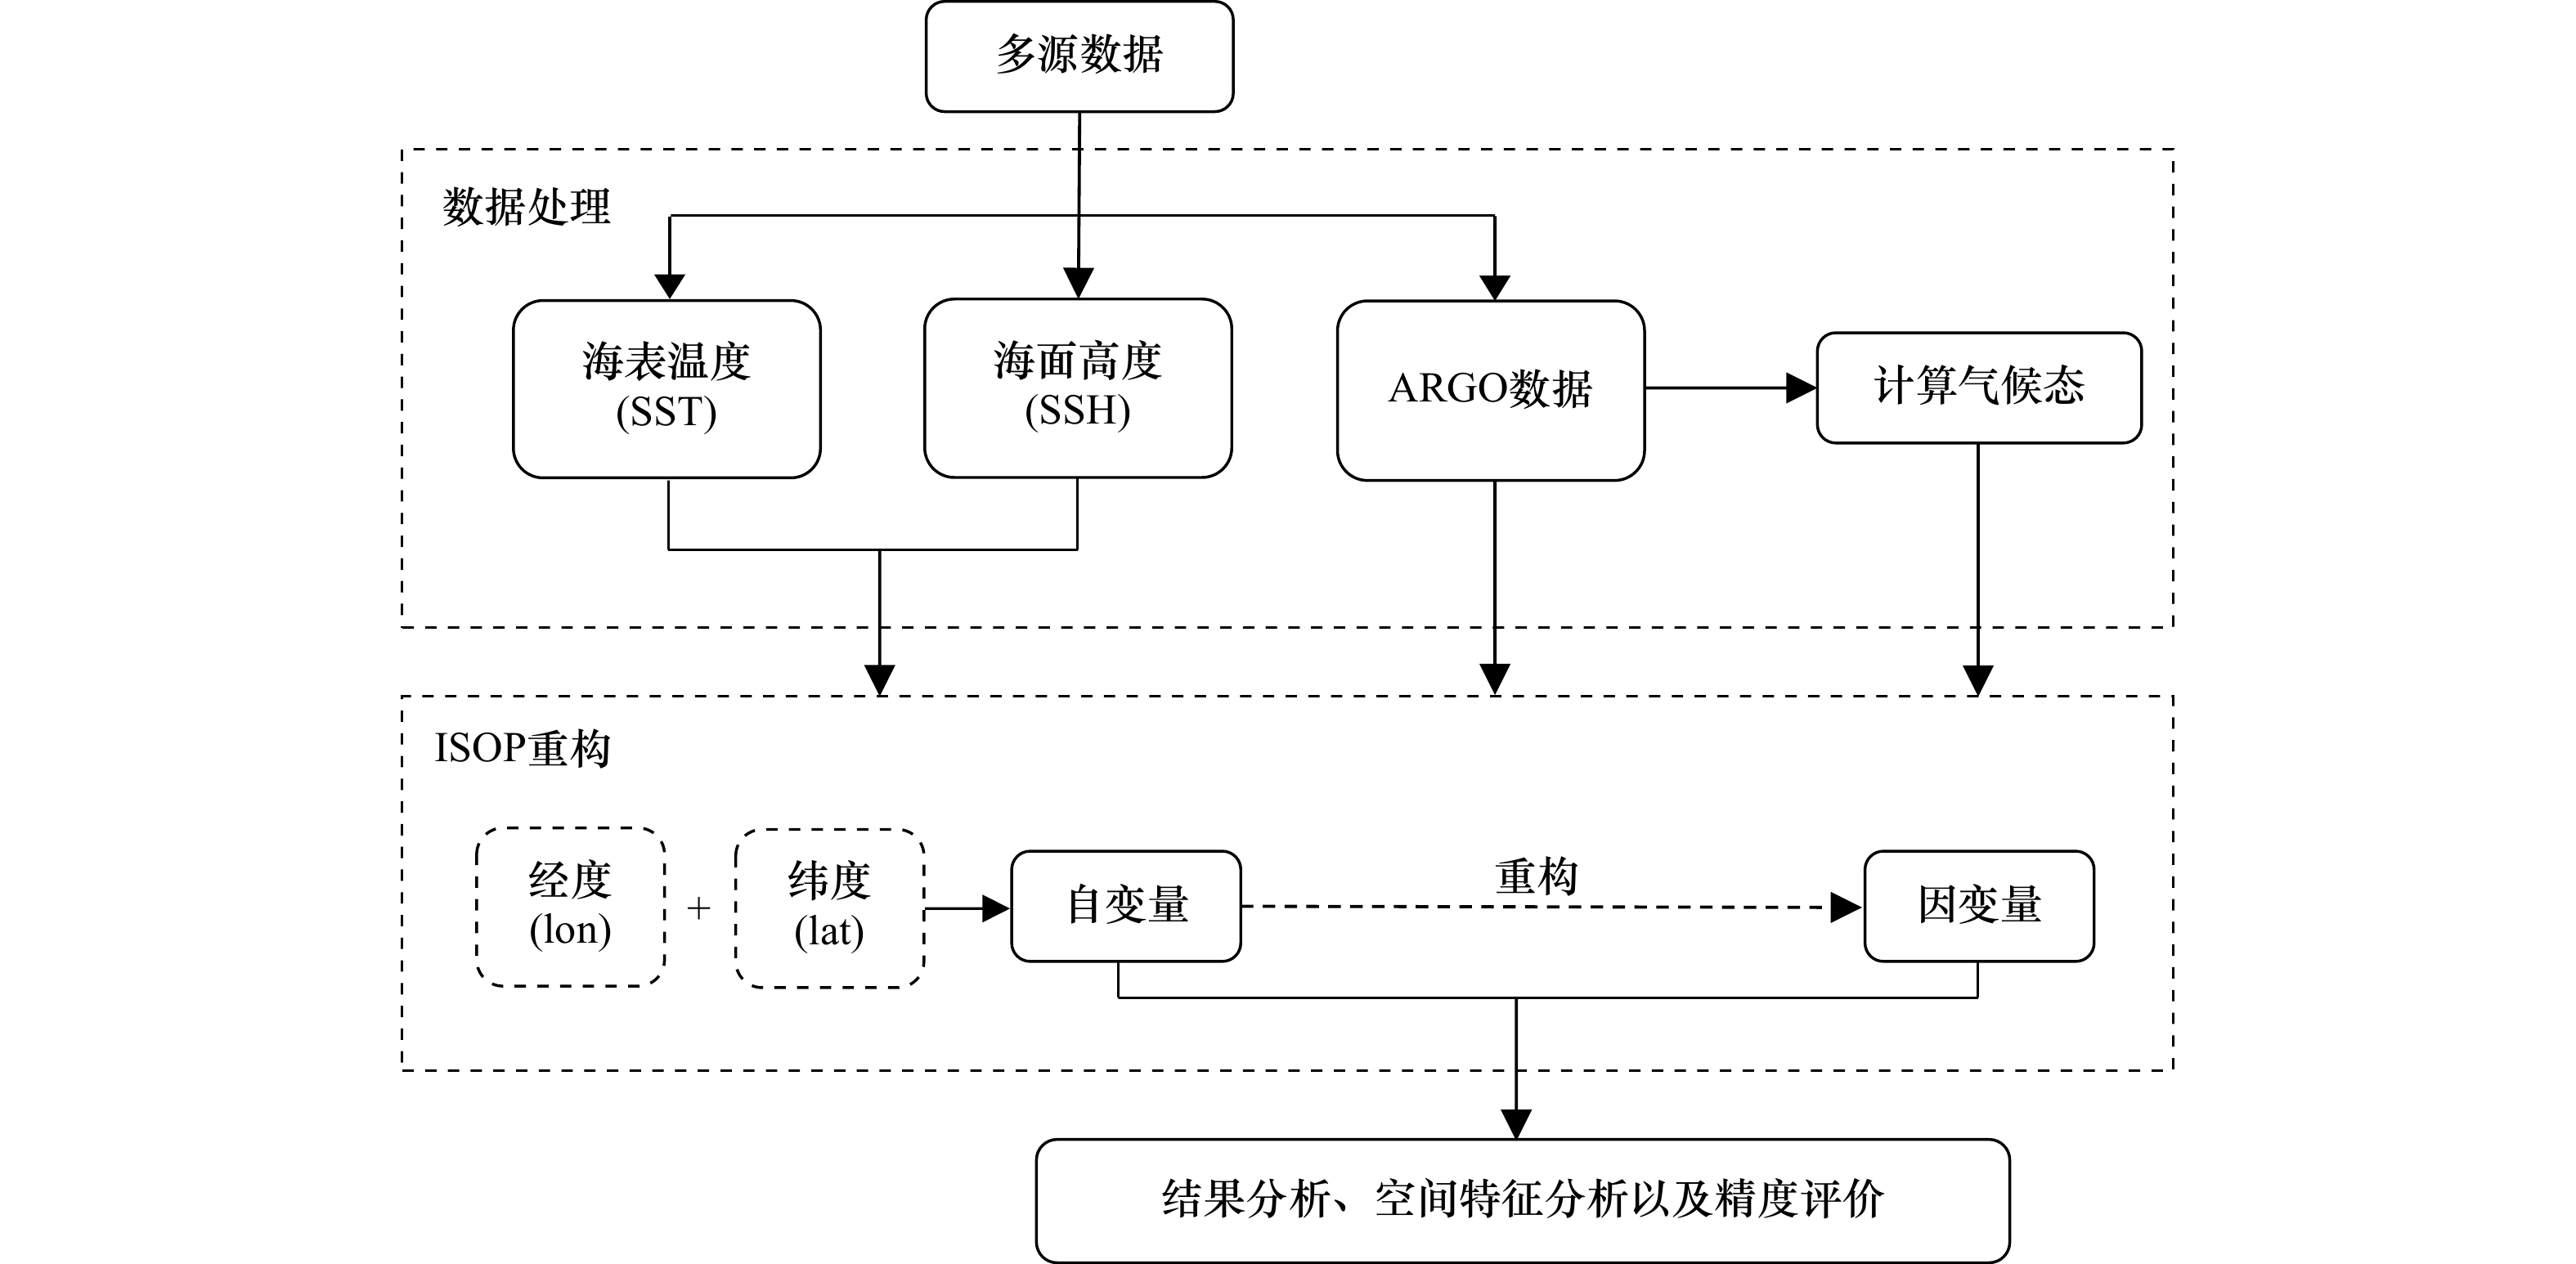
图 1 卫星海面观测三维温盐场重建及评估的具体流程图
Fig. 1 The specific flow chart of reconstruction of three-dimensional temperature and salinity field and its assessment using satellite sea surface observations
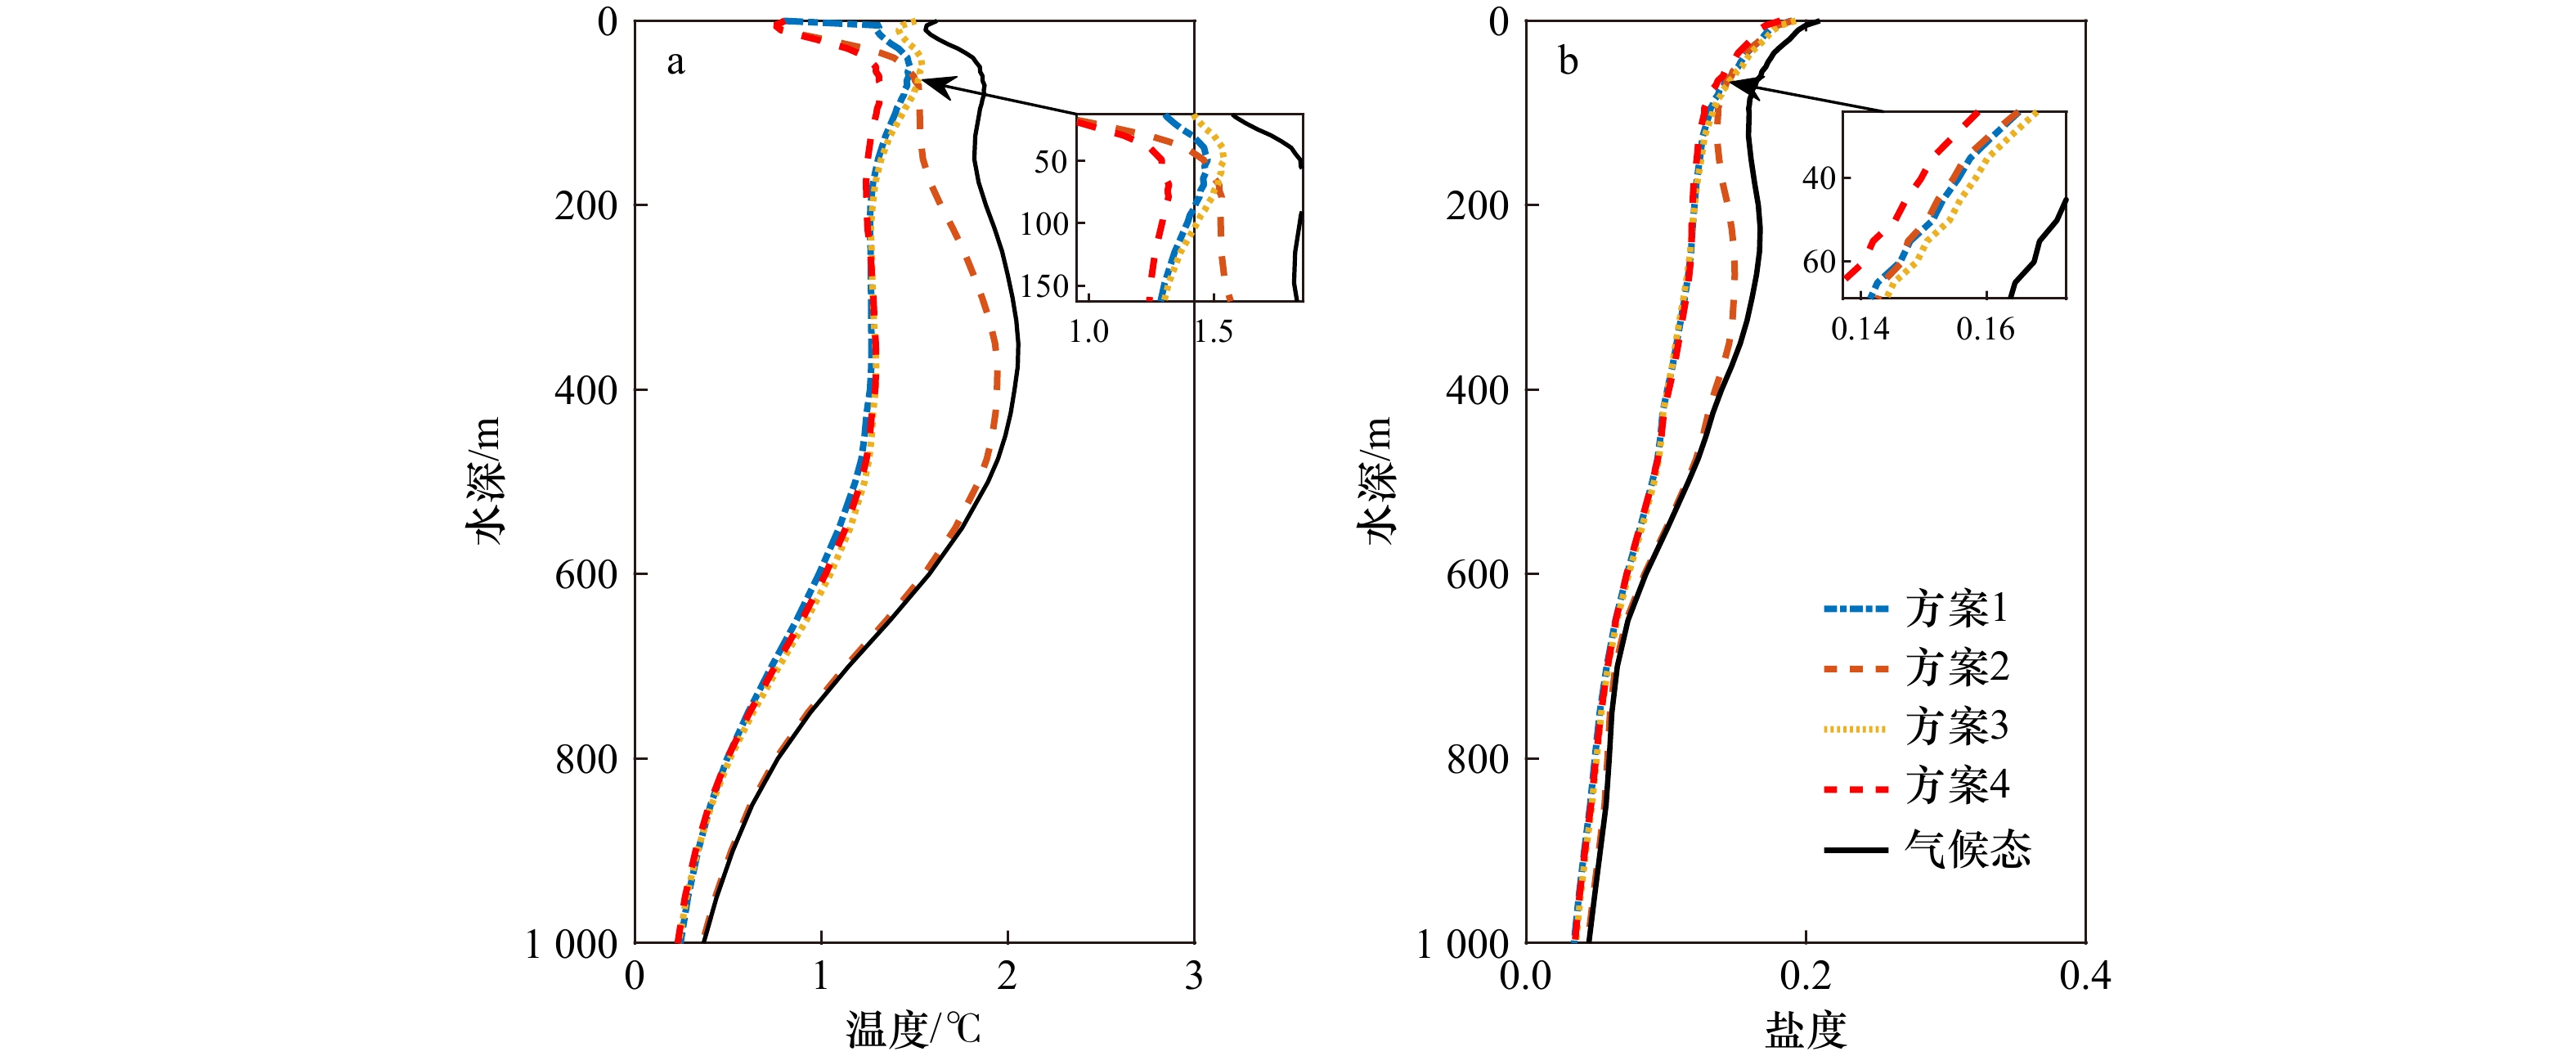
图 2 4种重构方案与Argo观测均方根误差对比
Fig. 2 Comparison of the root mean square error (RMSE) of the four reconstruction schemes with Argo observations

图 3 4种重构方案与Argo观测数据平方相关系数对比
Fig. 3 Comparison of the square correlation coefficient of the four reconstruction schemes with Argo observations

图 4 温度垂直断面对比
a: HYCOM;b: 方案1;c: 方案2;d: 方案3;e: 方案4
Fig. 4 Comparison of vertical sections of temperature
a: HYCOM; b: Scheme 1; c: Scheme 2; d: Scheme 3; e: Scheme 4
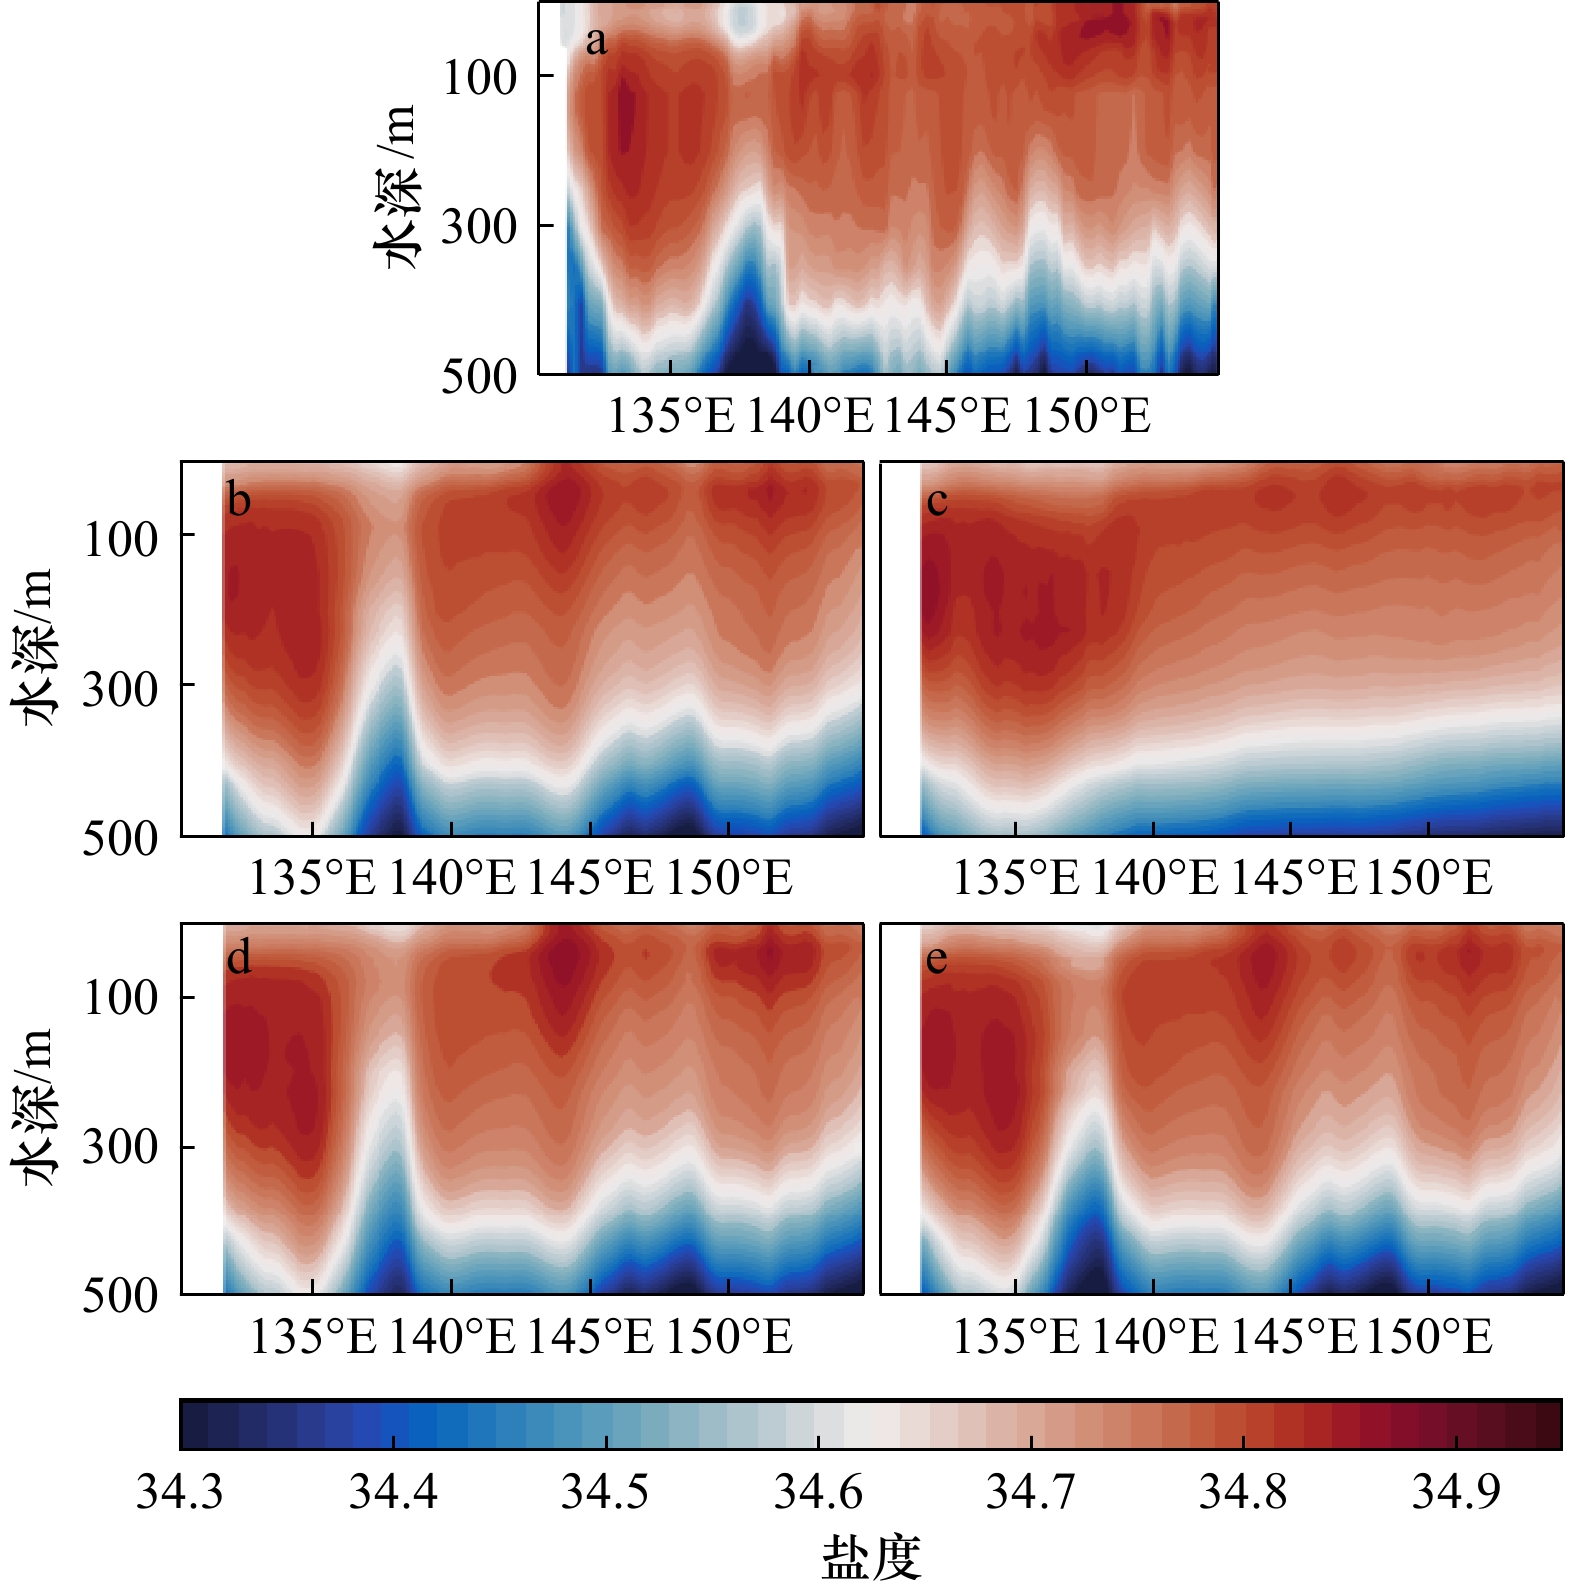
图 5 盐度垂直断面对比
a: HYCOM;b: 方案1;c: 方案2;d: 方案3;e: 方案4
Fig. 5 Comparison of vertical sections of salinity
a: HYCOM; b: Scheme 1; c: Scheme 2; d: Scheme 3; e: Scheme 4

图 8 2019年9月20日温盐垂直断面对比
a: HYCOM;b: 方案1;c: 方案2;d: 方案3;e: 方案4
Fig. 8 Comparison of vertical sections of temperature and salinity on September 20, 2019
a: HYCOM; b: Scheme 1; c: Scheme 2; d: Scheme 3; e: Scheme 4

图 6 2019年3月20日温盐垂直断面对比
a: HYCOM;b: 方案1;c: 方案2;d: 方案3;e: 方案4
Fig. 6 Comparison of vertical sections of temperature and salinity on March 20, 2019
a: HYCOM; b: Scheme 1; c: Scheme 2; d: Scheme 3; e: Scheme 4

图 7 2019年6月20日温盐垂直断面对比
a: HYCOM;b: 方案1;c: 方案2;d: 方案3;e: 方案4
Fig. 7 Comparison of vertical sections of temperature and salinity on June 20, 2019
a: HYCOM; b: Scheme 1; c: Scheme 2; d: Scheme 3; e: Scheme 4

图 9 100 m、500 m、900 m深度处方案4和HYCOM模式数据的温盐度切面对比
Fig. 9 Comparison of temperature and salinity sections at depths of 100 m, 500 m and 900 m for Scheme 4 and HYCOM model data

图 10 4种方案的反演数据与WOA18以及HYCOM数据计算的声速剖面对比
Fig. 10 Comparison of the sound velocity profiles calculated from the inversion data of the four schemes and WOA18 and HYCOM data

图 11 声传播损失场(0~30 km)
a: HYCOM;b: 方案1;c: 方案2;d: 方案3;e: 方案4
Fig. 11 acoustic wave transmission loss field (0−30 km)
a: HYCOM; b: Scheme 1; c: Scheme 2; d: Scheme 3; e: Scheme 4
表 1 4种研究方案及其主要约束条件
Tab. 1 Four research schemes and their main constraints
方案 主要约束条件 表达式 方案1 SST + SSH J = J1 + J3 + J5 + J7 + J9 + J10 方案2 SST + Grad J = J1 + J2 + J3 + J4 + J5 + J6 + J7 + J8 + J9 方案3 SSH + Grad J = J1 + J2 + J3 + J4 + J5 + J6 + J7 + J8 + J10 方案4 SST + SSH + Grad J = J1 + J2 + J3 + J4 + J5 + J6 + J7 + J8 + J9 + J10  下载: 导出CSV
-
[1] 赖积保, 康旭东, 鲁续坤, 等. 新一代人工智能驱动的陆地观测卫星遥感应用技术综述[J]. 遥感学报, 2022, 26(8): 1530−1546. doi: 10.11834/j.issn.1007-4619.2022.8.ygxb202208004Lai Jibao, Kang Xudong, Lu Xukun, et al. A review of land observation satellite remote sensing application technology with new generation artificial intelligence[J]. National Remote Sensing Bulletin, 2022, 26(8): 1530−1546. doi: 10.11834/j.issn.1007-4619.2022.8.ygxb202208004 [2] 汪文杰, 贾东宁, 许佳立, 等. 全球海洋遥感卫星发展综述[J]. 测绘通报, 2020(5): 1−6.Wang Wenjie, Jia Dongning, Xu Jiali, et al. Review of the development of global marine remote sensing satellite[J]. Bulletin of Surveying and Mapping, 2020(5): 1−6. [3] 张庆君. 面向碳综合治理的卫星海洋遥感体系展望[J]. 前瞻科技, 2022, 1(1): 126−145.Zhang Qingjun. Prospect of satellite ocean remote sensing system for comprehensive carbon management[J]. Science and Technology Foresight, 2022, 1(1): 126−145. [4] Cooper M, Haines K. Altimetric assimilation with water property conservation[J]. Journal of Geophysical Research: Oceans, 1996, 101(C1): 1059−1077. doi: 10.1029/95JC02902 [5] Fiedler P C. Surface manifestations of subsurface thermal structure in the California current[J]. Journal of Geophysical Research: Oceans, 1988, 93(C5): 4975−4983. doi: 10.1029/JC093iC05p04975 [6] 王喜冬. 西北太平洋三维温盐场重构及其应用[D]. 广州: 中国科学院南海海洋研究所, 2011.Wang Xidong. Reconstruction of three-dimensional temperature and salinity fields and their applications in Northwest Pacific[D]. Guangzhou: South China Sea Institute of Oceanology, Chinese Academy of Sciences, 2011. [7] Ali M M, Swain D, Weller R A. Estimation of ocean subsurface thermal structure from surface parameters: a neural network approach[J]. Geophysical Research Letters, 2004, 31(20): L20308. [8] Wu Xiangbai, Yan Xiaohai, Jo Y H, et al. Estimation of subsurface temperature anomaly in the north Atlantic using a self-organizing map neural network[J]. Journal of Atmospheric and Oceanic Technology, 2012, 29(11): 1675−1688. doi: 10.1175/JTECH-D-12-00013.1 [9] Fujii Y, Kamachi M. A reconstruction of observed profiles in the sea east of Japan using vertical coupled temperature-salinity EOF modes[J]. Journal of Oceanography, 2003, 59(2): 173−186. doi: 10.1023/A:1025539104750 [10] Helber R W, Townsend T L, Barron C N, et al. Validation test report for the improved synthetic ocean profile (ISOP) system, part I: synthetic profile methods and algorithm[J]. Naval Research Laboratory, 2013, 7320−13−9364. [11] He Zikang, Wang Xidong, Wu Xinrong, et al. Projecting three-dimensional ocean thermohaline structure in the North Indian Ocean from the satellite sea surface data based on a variational method[J]. Journal of Geophysical Research: Oceans, 2021, 126(1): e2020JC016759. doi: 10.1029/2020JC016759 [12] 孙春健, 张晓爽, 张寅权, 等. 卫星遥感重构海洋次表层研究进展[J]. 海洋信息, 2018, 33(4): 21−28.Sun Chunjian, Zhang Xiaoshuang, Zhang Yinquan, et al. Progress in reconstruction of ocean subsurface by satellite remote sensing data[J]. Marine Information, 2018, 33(4): 21−28. [13] Ponte A L, Klein P. Reconstruction of the upper ocean 3D dynamics from high-resolution sea surface height[J]. Ocean Dynamics, 2013, 63(7): 777−791. doi: 10.1007/s10236-013-0611-7 [14] Wang Jinbo, Flierl G R, LaCasce J H, et al. Reconstructing the ocean’s interior from surface data[J]. Journal of Physical Oceanography, 2013, 43(8): 1611−1626. doi: 10.1175/JPO-D-12-0204.1 [15] Fox D N, Teague W J, Barron C N, et al. The modular ocean data assimilation system (MODAS)[J]. Journal of Atmospheric and Oceanic Technology, 2002, 19(2): 240−252. doi: 10.1175/1520-0426(2002)019<0240:TMODAS>2.0.CO;2 [16] Su Hua, Wu Xiangbai, Yan Xiaohai, et al. Estimation of subsurface temperature anomaly in the Indian Ocean during recent global surface warming hiatus from satellite measurements: a support vector machine approach[J]. Remote Sensing of Environment, 2015, 160: 63−71. doi: 10.1016/j.rse.2015.01.001 [17] Su Hua, Wu Xiangbai, Lu Wenfang, et al. Inconsistent subsurface and deeper ocean warming signals during recent global warming and hiatus[J]. Journal of Geophysical Research: Oceans, 2017, 122(10): 8182−8195. doi: 10.1002/2016JC012481 [18] Fujii Y, Kamachi M. Three-dimensional analysis of temperature and salinity in the equatorial Pacific using a variational method with vertical coupled temperature-salinity EOF modes[J]. Journal of Geophysical Research: Oceans, 2003, 108(C9): 3297. [19] 汤博. 中尺度涡旋的统计特征及其温盐场的反演方法研究[D]. 青岛: 中国科学院大学(中国科学院海洋研究所), 2019.Tang Bo. A study on the statistical characteristic of mesoscale eddies and the inversion method of their temperature and salinity[D]. Qingdao: Institute of Oceanology, Chinese Academy of Science, 2019. [20] Su Hua, Zhang Haojie, Geng Xupu, et al. OPEN: a new estimation of global ocean heat content for upper 2000 meters from remote sensing data[J]. Remote Sensing, 2020, 12(14): 2294. doi: 10.3390/rs12142294 [21] Mackenzie K V. Nine-term equation for sound speed in the oceans[J]. The Journal of the Acoustical Society of America, 1981, 70(3): 807−812. doi: 10.1121/1.386920 [22] Guinehut S, Le Traon P Y, Larnicol G. What can we learn from global altimetry/hydrography comparisons?[J]. Geophysical Research Letters, 2006, 33(10): L10604. -

计量
- 文章访问数: 416
- HTML全文浏览量: 276
- PDF下载量: 45
- 被引次数: 0
