

Analyze simulation errors of phytoplankton blooms in typical Arctic seas based on CMIP6 models
-
摘要: 在海冰覆盖的极地海区,浮游植物季节性藻华变化呈现典型的单峰特征。由于藻华过程受控于海冰、光照、混合层深度和营养盐供给等多个因素,其发生时间和强度在地球系统模式模拟结果中存在较大的不确定性。本研究选取11种CMIP6地球系统模式结果,以多种类型的观测资料和产品作为判断参考值,评估各模式结果能否准确模拟北极典型海区(巴伦支海、楚科奇海及白令海)浮游植物藻华动态的变化规律。通过计算能表征光照和营养盐限制的多个指标,分析表层叶绿素a浓度模拟结果的误差来源。结果表明,依据冰下光照时长、混合层变化速率、表层硝酸盐指标将11种模式分为3组,与参考值指标差异较小组别中的模式在藻华模拟方面明显占优,而其余模式在表层硝酸盐或混合层变化的模拟上存在较大误差,导致表层叶绿素a浓度峰值的发生时间延后且峰值浓度误差大。总体而言,地球系统模式配置中除要考虑光照和营养盐这两种基础限制条件外,也需关注由温盐控制的上混合层深度,从而准确模拟出表层叶绿素a浓度的季节性变化规律,上述研究为地球系统模式中相关参数化方案的改进提供了参考。Abstract: Phytoplankton blooms in polar regions with seasonal sea ice cover show a unimodal seasonality. However, the bloom processes are controlled by multiple physical and biogeochemical factors, including sea ice, light availability, mixed layer depth, and nutrients; those may result in great uncertainties in simulating phytoplankton bloom by the Earth System Models (ESMs). In this study, the results of 11 Coupled Model Intercomparison Phase-6 (CMIP6) ESMs were analyzed and evaluated with various types of observational products in order to determine whether those ESMs can correctly model the phytoplankton blooms in three Arctic shelf seas, Barents Sea, Chukchi Sea, and Bering Sea. By calculating multiple indices that represent light and nutrient limitations, the error sources of simulated surface chlorophyll a concentrations were comprehensively analyzed. Our results show that the 11 ESMs can be divided into three groups based on ice-adjusted photoperiod, rate of change of mixed layer depth, and surface nitrate concentration. Some groups are characterized by the smallest bias between modeled indices and observation-based reference, and those ESMs perform best in simulating phytoplankton bloom characteristics. The other groups of ESMs differ significantly from the reference values in terms of surface nitrate and/or rate of change of mixed layer depth, resulting in delayed occurrences of annual chlorophyll a peak concentration and greater differences in corresponding peak values. In general, in addition to the two primary constraints of light and nutrients, the ESMs should also well represent the upper mixed layer controlled by temperature and salinity distributions, so as to accurately simulate the seasonal variation of surface chlorophyll a concentration. The above analyses indicate ESMs can be used in assessing polar planktonic ecosystems, and there is room for improving ecosystem-related parametrization in future ESM development.
-
Key words:
- Arctic Ocean /
- sea ice /
- phytoplankton bloom /
- upper mixed layer /
- earth system models /
- CMIP6
-
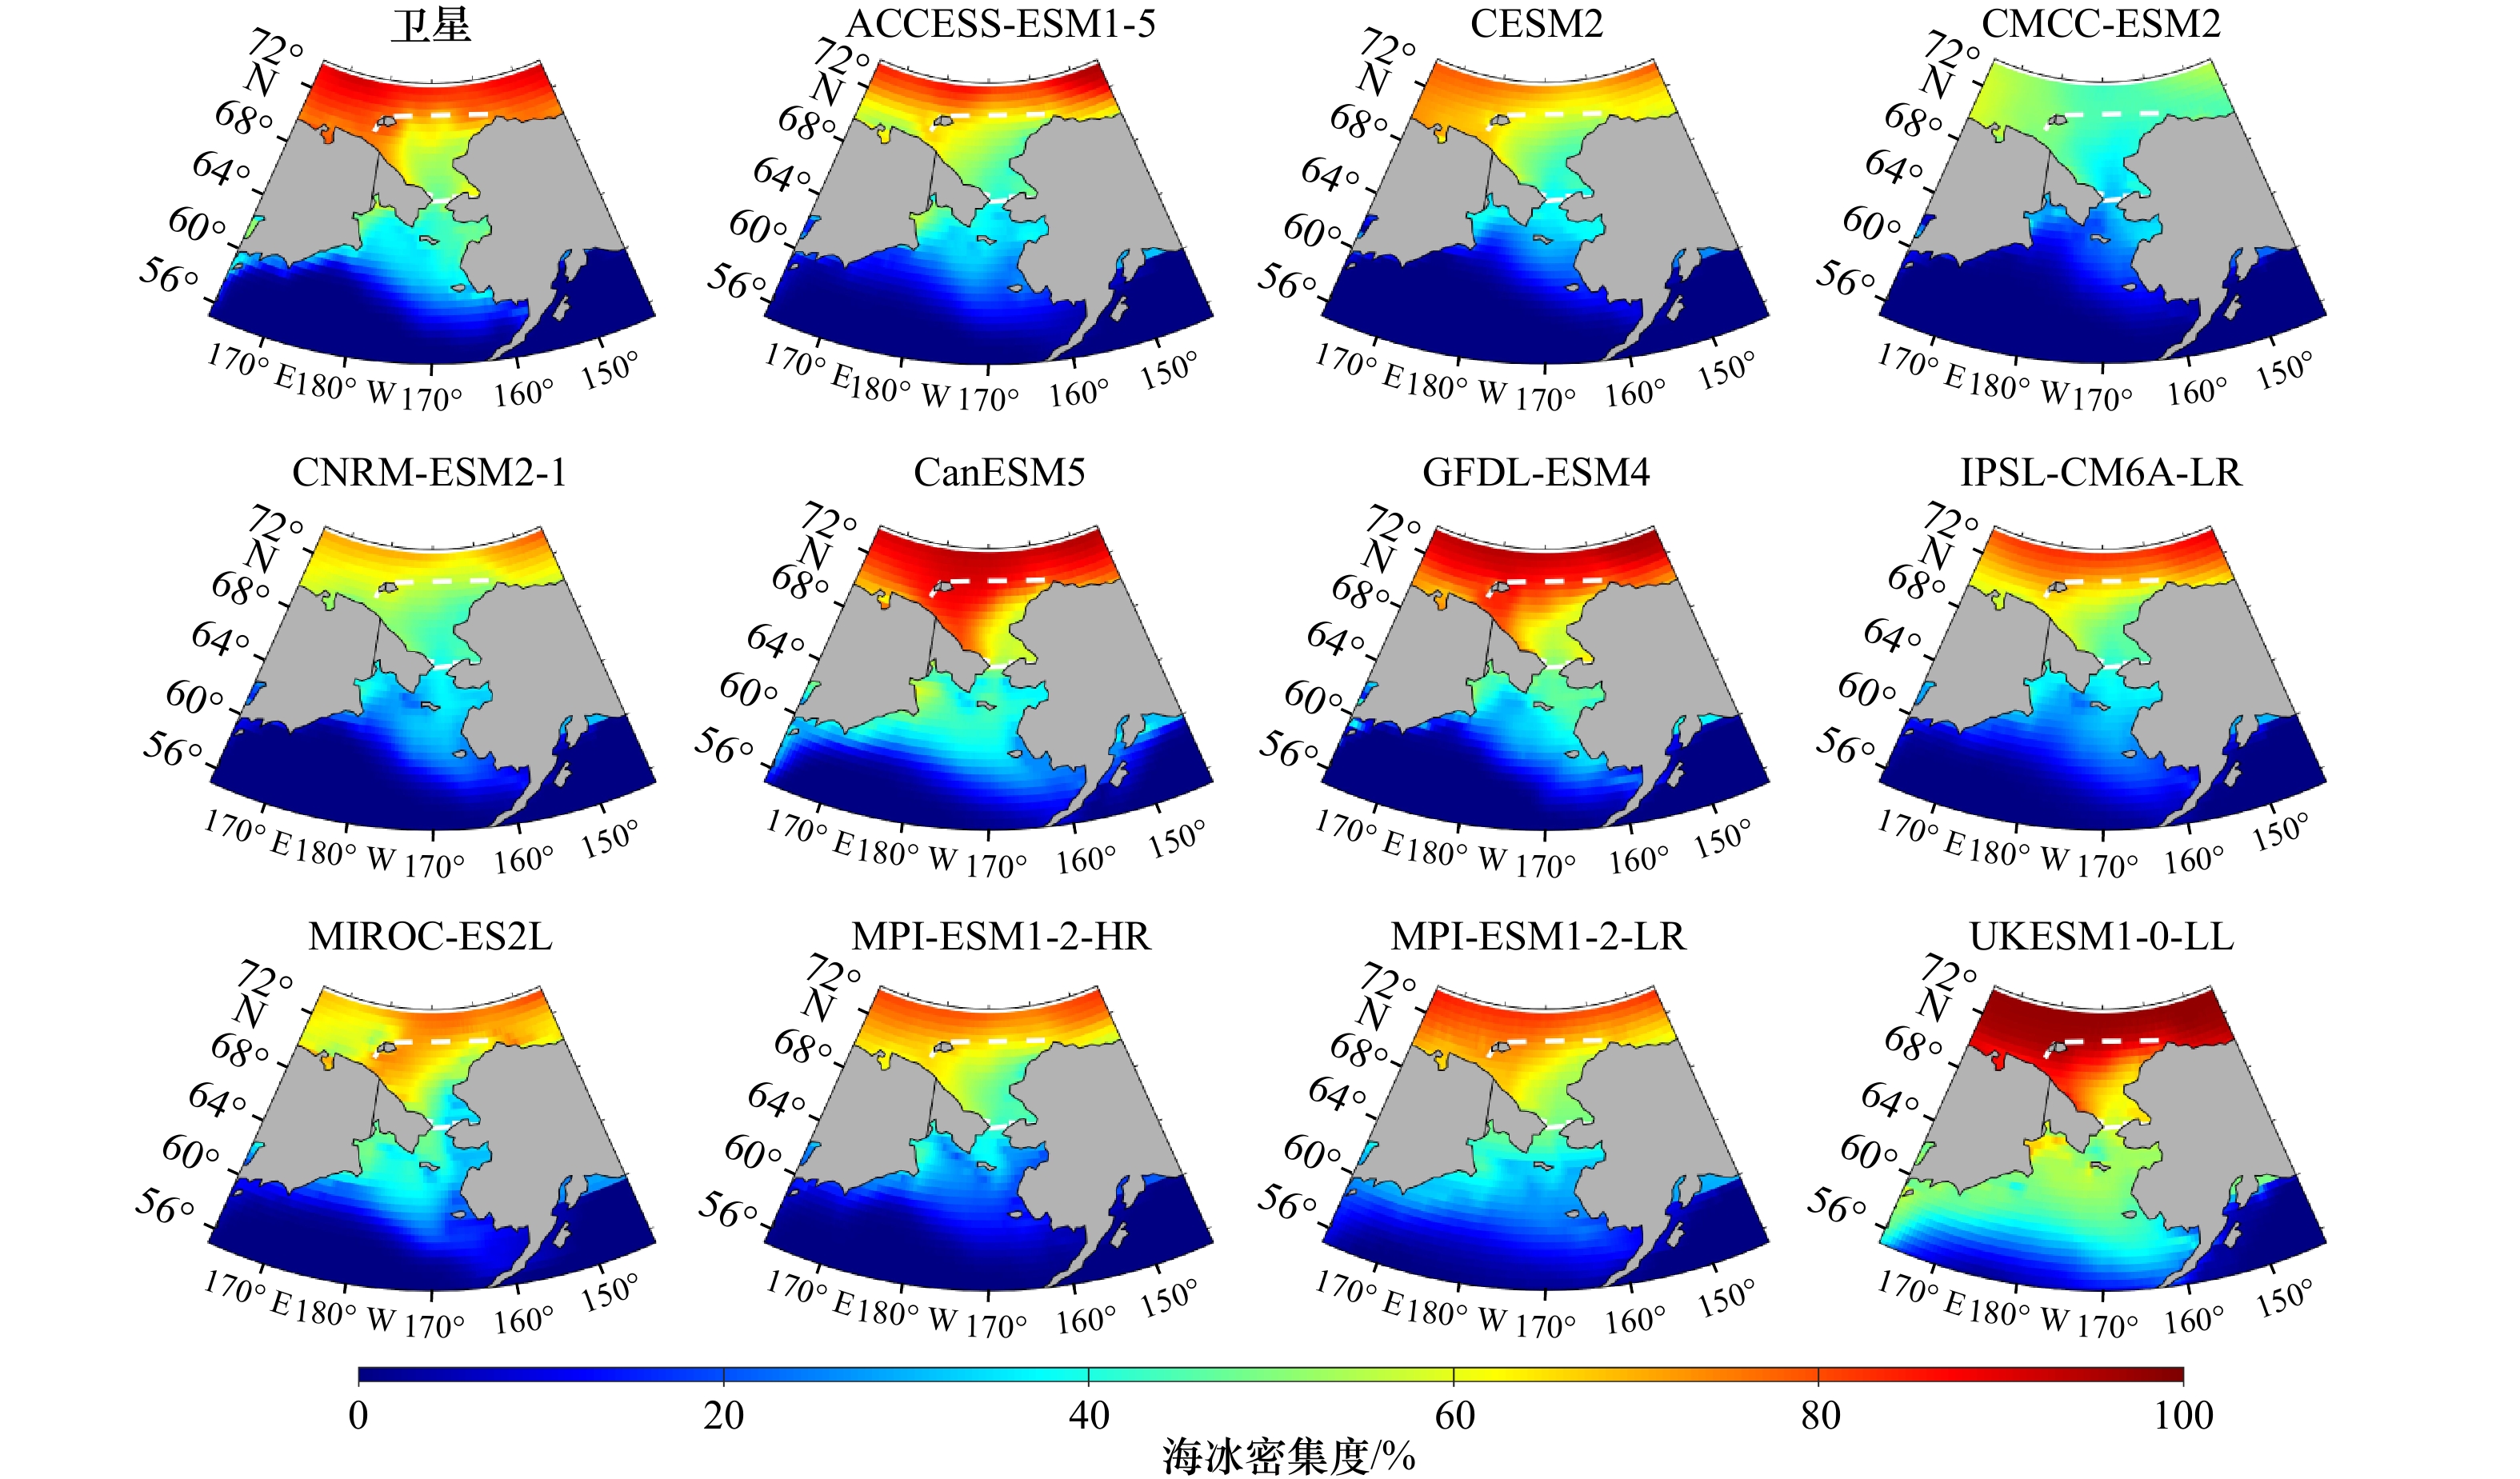
图 4 楚科奇海(65°~70°N)及白令海(55°~65°N)多年平均海冰密集度分布
Fig. 4 Mean sea ice concentration in the Chukchi Sea (65°−70°N) and Bering Sea (55°−65°N)

图 5 CMIP6模式模拟巴伦支海(a)、楚科奇海(b)和白令海(c)30年平均海冰空间能力的泰勒图
Fig. 5 Taylor diagram of CMIP6 model simulations of 30-year seasonal mean sea ice distribution in the Barents Sea (a), Chukchi Sea (b), and Bering Sea (c)

图 6 海冰面积、冰下光照时长、混合层深度、表层硝酸盐浓度和表层叶绿素a浓度在巴伦支海、楚科奇海和白令海的气候态月平均曲线
Fig. 6 Monthly climatology of sea ice area, light duration under ice, mixed layer depth, surface nitrate concentration, and surface chlorophyll a concentration in the Barents Sea, Chukchi Sea, and Bering Sea
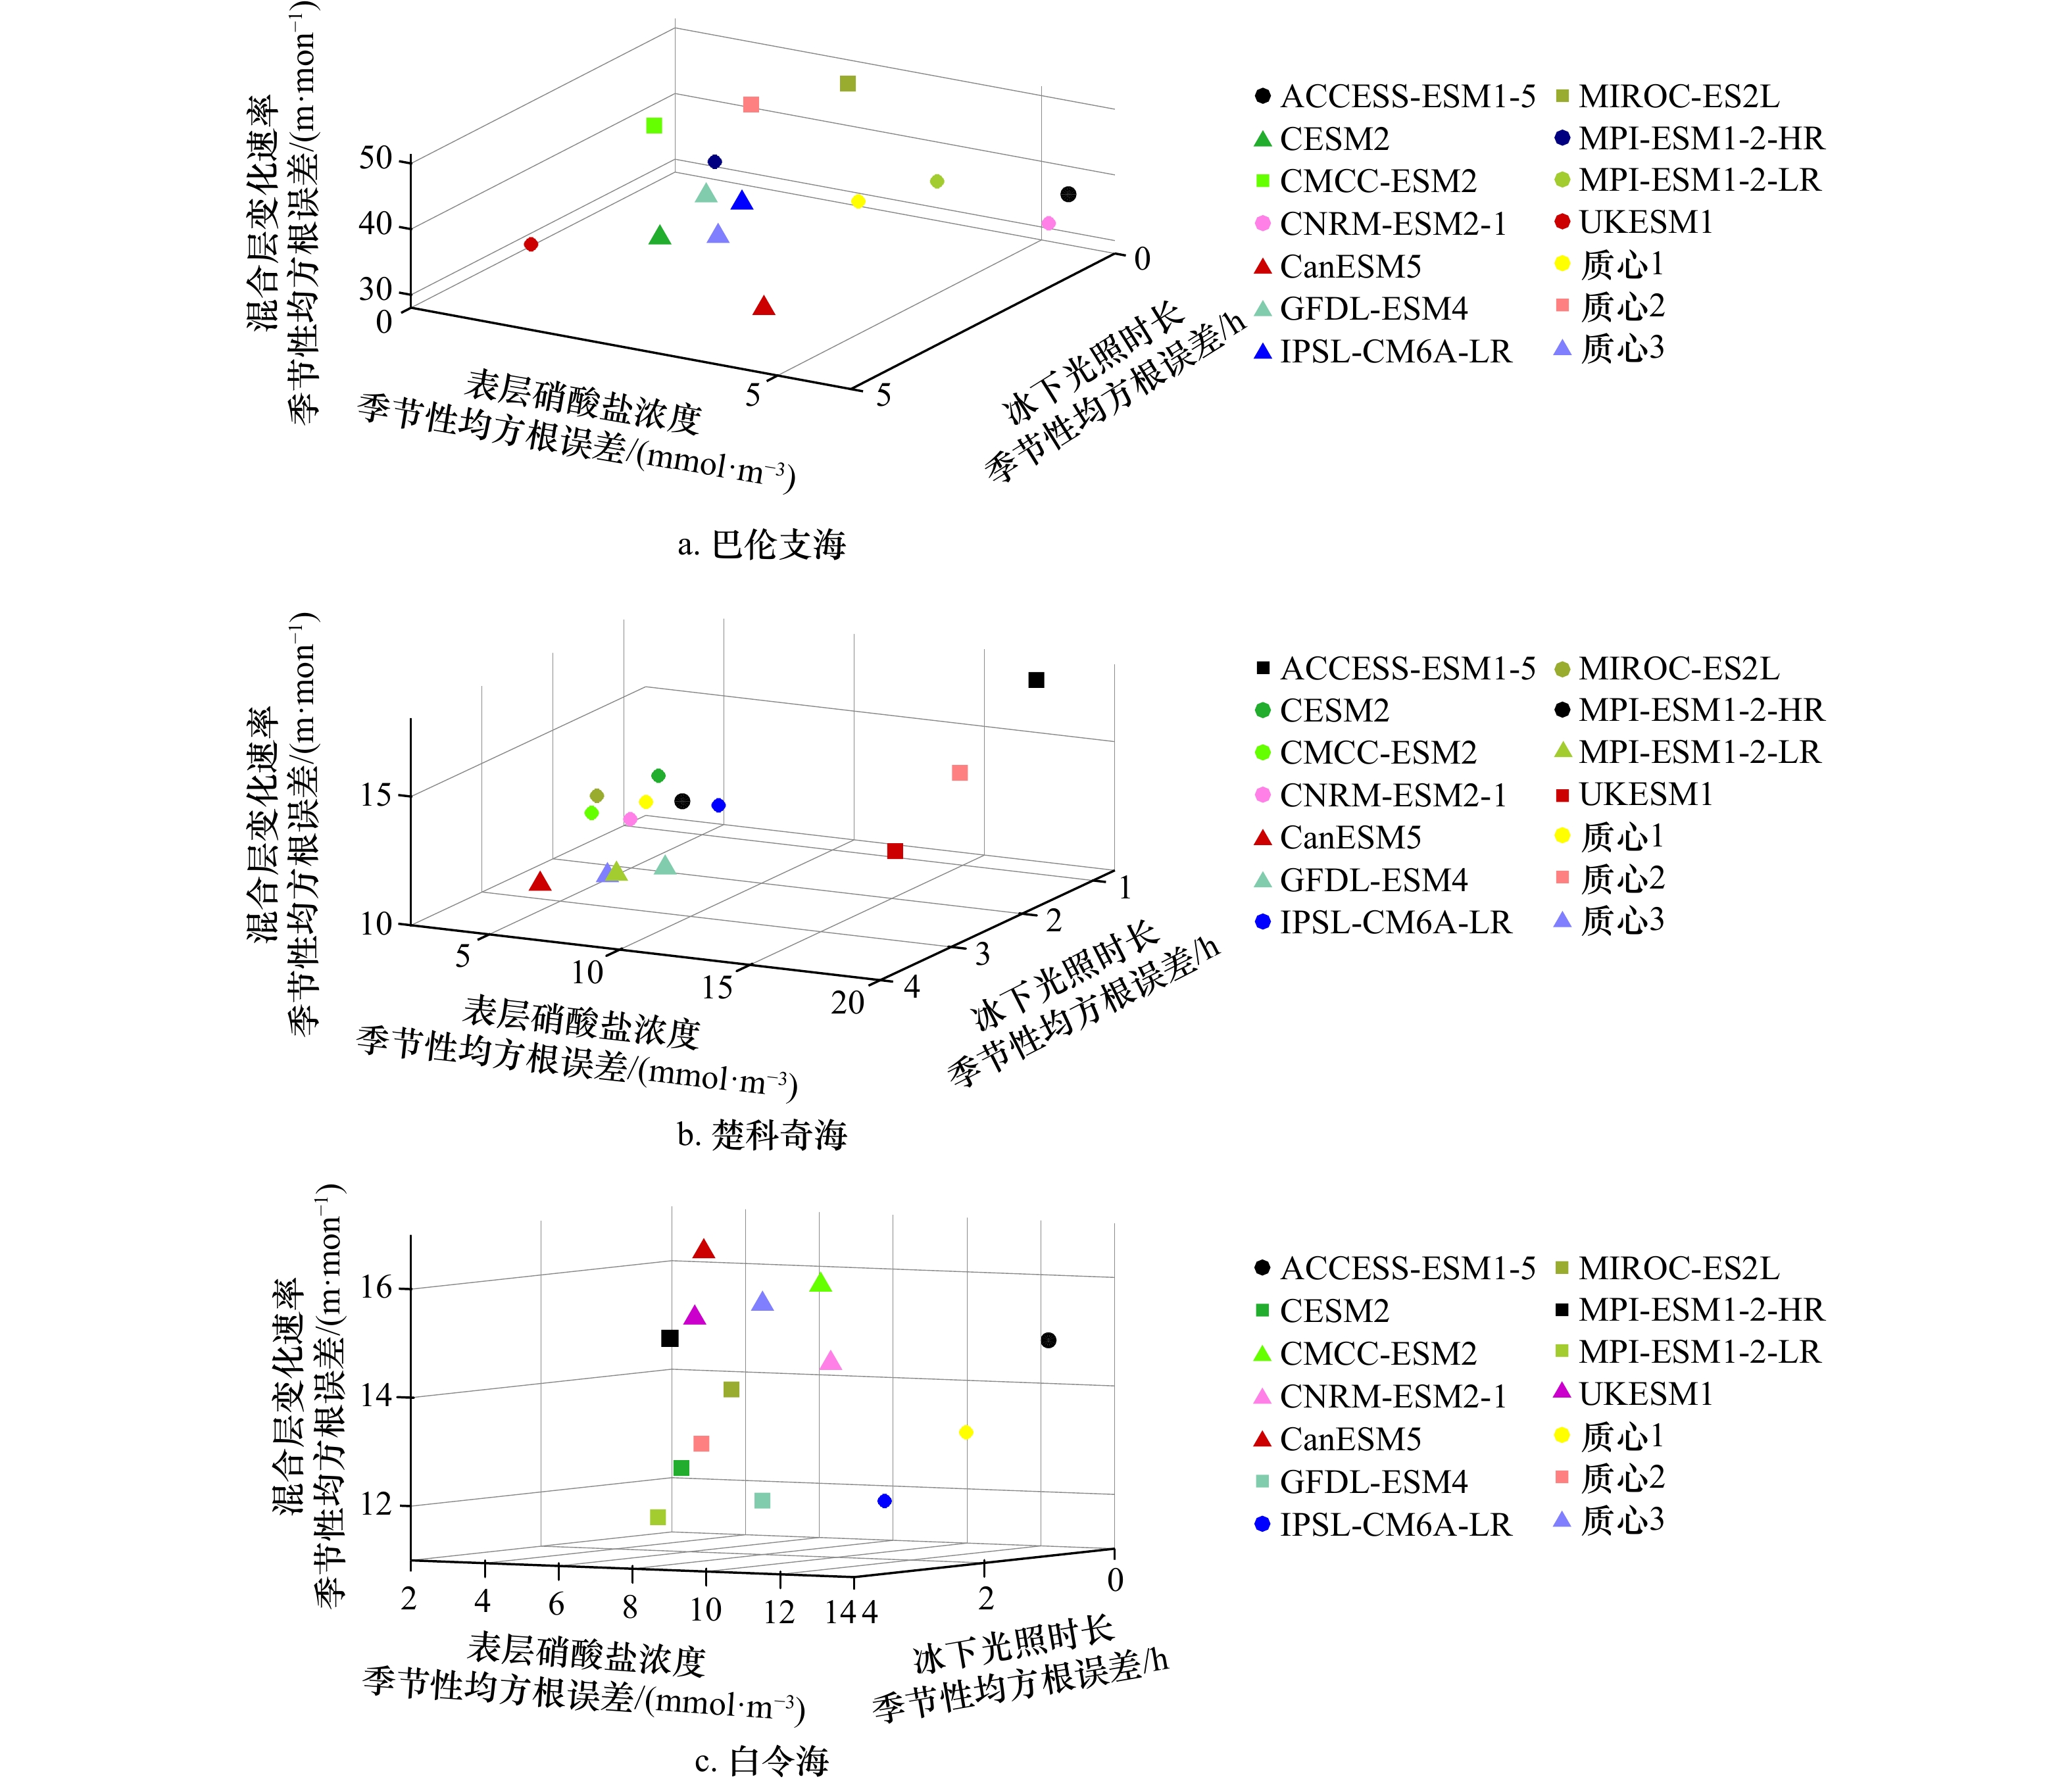
图 7 巴伦支海(a)、楚科奇海(b)和白令海(c)地球系统模式参数模拟情况与分组
Fig. 7 Simulation and grouping of earth system model parameters in the Barents Sea (a), Chukchi Sea (b), and Bering Sea (c)
表 1 本研究所选取的11种地球系统模式及其配置特点
Tab. 1 List of eleven earth system models and their configuration characteristics
模式名称 国家 主要耦合模块 网格数
(经向 × 纬向 × 垂向)参考文献 ACCESS-ESM1-5 澳大利亚 大气、气溶胶、海洋、陆地、海冰、海洋生地化 360 × 300 × 50 Ziehn等[21] CESM2 美国 大气、气溶胶、大气化学、海洋、陆地、海冰、海洋生地化、冰架 320 × 384 × 60 Danabasoglu[22] CMCC-ESM2 意大利 大气、气溶胶、海洋、陆地、海冰、海洋生地化 362 × 292 × 50 Lovato等[23] CNRM-ESM2-1 法国 大气、气溶胶、大气化学、海洋、陆地、海冰、海洋生地化 362 × 294 × 75 Séférian等[24] CanESM5 加拿大 大气、气溶胶、大气化学、海洋、陆地、海冰、海洋生地化、冰架 360 × 290 × 45 Sospedra-Alfonso等[25] GFDL-ESM4 美国 大气、气溶胶、大气化学、海洋、陆地、海冰、海洋生地化、冰架 720 × 576 × 75 Dunne等[26] IPSL-CM6A-LR 法国 大气、海洋、陆地、海冰、海洋生地化 362 × 332 × 75 Boucher等[27] MIROC-ES2L 日本 大气、气溶胶、大气化学、海洋、陆地、海冰、海洋生地化 360 × 256 × 63 Hajima等[28] MPI-ESM1-2-HR 德国 大气、海洋、陆地、海冰、海洋生地化 802 × 404 × 40 Müller等[29] MPI-ESM1-2-LR 德国 大气、海洋、陆地、海冰、海洋生地化 256 × 220 × 40 Müller等[29] UKESM1-0-LL 英国 大气、气溶胶、大气化学、海洋、陆地、海冰、海洋生地化 360 × 330 × 75 Froster等[30]  下载: 导出CSV
表 2 CMIP6地球系统模式月平均指标的均方根误差
Tab. 2 Root mean square errors of monthly mean indices derived from CMIP6 ESMs
海区 模式名称 冰下日照时长/h 表层硝酸盐浓度/
(mmol·m−3)混合层变化速率/
(m·mon−1)表层叶绿素a浓度/
(mg·m−3)叶绿素a浓度峰值
出现月份巴伦支海 ACCESS-ESM1-5 0.518 5.63 37.95 0.47 7 CESM2 1.878 1.15 28.47 0.73 6−7 CMCC-ESM2 2.568 1.56 48.98 0.47 5 CNRM-ESM2-1 0.349 5.35 32.76 0.25 6 CanESM5 3.190 3.51 28.04 0.23 5 GFDL-ESM4 0.789 1.00 30.05 0.18 5 IPSL-CM6A-LR 0.769 1.47 29.84 0.12 5 MIROC-ES2L 0.904 3.01 51.43 0.40 6 MPI-ESM1-2-HR 0.888 1.18 35.75 0.90 6−7 MPI-ESM1-2-LR 0.878 4.21 38.91 0.49 5 UKESM1-0-LL 4.513 1.29 38.36 0.26 6 楚科奇海 ACCESS-ESM1-5 0.819 16.89 16.61 0.32 7 CESM2 0.864 2.95 11.87 0.78 6 CMCC-ESM2 2.599 5.11 12.92 0.75 6 CNRM-ESM2-1 1.576 3.81 11.20 0.46 7−8 CanESM5 3.070 4.43 10.76 0.18 6 GFDL-ESM4 2.016 6.33 10.25 1.76 6 IPSL-CM6A-LR 0.693 4.80 10.73 0.24 9 MIROC-ES2L 1.776 3.08 12.29 0.19 6 MPI-ESM1-2-HR 1.086 4.46 11.33 1.56 7 MPI-ESM1-2-LR 2.654 6.22 10.82 0.45 7 UKESM1-0-LL 3.438 19.04 14.17 0.55 6 白令海 ACCESS-ESM1-5 0.642 13.31 14.48 0.53 7 CESM2 1.327 4.61 12.42 1.33 5 CMCC-ESM2 1.439 8.58 15.95 0.36 5 CNRM-ESM2-1 0.666 7.48 14.38 0.20 5 CanESM5 1.861 6.15 16.56 0.40 4 GFDL-ESM4 0.630 5.57 11.76 0.51 5 IPSL-CM6A-LR 0.867 9.30 11.87 0.28 5 MIROC-ES2L 0.525 4.55 13.76 0.32 6 MPI-ESM1-2-HR 0.485 2.86 14.55 1.81 6 MPI-ESM1-2-LR 1.340 3.99 11.50 0.59 5 UKESM1-0-LL 3.635 9.04 15.64 0.39 5
下载: 导出CSV
表 3 K均值聚类对CMIP6模式分组结果与相应质心
Tab. 3 Grouping of CMIP6 ESMs based on K-means clustering and corresponding centroids
海区 组别 模式 质心坐标 巴伦支海 第一组 ACCESS-ESM1-5、CNRM-ESM2-1、
MPI-ESM1-2-HR、MPI-ESM1-2-LR、
UKESM1-0-LL(1.429,3.532,36.743) 第二组 CMCC-ESM2、MIROC-ES2L (1.736,2.286,50.208) 第三组 CESM2、CanESM5、GFDL-ESM4、
IPSL-CM6A-LR(1.657,1.779,29.097) 楚科奇海 第一组 ACCESS-ESM1-5、UKESM1-0-LL (1.432,4.035,11.725) 第二组 CESM2、CMCC-ESM2、CNRM-ESM2-1、IPSL-CM6A-LR、MIROC-ES2L、
MPI-ESM1-2-HR(2.128,17.961,15.394) 第三组 CanESM5、GFDL-ESM4、
MPI-ESM1-2-LR(2.583,5.523,10.615) 白令海 第一组 CMCC-ESM2、CNRM-ESM2-1、
CanESM5、UKESM1-0-LL(1.900,7.812,15.631) 第二组 ACCESS-ESM1-5、IPSL-CM6A-LR (0.755,11.305,13.178) 第三组 CESM2、GFDL-ESM4、MIROC-ES2L、
MPI-ESM1-2-HR、MPI-ESM1-2-LR(0.861,4.318,12.798)
下载: 导出CSV
-
[1] 朱大勇, 赵进平, 史久新. 北极楚科奇海海冰面积多年变化的研究[J]. 海洋学报, 2007, 29(2): 25−33.Zhu Dayong, Zhao Jinping, Shi Jiuxin. Study on the multi-year variations of sea ice cover of Chukchi Sea in Arctic Ocean[J]. Haiyang Xuebao, 2007, 29(2): 25−33. [2] Hunt Jr G L, Blanchard A L, Boveng P, et al. The Barents and Chukchi Seas: comparison of two Arctic shelf ecosystems[J]. Journal of Marine Systems, 2013, 109−110: 43−68. doi: 10.1016/j.jmarsys.2012.08.003 [3] Årthun M, Eldevik T, Smedsrud L H, et al. Quantifying the influence of Atlantic heat on Barents Sea ice variability and retreat[J]. Journal of Climate, 2012, 25(13): 4736−4743. doi: 10.1175/JCLI-D-11-00466.1 [4] 李正, 沙龙滨, 刘焱光, 等. 末次盛冰期以来巴伦支海−喀拉海古海洋环境及海冰研究进展[J]. 海洋通报, 2021, 40(3): 241−253.Li Zheng, Sha Longbin, Liu Yanguang, et al. Research progress in the paleoceanography environment and sea ice around Barents-Kara Sea since the Last Glacial Maximum[J]. Marine Science Bulletin, 2021, 40(3): 241−253. [5] Sorteberg A, Kvingedal B. Atmospheric forcing on the Barents Sea winter ice extent[J]. Journal of Climate, 2006, 19(19): 4772−4784. doi: 10.1175/JCLI3885.1 [6] Carmack E C, Macdonald R W, Perkin R G, et al. Evidence for warming of Atlantic water in the southern Canadian Basin of the Arctic Ocean: results from the Larsen-93 expedition[J]. Geophysical Research Letters, 1995, 22(9): 1061−1064. doi: 10.1029/95GL00808 [7] McLaughlin F A, Carmack E C, Macdonald R W, et al. Physical and geochemical properties across the Atlantic/Pacific water mass front in the southern Canadian Basin[J]. Journal of Geophysical Research: Oceans, 1996, 101(C1): 1183−1197. doi: 10.1029/95JC02634 [8] Coachman L K, Tripp R B. Currents north of Bering Strait in winter[J]. Limnology and Oceanography, 1970, 15(4): 625−632. doi: 10.4319/lo.1970.15.4.0625 [9] 艾松涛, 陈一凡, 桂大伟, 等. 中国历次极地考察航线及破冰船航行特征分析(1984−2019)[J]. 测绘地理信息, 2021, 46(3): 1−9.Ai Songtao, Chen Yifan, Gui Dawei, et al. Characteristics analysis on polar voyage routes and navigation of Chinese icebreakers (1984−2019)[J]. Journal of Geomatics, 2021, 46(3): 1−9. [10] 王锚婷, 王朝晖, 雷明丹, 等. 冰藻在北冰洋生态系统中的重要性及其对全球变暖的响应[J]. 海洋环境科学, 2021, 40(4): 550−554.Wang Maoting, Wang Zhaohui, Lei Mingdan, et al. The importance of ice algae in the Arctic Ocean ecosystem and their responses to the global warming[J]. Marine Environmental Science, 2021, 40(4): 550−554. [11] Song Hongjun, Ji Rubao, Jin Meibing, et al. Strong and regionally distinct links between ice-retreat timing and phytoplankton production in the Arctic Ocean[J]. Limnology and Oceanography, 2021, 66(6): 2498−2508. doi: 10.1002/lno.11768 [12] 周天军, 邹立维, 陈晓龙. 第六次国际耦合模式比较计划(CMIP6)评述[J]. 气候变化研究进展, 2019, 15(5): 445−456.Zhou Tianjun, Zou Liwei, Chen Xiaolong. Commentary on the coupled model intercomparison project phase 6 (CMIP6)[J]. Climate Change Research, 2019, 15(5): 445−456. [13] Sellar A A, Jones C G, Mulcahy J P, et al. UKESM1: description and evaluation of the U. K. Earth System Model[J]. Journal of Advances in Modeling Earth Systems, 2019, 11(12): 4513−4558. doi: 10.1029/2019MS001739 [14] Adcroft A, Anderson W, Balaji V, et al. The GFDL global ocean and sea ice model OM4.0: model description and simulation features[J]. Journal of Advances in Modeling Earth Systems, 2019, 11(10): 3167−3211. doi: 10.1029/2019MS001726 [15] Swart N C, Cole J N S, Kharin V V, et al. The Canadian earth system model version 5 (CanESM5.0. 3)[J]. Geoscientific Model Development, 2019, 12(11): 4823−4873. doi: 10.5194/gmd-12-4823-2019 [16] Mulcahy J P, Johnson C, Jones C G, et al. Description and evaluation of aerosol in UKESM1 and HadGEM3-GC3.1 CMIP6 historical simulations[J]. Geoscientific Model Development, 2020, 13(12): 6383−6423. doi: 10.5194/gmd-13-6383-2020 [17] Liu Yaman, Dong Xinyi, Wang Minghuai, et al. Analysis of secondary organic aerosol simulation bias in the Community Earth System Model (CESM2.1)[J]. Atmospheric Chemistry and Physics, 2021, 21(10): 8003−8021. doi: 10.5194/acp-21-8003-2021 [18] Hague M, Vichi M. A link between CMIP5 phytoplankton phenology and sea ice in the Atlantic Southern Ocean[J]. Geophysical Research Letters, 2018, 45(13): 6566−6575. doi: 10.1029/2018GL078061 [19] Names and Limits of Oceans and Seas[M]. Monaco: International Hydrographic Bureau, 2002. [20] Polyakov I V, Bhatt U S, Walsh J E, et al. Recent oceanic changes in the Arctic in the context of long-term observations[J]. Ecological Applications, 2013, 23(8): 1745−1764. doi: 10.1890/11-0902.1 [21] Ziehn T, Chamberlain M A, Law R M, et al. The Australian earth system model: ACCESS-ESM1.5[J]. Journal of Southern Hemisphere Earth Systems Science, 2020, 70(1): 193−214. doi: 10.1071/ES19035 [22] Danabasoglu G, Lamarque J F, Bacmeister J, et al. The community earth system model version 2 (CESM2)[J]. Journal of Advances in Modeling Earth Systems, 2020, 12(2): e2019MS001916. [23] Lovato T, Peano D, Butenschön M, et al. CMIP6 simulations with the CMCC earth system model (CMCC-ESM2)[J]. Journal of Advances in Modeling Earth Systems, 2022, 14(3): e2021MS002814. doi: 10.1029/2021MS002814 [24] Séférian R, Nabat P, Michou M, et al. Evaluation of CNRM earth system model, CNRM-ESM2-1: role of earth system processes in present-day and future climate[J]. Journal of Advances in Modeling Earth Systems, 2019, 11(12): 4182−4227. doi: 10.1029/2019MS001791 [25] Sospedra-Alfonso R, Merryfield W J, Boer G J, et al. Decadal climate predictions with the Canadian Earth system model version 5 (CanESM5)[J]. Geoscientific Model Development, 2021, 14(11): 6863−6891. doi: 10.5194/gmd-14-6863-2021 [26] Dunne J P, Horowitz L W, Adcroft A J, et al. The GFDL Earth System Model version 4.1 (GFDL-ESM 4.1): overall coupled model description and simulation characteristics[J]. Journal of Advances in Modeling Earth Systems, 2020, 12(11): e2019MS002015. [27] Boucher O, Servonnat J, Albright A L, et al. Presentation and evaluation of the IPSL-CM6A-LR climate model[J]. Journal of Advances in Modeling Earth Systems, 2020, 12(7): e2019MS002010. [28] Hajima T, Watanabe M, Yamamoto A, et al. Development of the MIROC-ES2L Earth system model and the evaluation of biogeochemical processes and feedbacks[J]. Geoscientific Model Development, 2020, 13(5): 2197−2244. doi: 10.5194/gmd-13-2197-2020 [29] Müller W A, Jungclaus J H, Mauritsen T, et al. A higher-resolution version of the max planck institute earth system model (MPI-ESM1.2-HR)[J]. Journal of Advances in Modeling Earth Systems, 2018, 10(7): 1383−1413. doi: 10.1029/2017MS001217 [30] Forster P M, Maycock A C, McKenna C M, et al. Latest climate models confirm need for urgent mitigation[J]. Nature Climate Change, 2020, 10(1): 7−10. doi: 10.1038/s41558-019-0660-0 [31] Comiso J C, Meier W N, Gersten R. Variability and trends in the Arctic Sea ice cover: results from different techniques[J]. Journal of Geophysical Research: Oceans, 2017, 122(8): 6883−6900. doi: 10.1002/2017JC012768 [32] Maritorena S, Siegel D A. Consistent merging of satellite ocean color data sets using a bio-optical model[J]. Remote Sensing of Environment, 2005, 94(4): 429−440. doi: 10.1016/j.rse.2004.08.014 [33] Deser C, Walsh J E, Timlin M S. Arctic sea ice variability in the context of recent atmospheric circulation trends[J]. Journal of Climate, 2000, 13(3): 617−633. doi: 10.1175/1520-0442(2000)013<0617:ASIVIT>2.0.CO;2 [34] Taylor K E. Summarizing multiple aspects of model performance in a single diagram[J]. Journal of Geophysical Research: Atmospheres, 2001, 106(D7): 7183−7192. doi: 10.1029/2000JD900719 [35] Li Yun, Ji Rubao, Jenouvrier S, et al. Synchronicity between ice retreat and phytoplankton bloom in circum-Antarctic polynyas[J]. Geophysical Research Letters, 2016, 43(5): 2086−2093. doi: 10.1002/2016GL067937 [36] Forsythe W C, Rykiel Jr E J, Stahl R S, et al. A model comparison for daylength as a function of latitude and day of year[J]. Ecological Modelling, 1995, 80(1): 87−95. doi: 10.1016/0304-3800(94)00034-F [37] Peralta-Ferriz C, Woodgate R A. Seasonal and interannual variability of pan-Arctic surface mixed layer properties from 1979 to 2012 from hydrographic data, and the dominance of stratification for multiyear mixed layer depth shoaling[J]. Progress in Oceanography, 2015, 134: 19−53. doi: 10.1016/j.pocean.2014.12.005 [38] 庞小平, 胡晓坤, 季青, 等. 北冰洋叶绿素a及初级生产力遥感反演研究进展[J]. 极地研究, 2022, 34(1): 1−10.Pang Xiaoping, Hu Xiaokun, Ji Qing, et al. Research progress on remote sensing retrieval of chlorophyll a and primary productivity in the Arctic Ocean[J]. Chinese Journal of Polar Research, 2022, 34(1): 1−10. [39] 陈建芳, 金海燕, 白有成, 等. 北极快速变化的生态环境响应[J]. 海洋学报, 2018, 40(10): 22−31.Chen Jianfang, Jin Haiyan, Bai Youcheng, et al. Marine ecological and environmental responses to the Arctic rapid change[J]. Haiyang Xuebao, 2018, 40(10): 22−31. [40] Lewis K M, Arrigo K R. Ocean color algorithms for estimating chlorophyll a, CDOM absorption, and particle backscattering in the Arctic Ocean[J]. Journal of Geophysical Research: Oceans, 2020, 125(6): e2019JC015706. [41] 徐秋栋. 应用多元统计分析[J]. 工业工程与管理, 2014, 19(1): 22.Xu Qiudong. Applied multivariate statistical analysis[J]. Industrial Engineering and Management, 2014, 19(1): 22. [42] Carranza M M, Gille S T. Southern Ocean wind-driven entrainment enhances satellite chlorophyll-a through the summer[J]. Journal of Geophysical Research: Oceans, 2015, 120(1): 304−323. doi: 10.1002/2014JC010203 [43] Wang S, Bailey D, Lindsay K, et al. Impact of sea ice on the marine iron cycle and phytoplankton productivity[J]. Biogeosciences, 2014, 11(17): 4713−4731. doi: 10.5194/bg-11-4713-2014 [44] Sallée J B, Shuckburgh E, Bruneau N, et al. Assessment of Southern Ocean water mass circulation and characteristics in CMIP5 models: historical bias and forcing response[J]. Journal of Geophysical Research: Oceans, 2013, 118(4): 1830−1844. doi: 10.1002/jgrc.20135 [45] Fauchereau N, Tagliabue A, Bopp L, et al. The response of phytoplankton biomass to transient mixing events in the Southern Ocean[J]. Geophysical Research Letters, 2011, 38(17): L17601. [46] Cavanagh R D, Murphy E J, Bracegirdle T J, et al. A synergistic approach for evaluating climate model output for ecological applications[J]. Frontiers in Marine Science, 2017, 4: 308. doi: 10.3389/fmars.2017.00308 [47] Boyd P W. Environmental factors controlling phytoplankton processes in the Southern Ocean1[J]. Journal of Phycology, 2002, 38(5): 844−861. doi: 10.1046/j.1529-8817.2002.t01-1-01203.x [48] 柯长青, 金鑫, 沈校熠, 等. 南北极海冰变化及其影响因素的对比分析[J]. 极地研究, 2020, 32(1): 1−12.Ke Changqing, Jin Xin, Shen Xiaoyi, et al. Comparison of Antarctic and Arctic sea ice variations and their impact factors[J]. Chinese Journal of Polar Research, 2020, 32(1): 1−12. [49] 邱博, 张录军, 储敏, 等. 气候系统模式对于北极海冰模拟分析[J]. 极地研究, 2015, 27(1): 47−55.Qiu Bo, Zhang Lujun, Chu Min, et al. Performance analysis of Arctic sea ice simulation in climate system models[J]. Chinese Journal of Polar Research, 2015, 27(1): 47−55. [50] 魏皓, 赵伟, 罗晓凡, 等. 北冰洋浮游生物空间分布及其季节变化的模拟[J]. 海洋学报, 2019, 41(9): 65−79.Wei Hao, Zhao Wei, Luo Xiaofan, et al. Simulation of spatial distribution and seasonal variation of plankton in the Arctic Ocean[J]. Haiyang Xuebao, 2019, 41(9): 65−79. [51] Jin Meibing, Popova E E, Zhang Jinlun, et al. Ecosystem model intercomparison of under-ice and total primary production in the Arctic Ocean[J]. Journal of Geophysical Research: Oceans, 2016, 121(1): 934−948. doi: 10.1002/2015JC011183 [52] Cullen J J. The deep chlorophyll maximum: comparing vertical profiles of chlorophyll a[J]. Canadian Journal of Fisheries and Aquatic Sciences, 1982, 39(5): 791−803. doi: 10.1139/f82-108 [53] Martin J, Tremblay J É, Gagnon J, et al. Prevalence, structure and properties of subsurface chlorophyll maxima in Canadian Arctic waters[J]. Marine Ecology Progress Series, 2010, 412: 69−84. doi: 10.3354/meps08666 [54] Arrigo K R, Mills M M, van Dijken G L, et al. Late spring nitrate distributions beneath the ice-covered northeastern Chukchi Shelf[J]. Journal of Geophysical Research: Biogeosciences, 2017, 122(9): 2409−2417. doi: 10.1002/2017JG003881 [55] Ardyna M, Babin M, Gosselin M, et al. Recent Arctic Ocean sea ice loss triggers novel fall phytoplankton blooms[J]. Geophysical Research Letters, 2014, 41(17): 6207−6212. doi: 10.1002/2014GL061047 [56] Harrison W G, Cota G F. Primary production in polar waters: relation to nutrient availability[J]. Polar Research, 1991, 10(1): 87−104. doi: 10.1111/j.1751-8369.1991.tb00637.x [57] Stein R, MacDonald R W. The Organic Carbon Cycle in the Arctic Ocean[M]. New York: Springer, 2004. [58] Ardyna M, Gosselin M, Michel C, et al. Environmental forcing of phytoplankton community structure and function in the Canadian High Arctic: contrasting oligotrophic and eutrophic regions[J]. Marine Ecology Progress Series, 2011, 442: 37−57. doi: 10.3354/meps09378 [59] Michel C, Hamilton J, Hansen E, et al. Arctic Ocean outflow shelves in the changing Arctic: a review and perspectives[J]. Progress in Oceanography, 2015, 139: 66−88. doi: 10.1016/j.pocean.2015.08.007 [60] Tremblay J É, Anderson L G, Matrai P, et al. Global and regional drivers of nutrient supply, primary production and CO2 drawdown in the changing Arctic Ocean[J]. Progress in Oceanography, 2015, 139: 171−196. doi: 10.1016/j.pocean.2015.08.009 -


计量
- 文章访问数: 511
- HTML全文浏览量: 199
- PDF下载量: 41
- 被引次数: 0
