

Assimilation of combining satellite remote sensing and in-situ observation based on space-time four-dimensional multi-scale analysis method
-
摘要: 充分融合使用卫星遥感与现场观测信息,构建高质量的水下温盐场是海洋科学研究发展的前沿课题。目前,绝大多数同化系统使用的同化方案,均需要假设要素在海表与水下存在某种人为预先设定的关系,从而导致得到的温盐分析场人为性较强,不能完全客观地反映真实的海洋状态。本研究提出了一种不做任何关系假设,仅依靠不同种类的观测资料在时间和空间上的相互补充作用,融合卫星遥感与现场观测资料,进行时空四维多尺度分析的方案。通过与分别单独同化这两类观测资料的试验结果相比,该方案既可以得到较精准的温盐剖面结构特征,又能够反映出海面中尺度变化的细节信息,最大化地提取了观测资料中的多尺度信息,实现了“1 + 1 > 2”的效果,构建了完全客观的温盐分析场。研究结果还表明,同化卫星遥感海表面盐度资料可以有效改善温度和盐度的分析,证明了海表面盐度观测在温盐同化中的重要性。
-
关键词:
- 多尺度分析 /
- 卫星遥感 /
- 现场观测 /
- 多重网格四维变分方法
Abstract: Fully integrating the use of satellite remote sensing and in-situ observation information to build a high-quality underwater temperature and salinity fields is a frontier topic in the development of marine scientific research. Currently, the vast majority of assimilation systems use assimilation schemes that require the assumption that elements have some artificially predetermined relationship between the surface and underwater. As a result, the temperature and salinity analysis field was more man-made and could not objectively reflect the real state of the ocean. This paper proposed a scheme that did not make any relationship assumptions, only relied on the complementary effects of different types of observation data in time and space, and combined the satellite remote sensing and in-situ observations for spatio-temporal four-dimensional multiscale objective analysis. Compared with the experimental results of assimilating these two types of observation data separately, it was found that the method could not only obtain more accurate temperature and salinity profile structure characteristics, but also reflect the detailed information of the mesoscale changes in the sea surface, the multi-scale information in the observation data was extracted to the maximum, and the effect of “1 + 1 > 2” was realized, and constructed a completely objective temperature and salinity analysis field. The results also showed that assimilating satellite remote sensing sea surface salinity data can effectively improve the analysis of temperature and salinity, which proved that the role of satellite remote sensing sea surface salinity observation on temperature and salinity assimilation could not be ignored. -
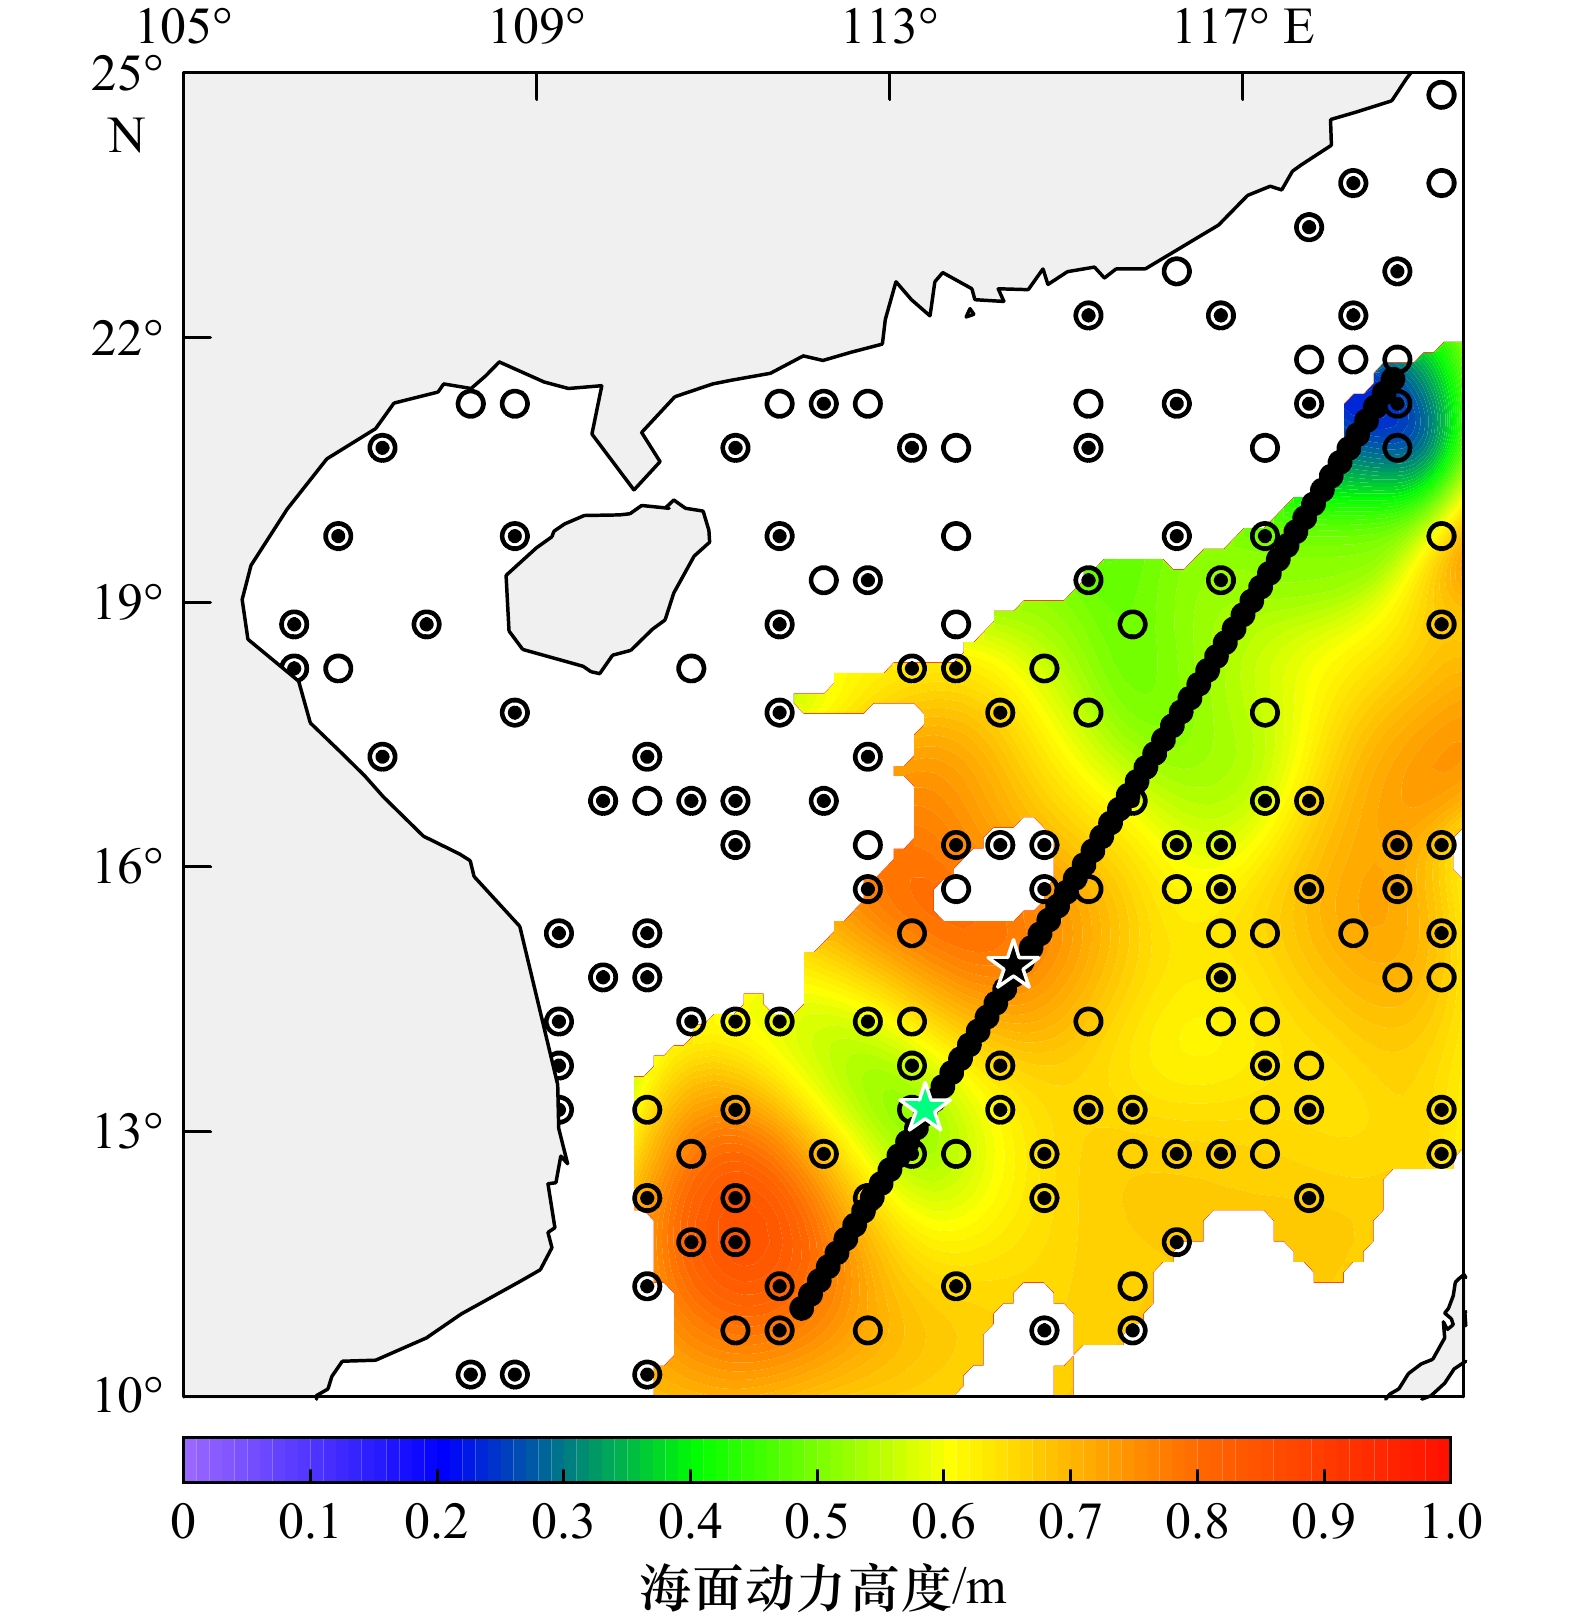
图 1 温、盐现场观测分布与断面位置
空心圆为孪生试验中仅含有温度现场观测点,实心圆为既含有温度又含有盐度现场观测点。绿色和黑色五角星分别对应图6盐度断面中的虚线位置
Fig. 1 Distribution of observations of temperature and salinity and the cross-sectional location
The hollow circle represents a field observation point containing only temperature in the twin test, and the solid circle represents a field observation point containing both temperature and salinity. The green and black five-pointed stars correspond to the dotted lines in the salinity section of Figure 6
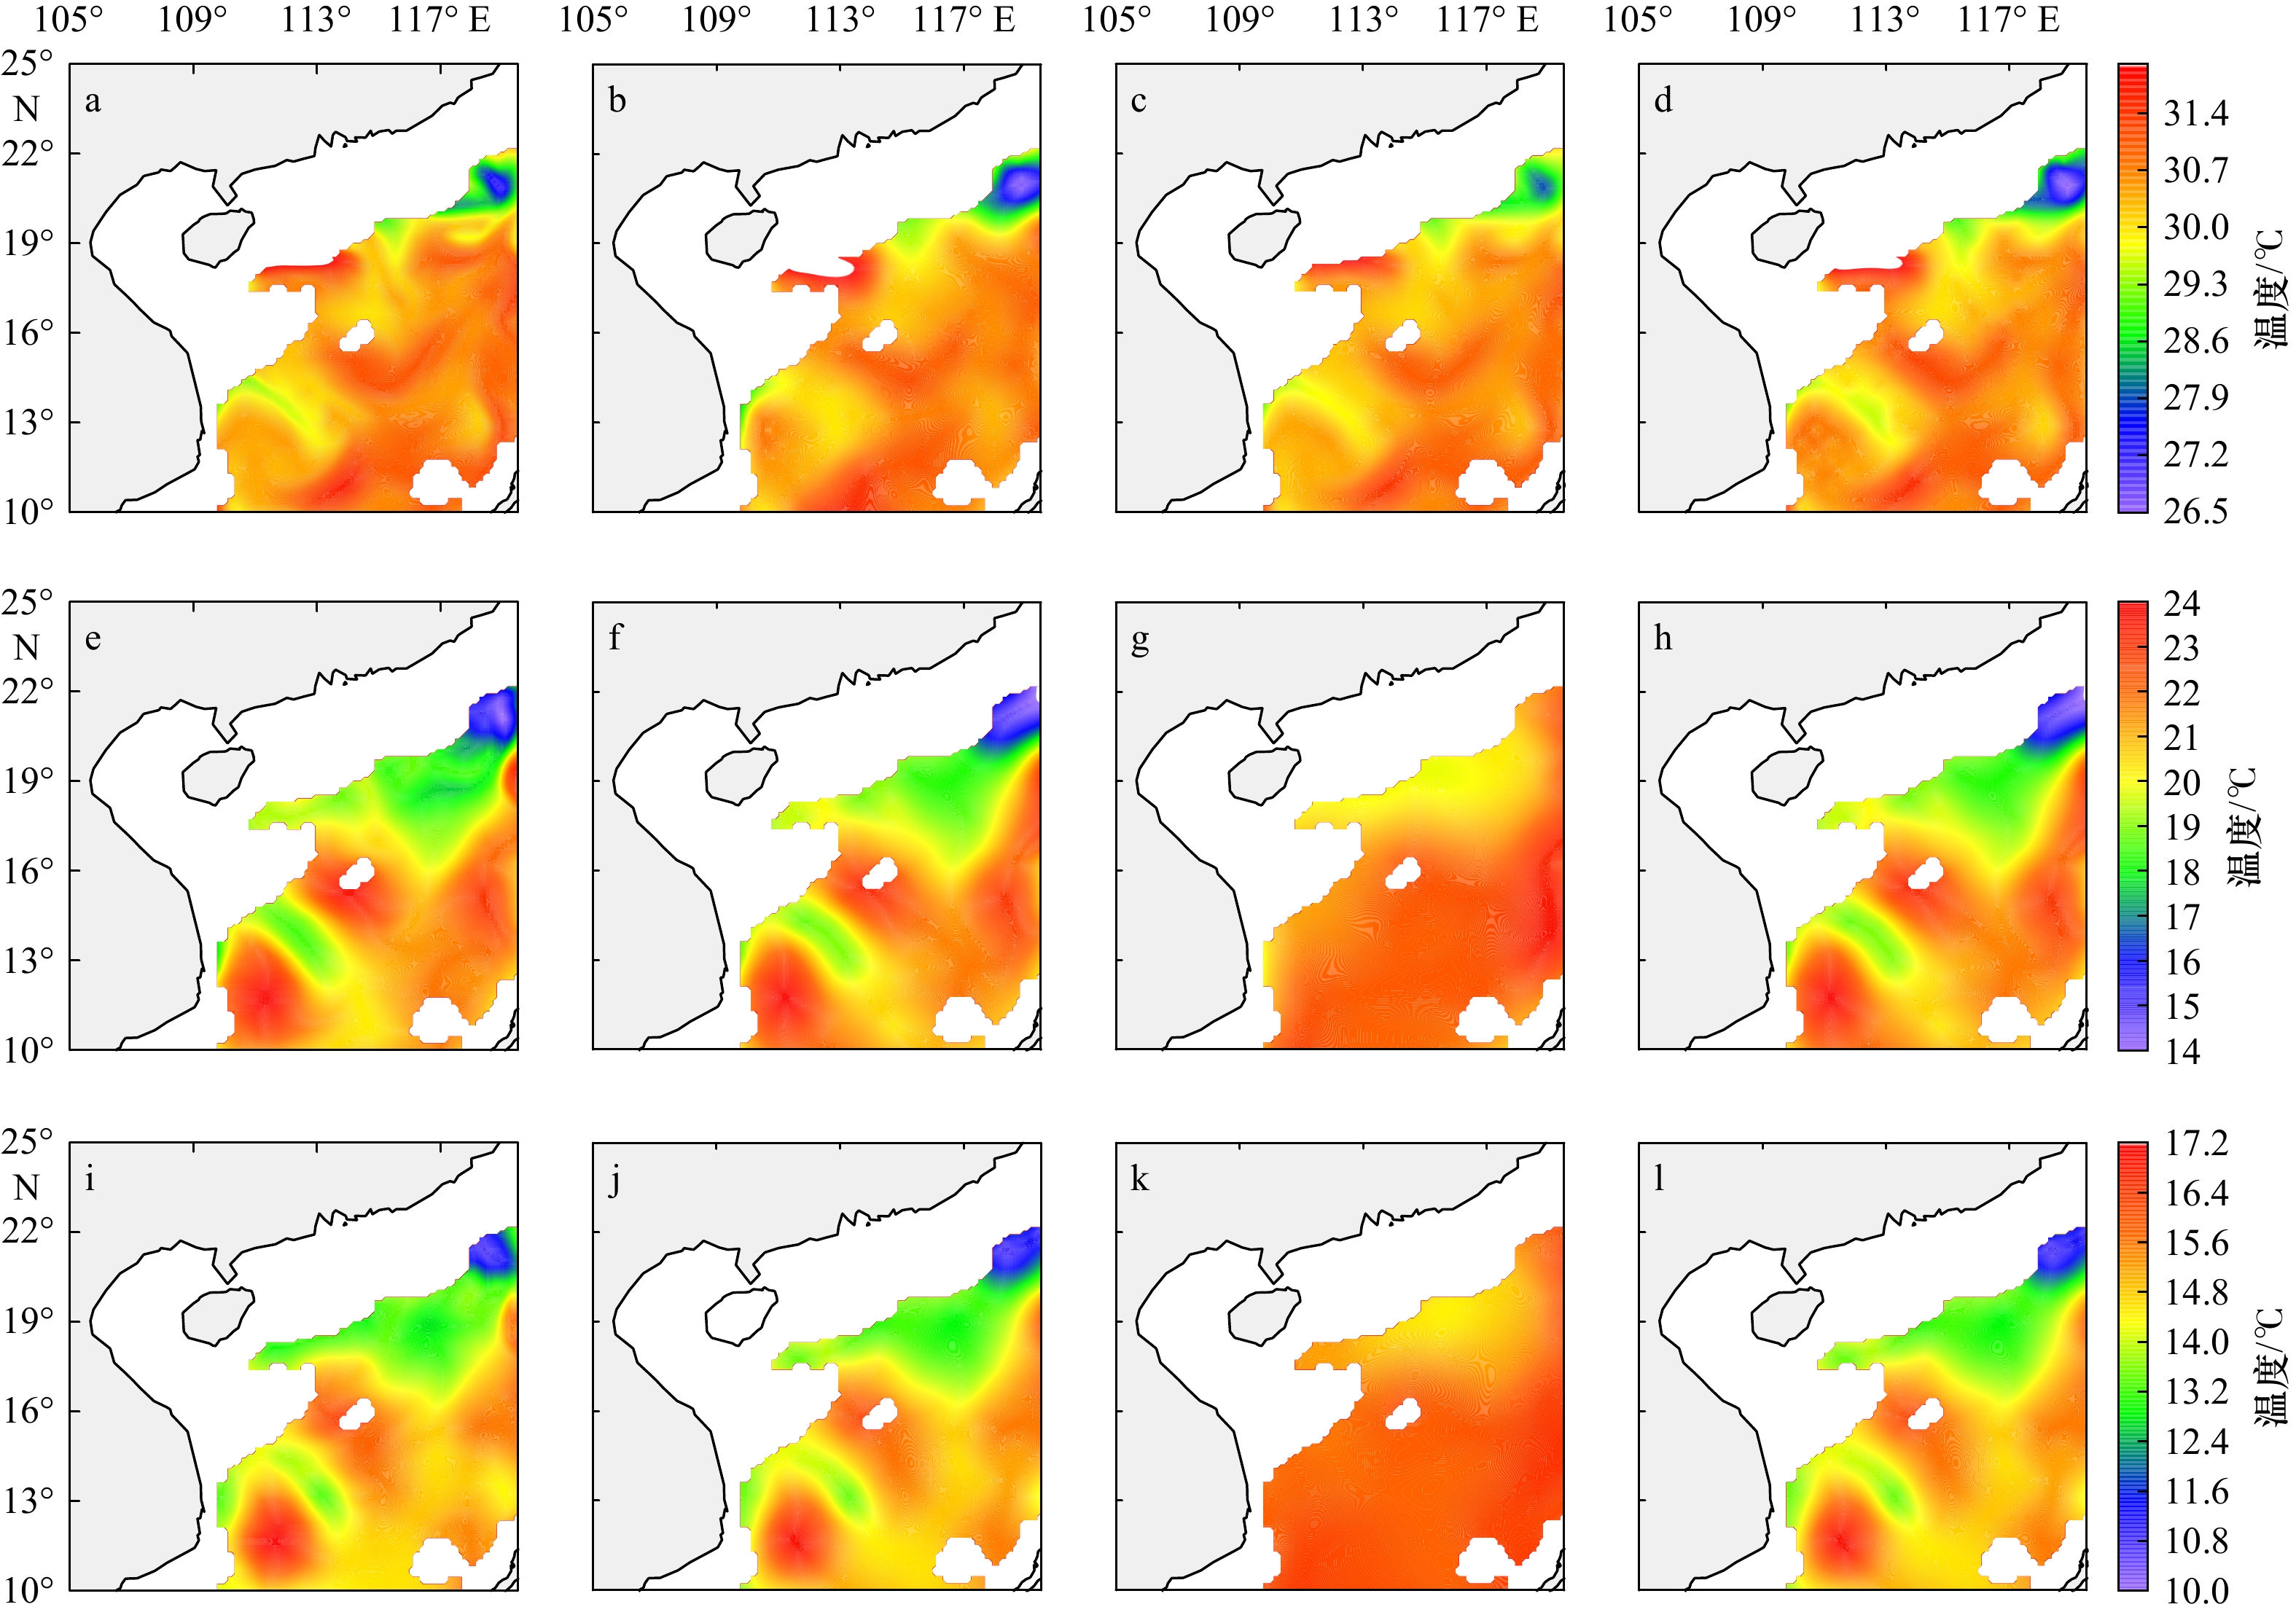
图 2 真实场与3组试验方案的不同深度层温度分布
a、e、i分别为真实的10 m、100 m、200 m温度场;b、f、j分别为方案1的10 m、100 m、200 m温度场;c、g、k分别为方案2的10 m、100 m、200 m温度场;d、h、l分别为方案3的10 m、100 m、200 m温度场
Fig. 2 Temperature distribution of different depth layers of the real field and three sets of experimental schemes
a, e, i. The temperature fields of true fields in 10 m, 100 m and 200 m, respectively; b, f, j. the temperature fields of Scheme 1 in 10 m, 100 m and 200 m, respectively; c, g, k. the temperature fields of Scheme 2 in 10 m, 100 m and 200 m, respectively; d, h, l. the temperature fields of Scheme 3 in 10 m, 100 m and 200 m, respectively
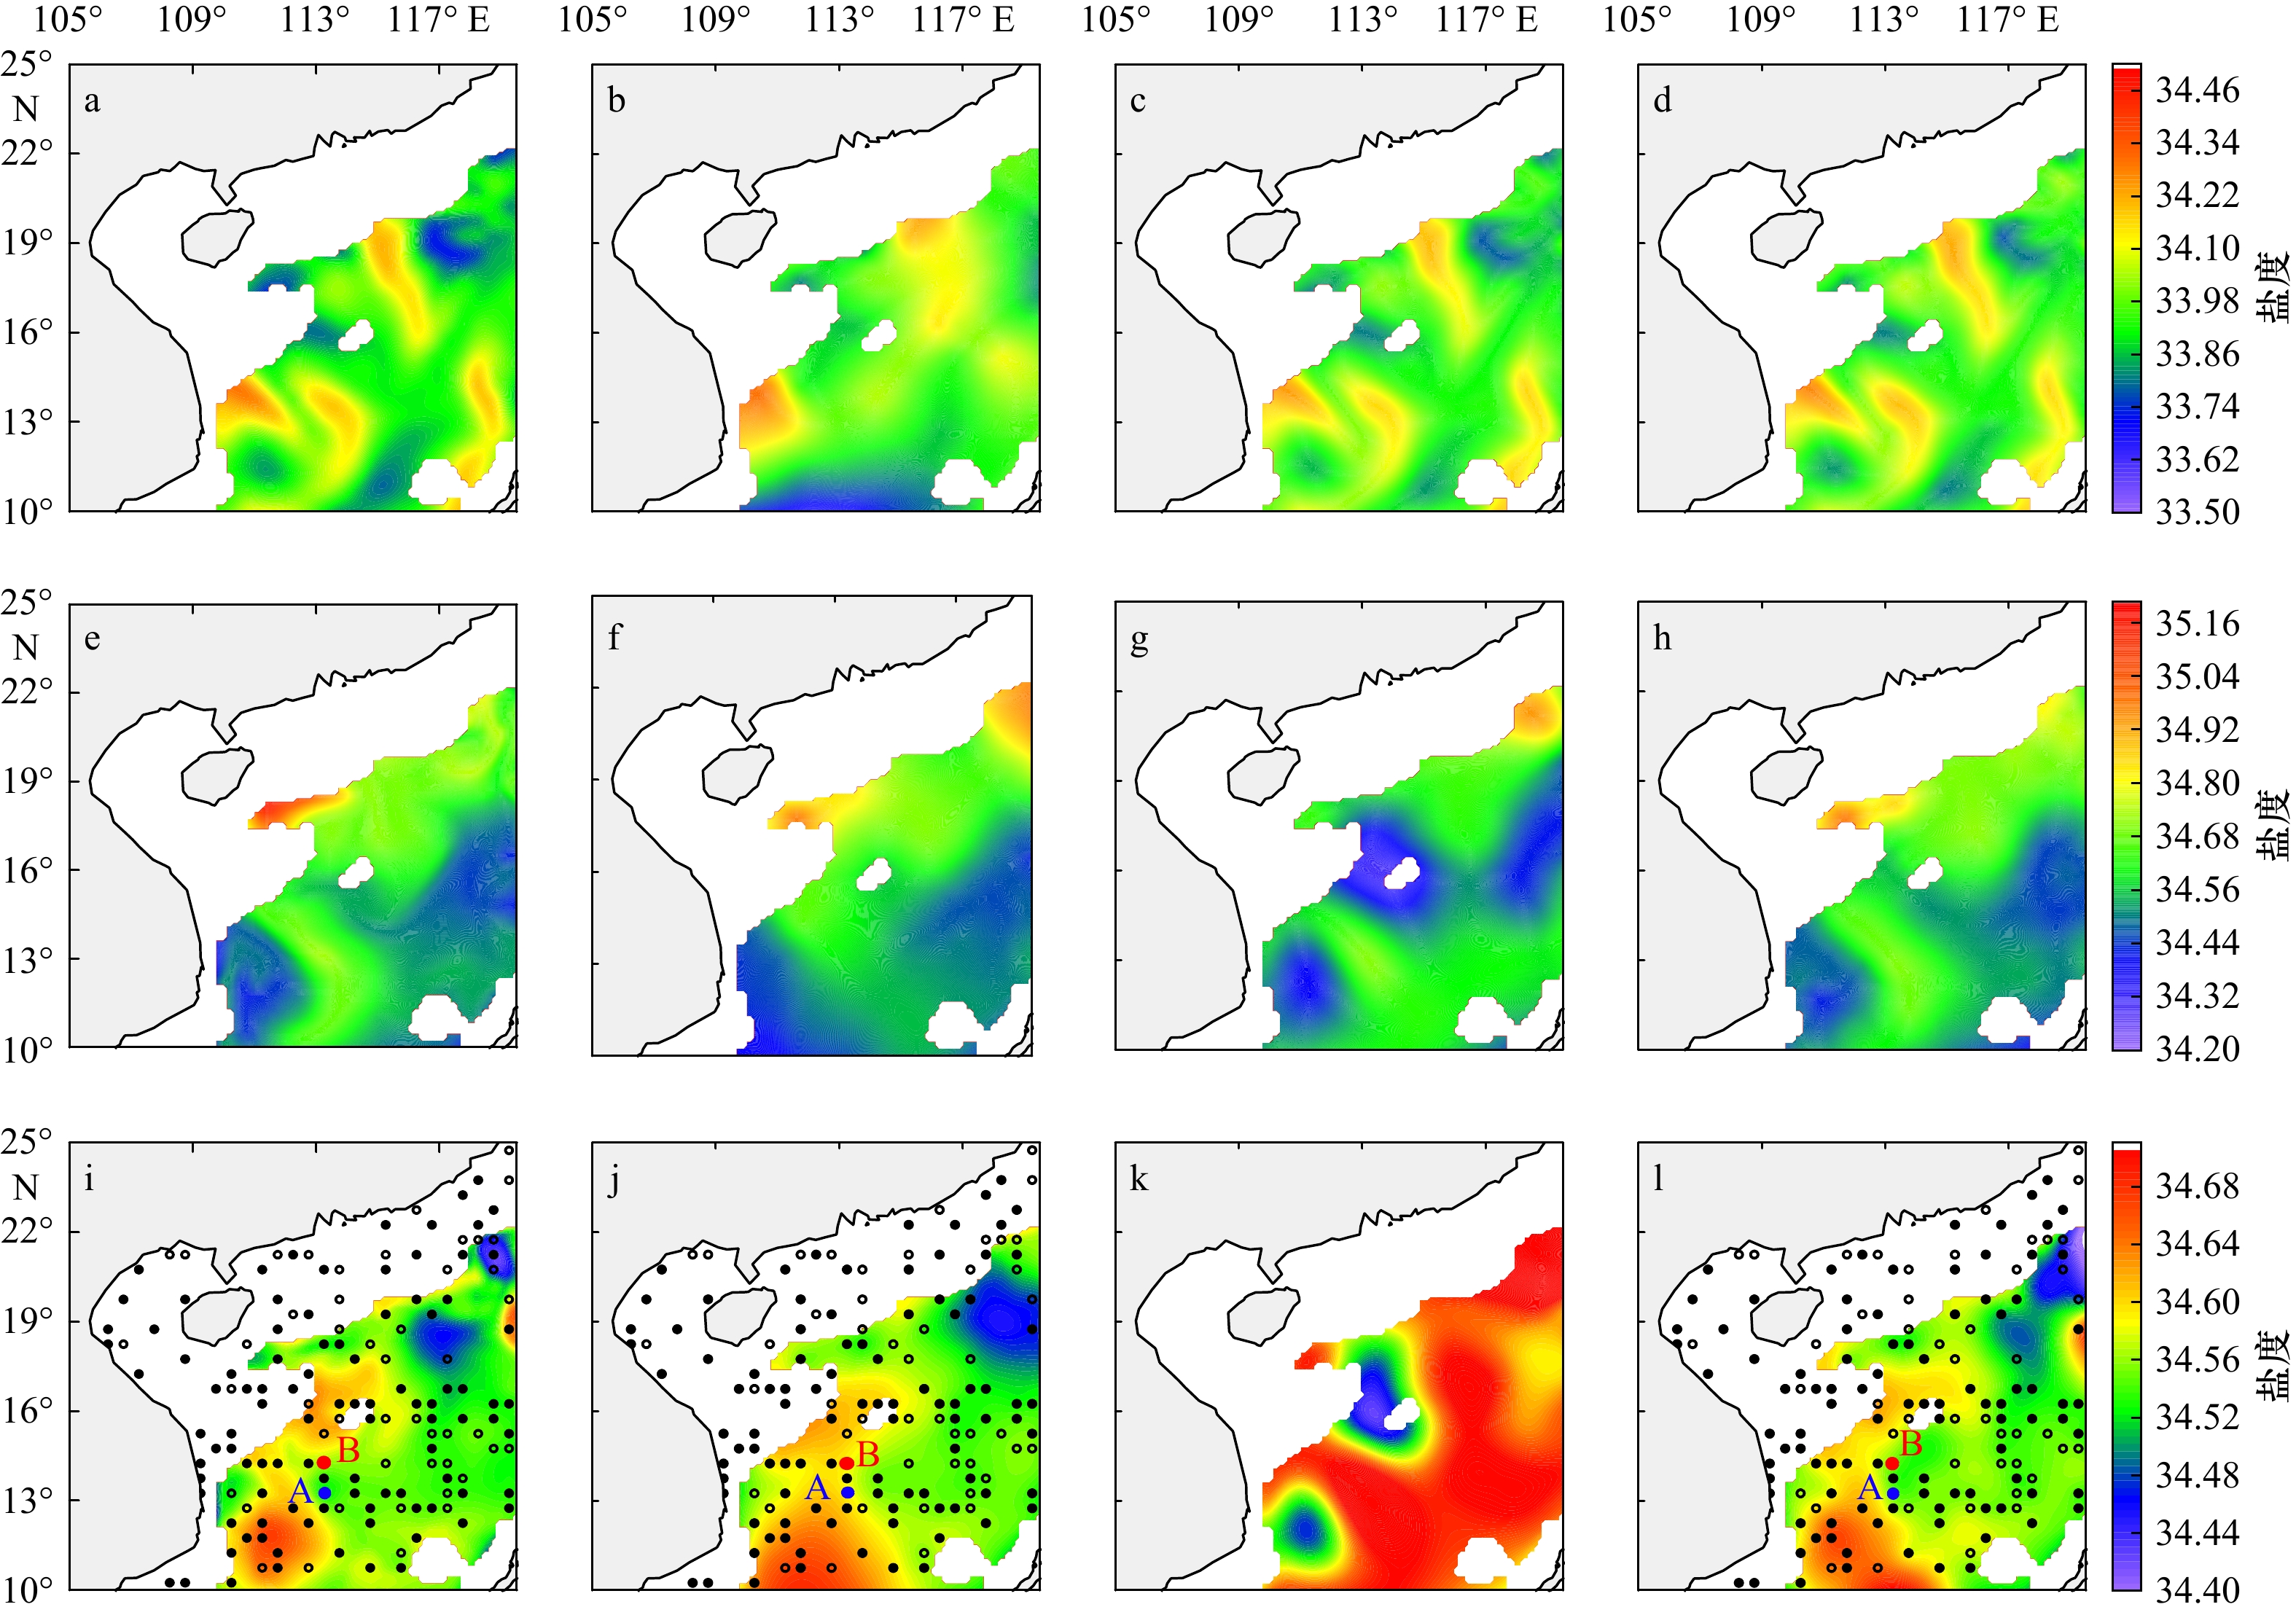
图 3 真实场与3组试验方案的不同深度层盐度分布
a、e、i分别为真实的10 m、100 m、200 m盐度场;b、f、j分别为方案1的10 m、100 m、200 m盐度场;c、g、k分别为方案2的10 m、100 m、200 m盐度场;d、h、l分别为方案3的10 m、100 m、200 m盐度场;A、B两点为挑选出的特殊观测点
Fig. 3 Salinity distribution of different depth layers of the real field and three sets of experimental schemes
a, e, i. The salinity fields of true fields in 10 m, 100 m and 200 m, respectively; b, f, j. the salinity fields of Scheme 1 in 10 m, 100 m and 200 m, respectively; c, g, k. the salinity fields of Scheme 2 in 10 m, 100 m and 200 m, respectively; d, h, l. the salinity fields of Scheme 3 in 10 m, 100 m and 200 m, respectively; points A and B are selected special observation points
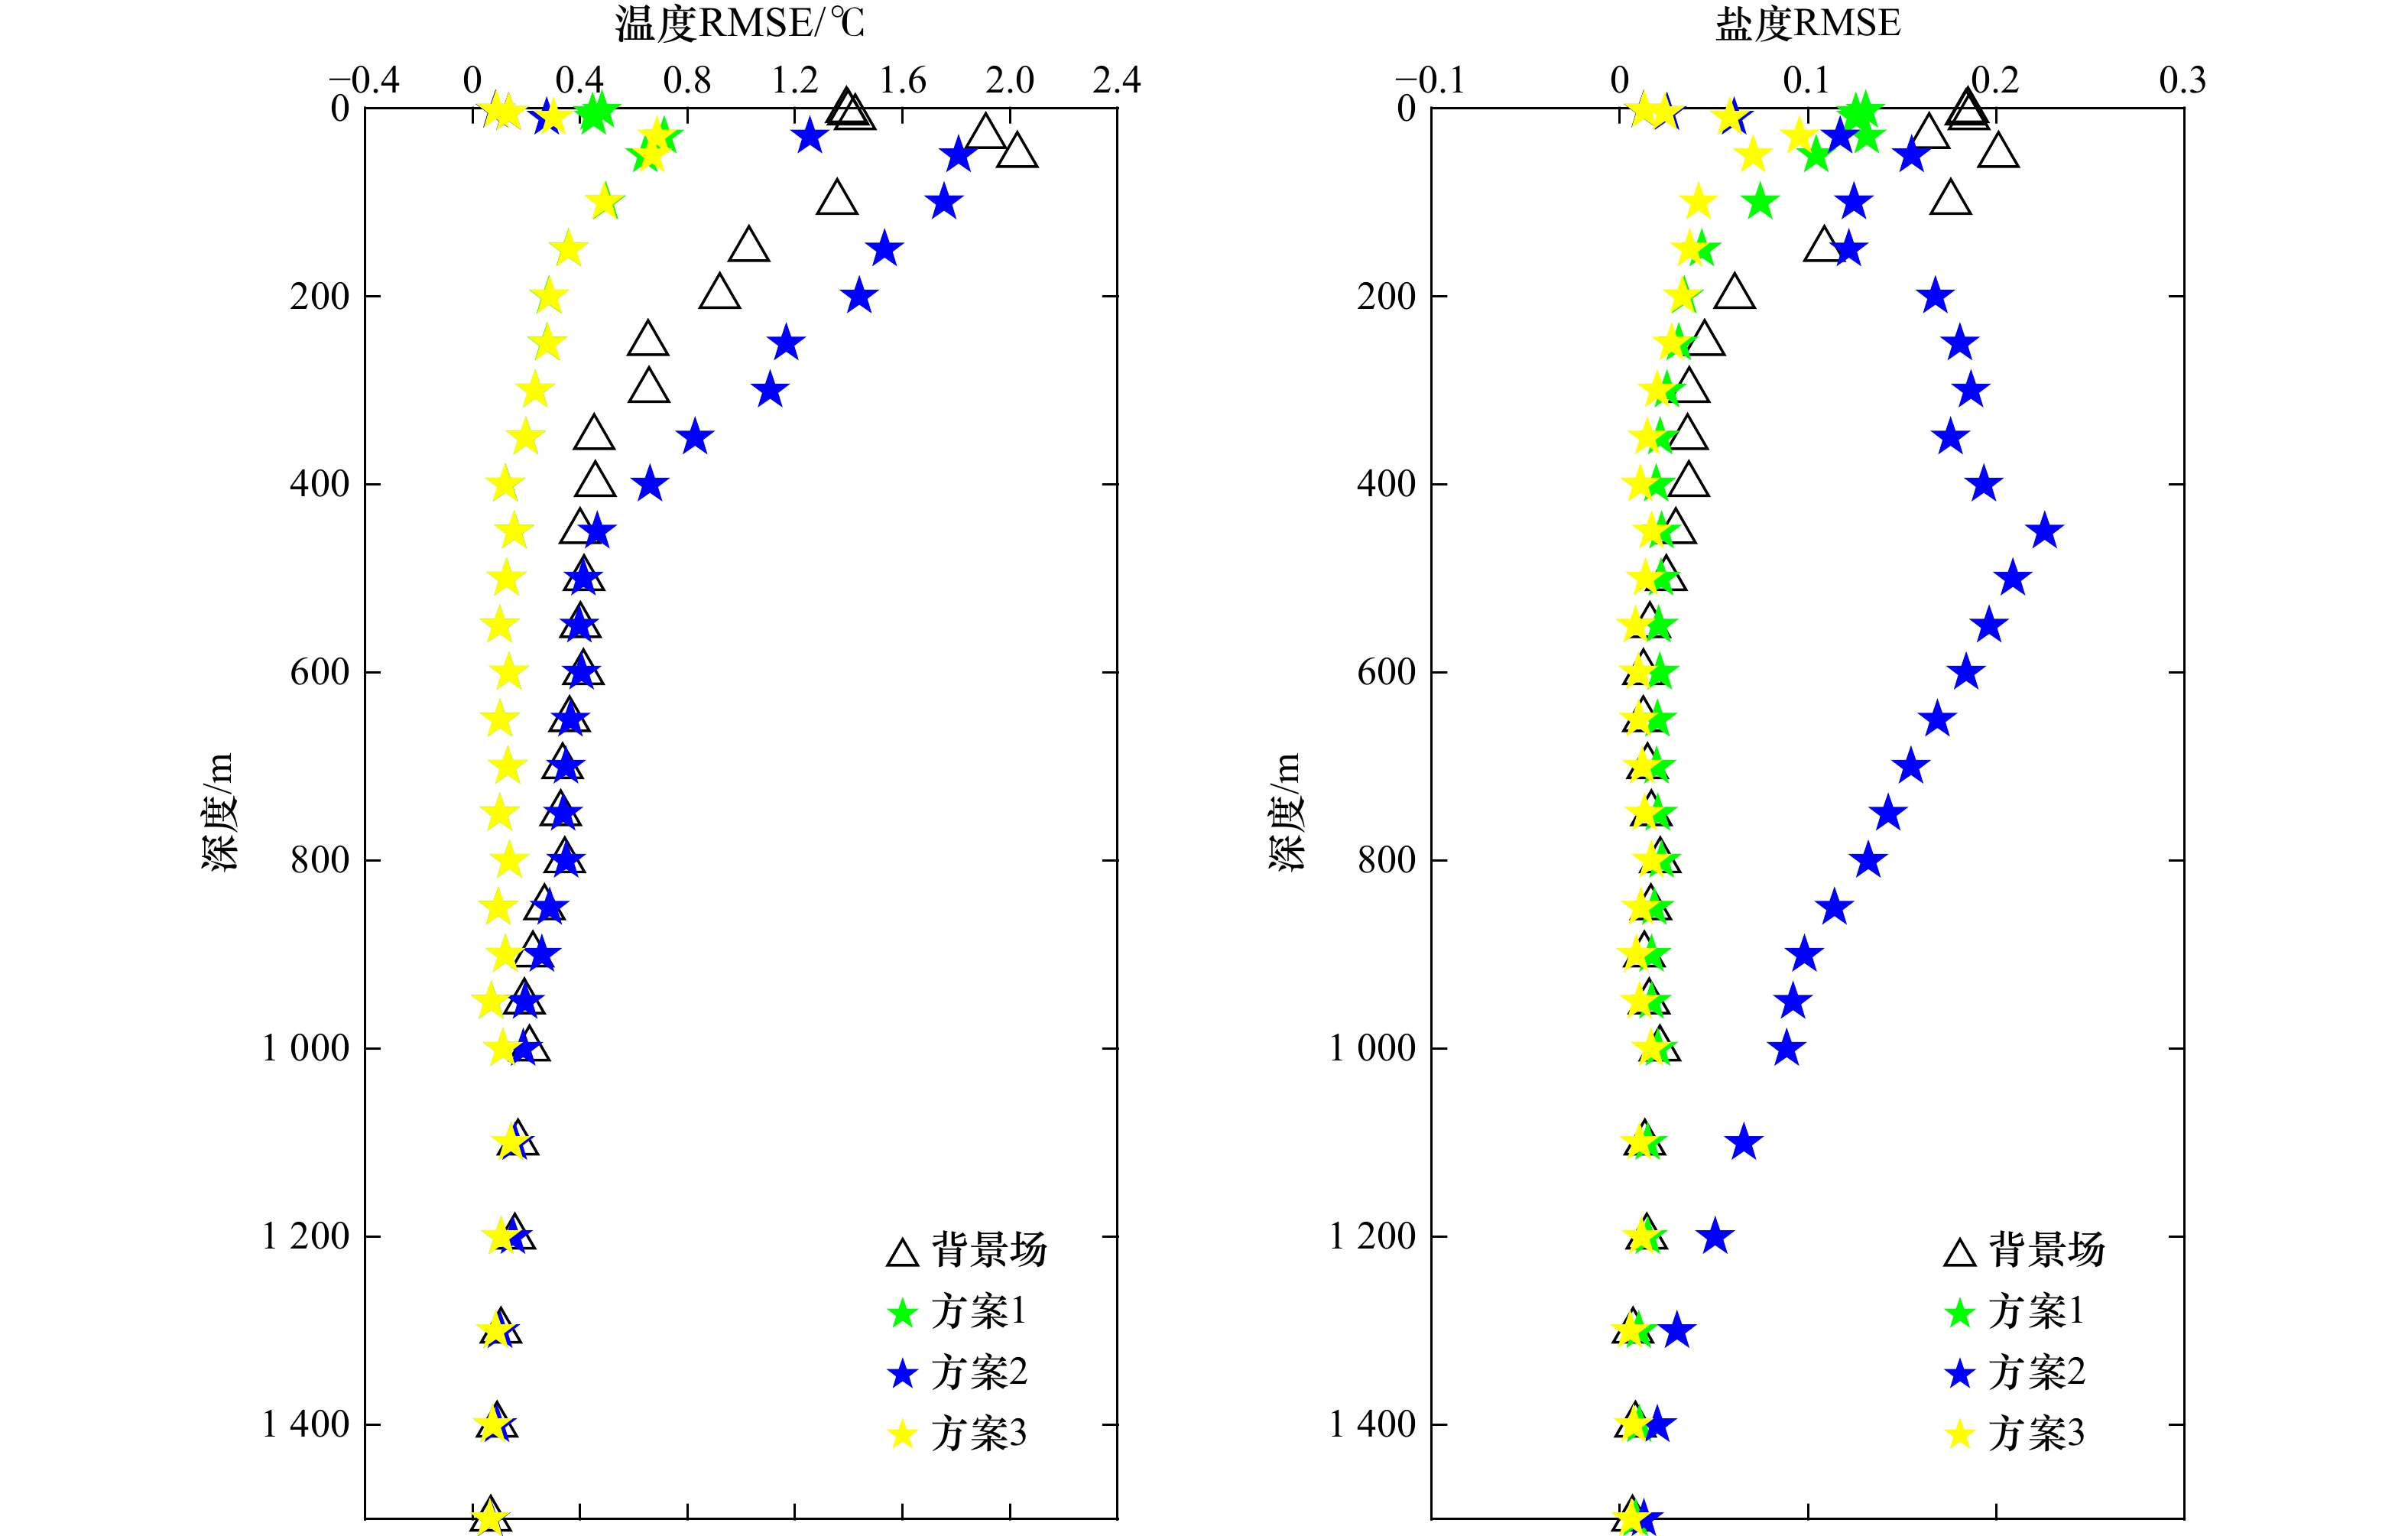
图 4 温度和盐度垂向均方根误差(RMSE)分布
Fig. 4 Vertical root mean square error (RMSE) distribution of temperature and salinity

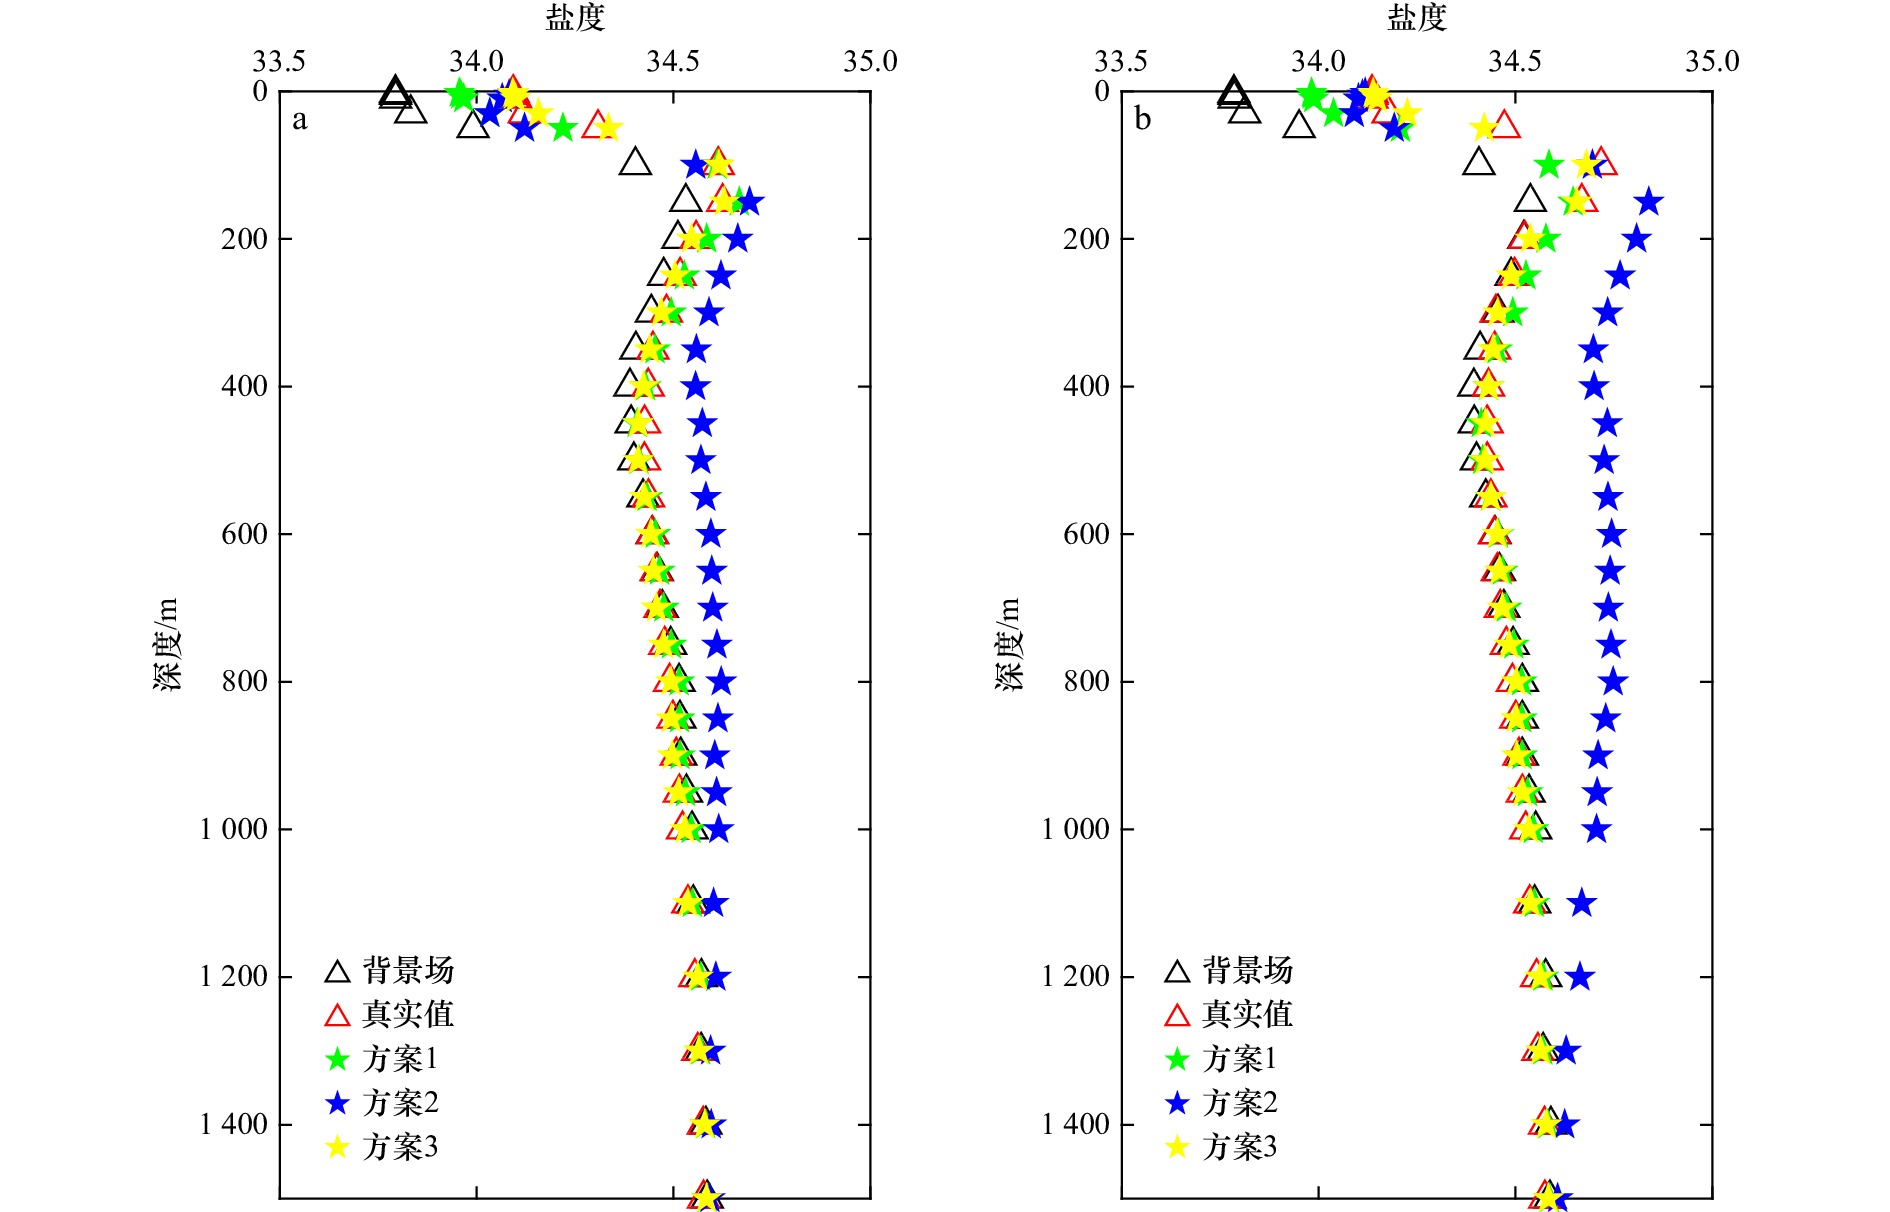
图 6 不同试验方案盐度断面图
a. 多年月平均气候态盐度断面;b. 真实盐度断面;c−e分别为方案1、2、3的盐度断面图
Fig. 6 Cross-sectional view of salinity for different experimental schemes
a. Multi-year monthly average climatic salinity section; b. true salinity section; c−e. salinity section of scheme 1, 2 and 3
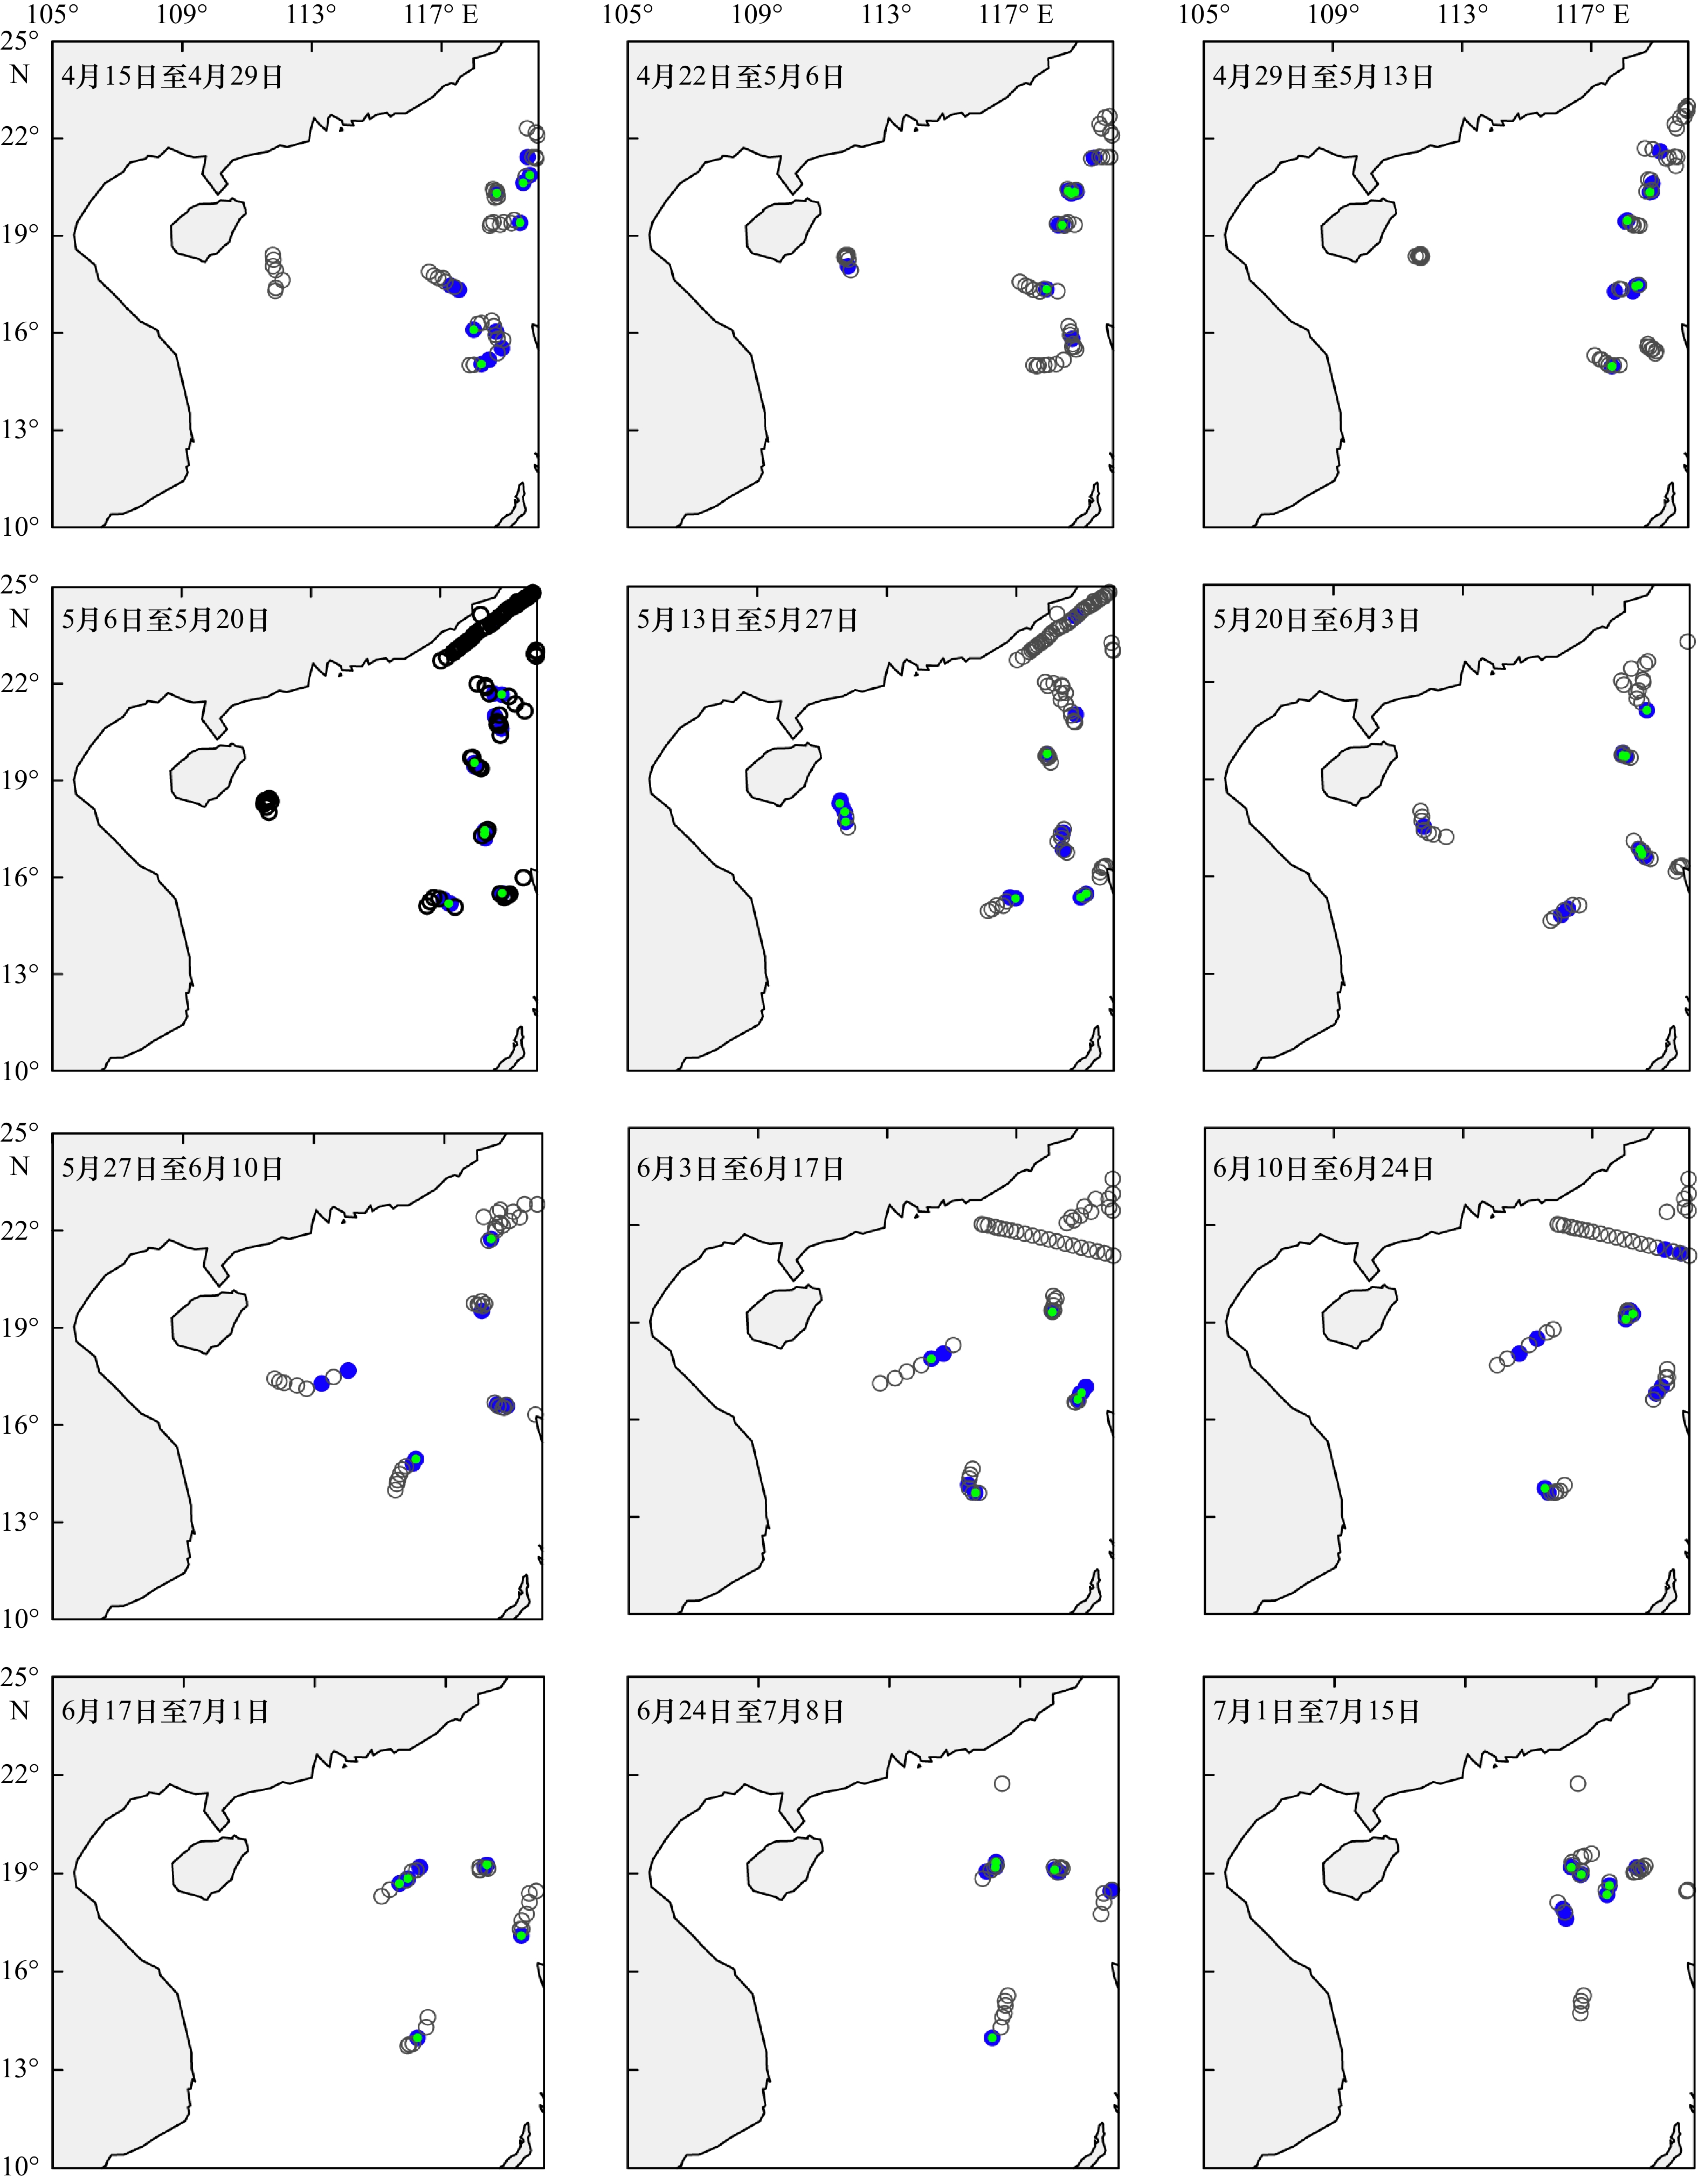
图 7 每组试验的温盐现场观测位置分布
黑色空心圆圈表示真实试验同化的现场观测位置;蓝色实心圆圈表示随机抽取的仅包含温度的独立观测位置;绿色实心圆圈表示随机抽取的既有温度又有盐度的独立观测位置
Fig. 7 Location distributions of observations of temperature and salinity for each set of trials
The black hollow circle represents the observation of assimilation in the true test; the blue solid circle represents randomly selected independent observation locations that contain only temperature; the green solid circle represents randomly selected independent observation locations with both temperature and salinity
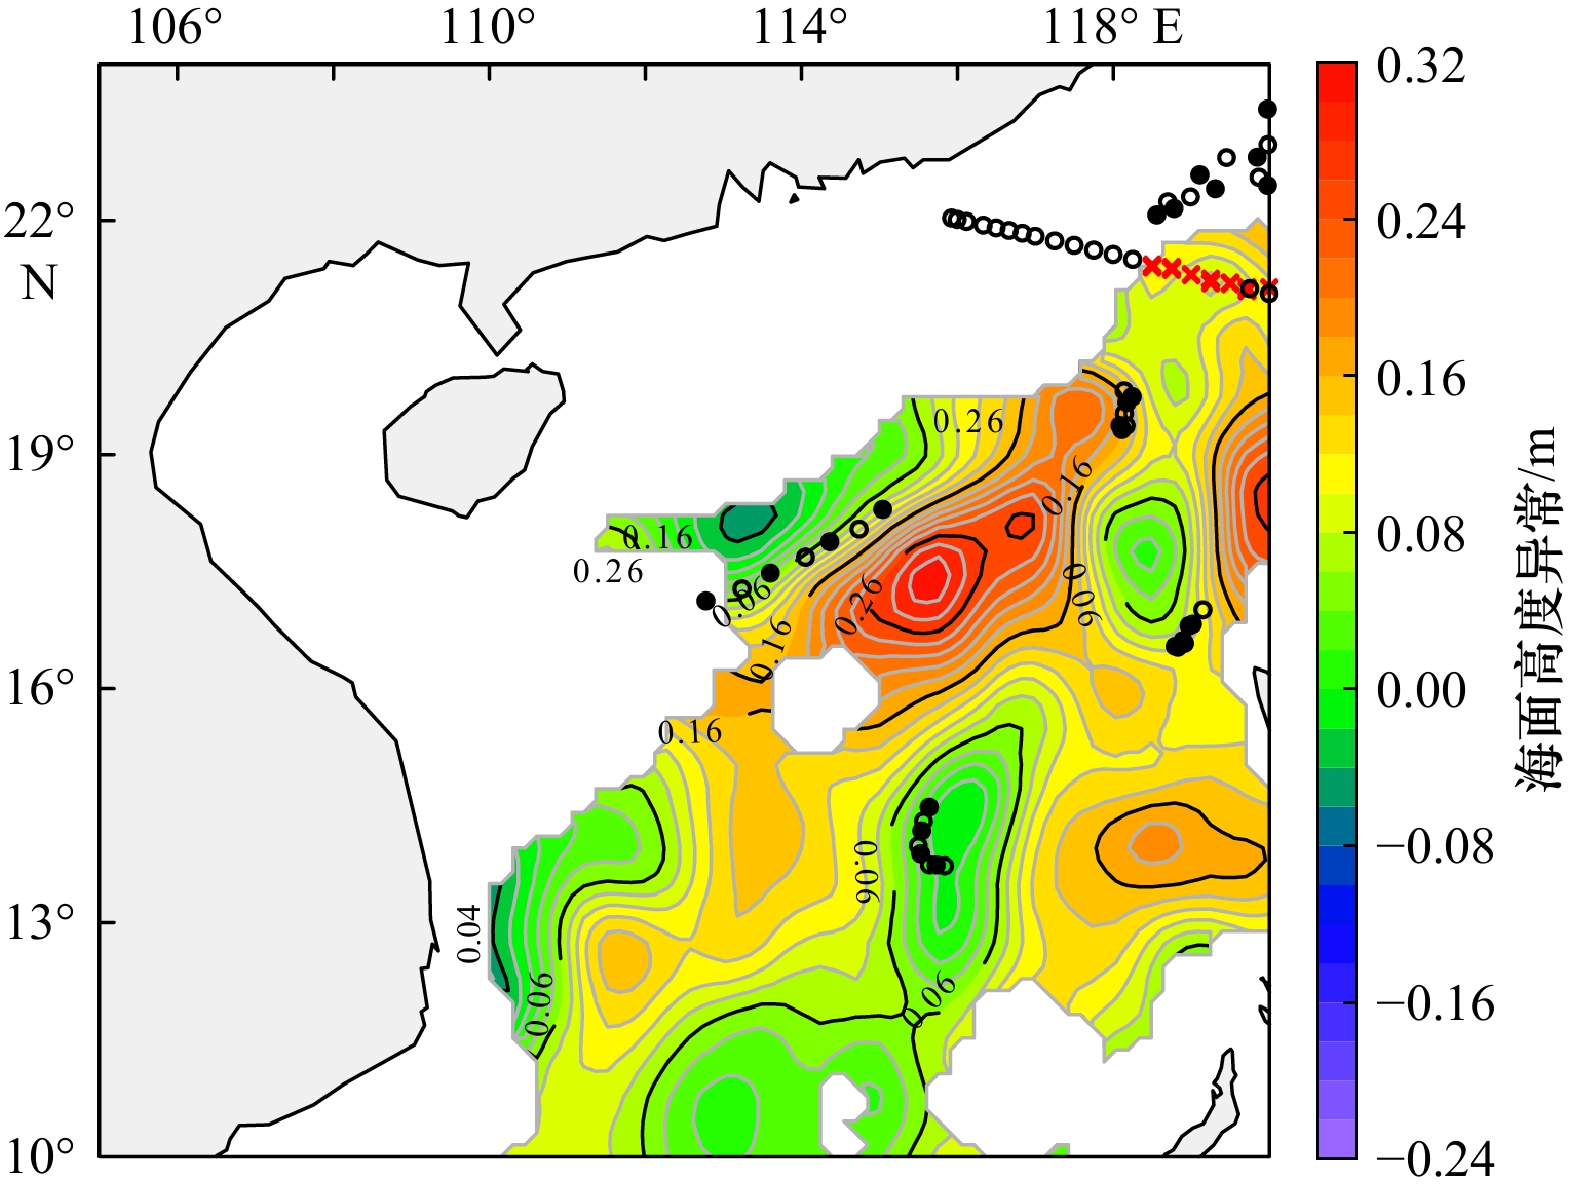
图 10 独立观测位置
空心圆圈为温度观测点,实心圆点为温盐观测点,红色叉号为抽取的独立观测点
Fig. 10 Independent observation locations
The hollow circle is the temperature observation point, and the solid circle point is the temperature salt observation point, and the red cross is the extracted independent observation point
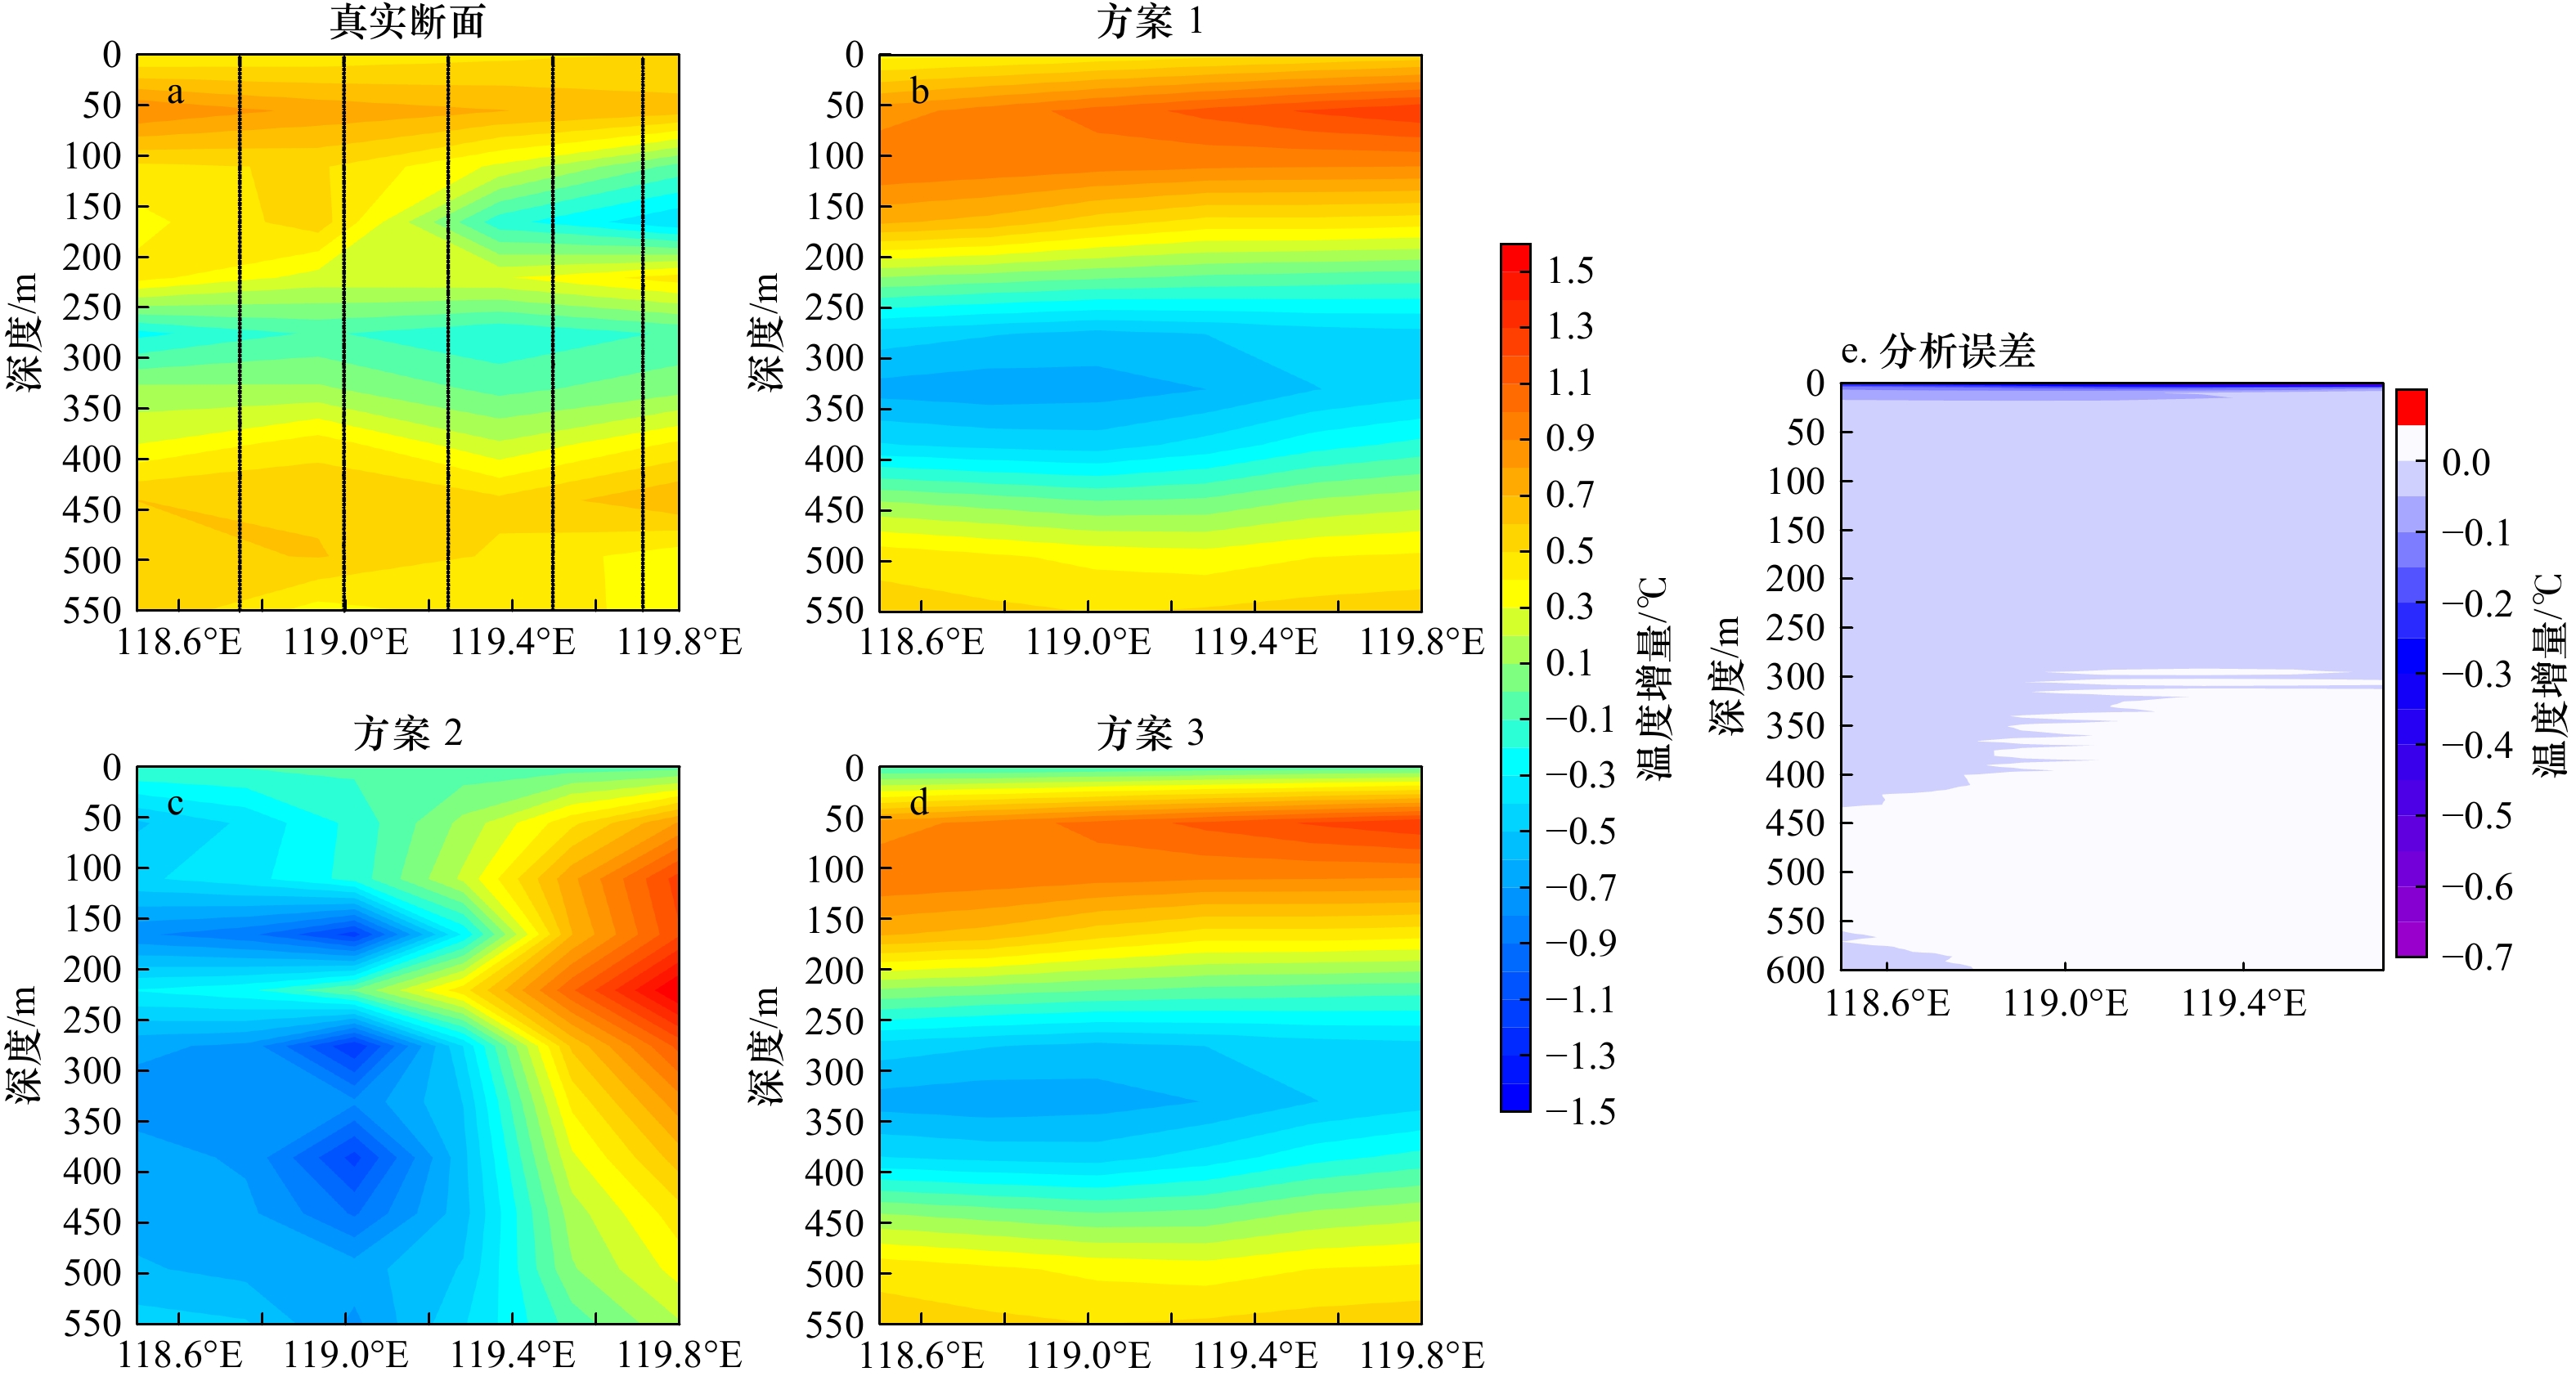
图 11 不同方案温度分析增量断面及分析误差
黑色实线表示独立现场观测的位置,e为方案3的分析误差减去方案1的分析误差得到的误差改进图
Fig. 11 Incremental cross-sectional views of temperature analysis for different schemes and the analysis error
The solid black lines indicate the location of independent field observations. And e is the error improvement plot of the analysis error of Scheme 3 minus the analysis error of Scheme 1

图 13 不同方案的海面温度分析增量分布
a. 海面温度真实场;b−d分别为方案1、2、3的海面温度分析增量
Fig. 13 Distribution of the sea surface temperature analysis increment for different schemes
a. The sea surface temperature of true field; b−d. the sea surface temperature analysis increment of schemes 1, 2 and 3
表 1 孪生试验的试验设置
Tab. 1 Test setting of twin test
试验方案 同化的观测资料分辨率 最密分析网格 动力高度积分起始深度 T、S SSHa、SST、 SSS 网格重数 格点数(经向 × 纬向 × 垂向) 分辨率 方案1 随机分布 无 8 129 × 129 × 33 水平:0.11° 1 500 m 方案2 无 0.25° 8 129 × 129 × 33 水平:0.11° 1 500 m 方案3 随机分布 0.25° 8 129 × 129 × 33 水平:0.11° 1 500 m  下载: 导出CSV
表 2 真实试验的试验设置
Tab. 2 Test setting of real test
试验方案 观测数据分辨率 最密分析网格 动力高度积分起始深度 T、S SSHa、SST 网格重数 格点数
(经向×纬向×垂向×时间)分辨率 方案1 随机分布 无 7 65×65×33×3 水平:0.23°;
时间:1周1 500 m 方案2 无 水平:0.25°;
时间:1 d7 65×65×33×3 水平:0.23°;
时间:1周1 500 m 方案3 随机分布 水平:0.25°;
时间:1 d7 65×65×33×3 水平:0.23°;
时间:1周1 500 m
下载: 导出CSV
-
[1] Stammer D. Global characteristics of ocean variability estimated from regional TOPEX/POSEIDON altimeter measurements[J]. Journal of Physical Oceanography, 1997, 27(8): 1743−1769. doi: 10.1175/1520-0485(1997)027<1743:GCOOVE>2.0.CO;2 [2] 尹路, 李延斌, 马金钢. 海洋观测技术现状综述[J]. 舰船电子工程, 2013, 33(11): 4−7, 13.Yin Lu, Li Yanbin, Ma Jingang. Present status of marine observation technology[J]. Ship Electronic Engineering, 2013, 33(11): 4−7, 13. [3] 朱光文. 我国海洋观测技术的现状、差距及其发展[J]. 海洋技术, 1991, 10(3): 1−22.Zhu Guangwen. Status, problems and future development of oceanographic observation technique in China[J]. Ocean Technology, 1991, 10(3): 1−22. [4] Carton J A, Giese B S, Cao Xianhe, et al. Impact of altimeter, thermistor, and expendable bathythermograph data on retrospective analyses of the tropical Pacific Ocean[J]. Journal of Geophysical Research: Oceans, 1996, 101(C6): 14147−14159. doi: 10.1029/96JC00631 [5] Fischer M, Latif M, Flügel M, et al. The impact of data assimilation on ENSO simulations and predictions[J]. Monthly Weather Review, 1997, 125(5): 819−829. doi: 10.1175/1520-0493(1997)125<0819:TIODAO>2.0.CO;2 [6] Ji Ming, Reynolds R W, Behringer D W. Use of TOPEX/Poseidon sea level data for ocean analyses and ENSO prediction: some early results[J]. Journal of Climate, 2000, 13(1): 216−231. doi: 10.1175/1520-0442(2000)013<0216:UOTPSL>2.0.CO;2 [7] Carman J C, Eleuterio D P, Gallaudet T C, et al. The national earth system prediction capability: coordinating the giant[J]. Bulletin of the American Meteorological Society, 2017, 98(2): 239−252. doi: 10.1175/BAMS-D-16-0002.1 [8] 王辉, 万莉颖, 秦英豪, 等. 中国全球业务化海洋学预报系统的发展和应用[J]. 地球科学进展, 2016, 31(10): 1090−1104.Wang Hui, Wan Liying, Qin Yinghao, et al. Development and application of the Chinese global operational oceanography forecasting system[J]. Advances in Earth Science, 2016, 31(10): 1090−1104. [9] Fox D N, Teague W J, Barron C N, et al. The modular ocean data assimilation system (MODAS)[J]. Journal of Atmospheric and Oceanic Technology, 2002, 19(2): 240−252. doi: 10.1175/1520-0426(2002)019<0240:TMODAS>2.0.CO;2 [10] Helber R W, Townsend T L, Barron C N, et al. Validation test report for the improved synthetic ocean profile (ISOP) system, part I: synthetic profile methods and algorithm[R]. Washington: Naval Research Laboratory, 2013. [11] 王喜冬, 韩桂军, 李威, 等. 利用卫星观测海面信息反演三维温度场[J]. 热带海洋学报, 2011, 30(6): 10−17.Wang Xidong, Han Guijun, Li Wei, et al. Reconstruction of ocean temperature profile using satellite observations[J]. Journal of Tropical Oceanography, 2011, 30(6): 10−17. [12] Fox D N, Barron C N, Carnes M R, et al. The modular ocean data assimilation system[J]. Oceanography, 2002, 15(1): 22−28. doi: 10.5670/oceanog.2002.33 [13] Guinehut S, Le Traon P Y, Larnicol G, et al. Combining Argo and remote-sensing data to estimate the ocean three dimensional temperature fields: a first approach based on simulated observations[J]. Journal of Marine Systems, 2004, 46(1/4): 85−98. [14] Guinehut S, Dhomps A L, Larnicol G, et al. High resolution 3-D temperature and salinity fields derived from in situ and satellite observations[J]. Ocean Science, 2012, 8(5): 845−857. doi: 10.5194/os-8-845-2012 [15] Mulet S, Rio M H, Mignot A, et al. A new estimate of the global 3D geostrophic ocean circulation based on satellite data and in-situ measurements[J]. Deep-Sea Research Part Ⅱ: Topical Studies in Oceanography, 2012, 77−80: 70−81. doi: 10.1016/j.dsr2.2012.04.012 [16] 朱江, 周广庆, 闫长香, 等. 一个三维变分海洋资料同化系统的设计和初步应用[J]. 中国科学 D辑: 地球科学, 2006, 49(11): 1212−1222. doi: 10.1007/s11430-006-1212-9Zhu Jiang, Zhou Guangqing, Yan Changxiang, et al. A three-dimensional variational ocean data assimilation system: scheme and preliminary results[J]. Science in China Series D: Earth Sciences, 2006, 49(11): 1212−1222. doi: 10.1007/s11430-006-1212-9 [17] Cooper M, Haines K. Altimetric assimilation with water property conservation[J]. Journal of Geophysical Research: Oceans, 1996, 101(C1): 1059−1077. doi: 10.1029/95JC02902 [18] Alves J O S, Haines K, Anderson D L T. Sea level assimilation experiments in the Tropical Pacific[J]. Journal of Physical Oceanography, 2001, 31(2): 305−323. doi: 10.1175/1520-0485(2001)031<0305:SLAEIT>2.0.CO;2 [19] Molteni F, Buizza R, Palmer T N, et al. The ECMWF ensemble prediction system: methodology and validation[J]. Quarterly Journal of the Royal Meteorological Society, 1996, 122(529): 73−119. doi: 10.1002/qj.49712252905 [20] Mullen S L, Buizza R. Quantitative precipitation forecasts over the United States by the ECMWF ensemble prediction system[J]. Monthly Weather Review, 2001, 129(4): 638−663. doi: 10.1175/1520-0493(2001)129<0638:QPFOTU>2.0.CO;2 [21] 李威. 台湾以东黑潮锋的数值研究[D]. 青岛: 中国海洋大学, 2008.Li Wei. Numerical study of the kuroshio front to the east of Taiwan[D]. Qingdao: Ocean University of China, 2008. [22] Li Wei, Xie Yuanfu, He Zhongjie, et al. Application of the multigrid data assimilation scheme to the China Sea’s temperature forecast[J]. Journal of Atmospheric and Oceanic Technology, 2008, 25(11): 2106−2116. doi: 10.1175/2008JTECHO510.1 [23] Li Wei, Xie Yuanfu, Han Guijun. A theoretical study of the multigrid three-dimensional variational data assimilation scheme using a simple bilinear interpolation algorithm[J]. Acta Oceanologica Sinica, 2013, 32(3): 80−87. doi: 10.1007/s13131-013-0292-6 [24] Han Guijun, Li Wei, Zhang Xuefeng, et al. A regional ocean reanalysis system for coastal waters of China and adjacent seas[J]. Advances in Atmospheric Sciences, 2011, 28(3): 682−690. doi: 10.1007/s00376-010-9184-2 [25] Han Guijun, Fu Hongli, Zhang Xuefeng, et al. A global ocean reanalysis product in the China Ocean Reanalysis (CORA) project[J]. Advances in Atmospheric Sciences, 2013, 30(6): 1621−1631. doi: 10.1007/s00376-013-2198-9 [26] Good S A, Martin M J, Rayner N A. EN4: quality controlled ocean temperature and salinity profiles and monthly objective analyses with uncertainty estimates[J]. Journal of Geophysical Research: Oceans, 2013, 118(12): 6704−6716. doi: 10.1002/2013JC009067 [27] Gouretski V, Cheng Lijing. Correction for systematic errors in the global dataset of temperature profiles from mechanical bathythermographs[J]. Journal of Atmospheric and Oceanic Technology, 2020, 37(5): 841−855. doi: 10.1175/JTECH-D-19-0205.1 -


计量
- 文章访问数: 517
- HTML全文浏览量: 206
- PDF下载量: 58
- 被引次数: 0
