

The analysis on reversal of variation trend in the summer albedo of Antarctic sea-ice zone from 1983 to 2022
-
摘要: 海冰区反照率会影响辐射收支平衡,对全球气候变化有着重要影响。利用遥感反演的反照率数据产品分析了1983–2022年南极及其6个海域夏季海冰区反照率的时空变化,探讨了海冰密集度、气温和大气环流与海冰区反照率的关系。结果表明,卫星反演的南极夏季海冰区反照率与实测反照率结果一致。西威德尔海海冰区多年平均反照率最高(0.61),罗斯海最低(0.45)。南极夏季海冰区反照率经历了先上升(1983–2015年)后快速下降(2015–2022年)的变化。除了别林斯高晋海–阿蒙森海海冰区反照率前后两个时段均下降外,其余5个海域和南极一样出现了变化趋势的反转。南极海冰区反照率与海冰密集度显著正相关,而与气温显著负相关。1983–2015年夏季气温降低,海冰消融减弱,海冰密集度微弱上升(0.03%/a),海冰面积平均每10年增加2.07 × 105 km2,导致反射的太阳辐射增多,反照率也微弱上升。2015–2022年夏季气温升高,海冰消融加剧,冰间水道和开阔水域增多,海冰密集度下降,海冰区吸收更多的太阳辐射,造成反射辐射减小,因而海冰区反照率快速下降。此外,南极环状模也是影响罗斯海和威德尔海海冰区反照率变化的因素之一。Abstract: The albedo of Antarctic sea-ice zone (ASZ) can affect the radiation budget and thus has essential influence on global climate change. Using the albedo product from satellite application facility on climate monitoring, the spatio-temporal variations of summer albedo in sea-ice zone from 1983 to 2022 in Antarctica and six sea sectors were analyzed, the relationships between ASZ albedo and sea ice concentration (SIC), air temperature and atmospheric circulation were also quantified. Results show that the albedo retrieved from satellite is consistent to that obtained from in situ observations and thus the satellite-based albedo is reliable. Among the six sea sectors, Weddell West has the highest multi-year averaged albedo of 0.61, whilst Ross Sea features the lowest one of 0.45. Albedo of ASZ in summer experienced gradual increases before 2015 followed by the rapid decline (2015–2022). All sea sectors have similar ASZ albedo variations to that of Antarctica, excepting for Bellingshausen-Amundsen Seas where decreases can be found in both two periods. ASZ albedo is positively correlated to SIC and negatively related to air temperature. From 1983 to 2015, the decreased summer air temperature weakened the sea ice ablation and the SIC increased slightly (0.03%/a), sea ice area increased by 2.07 × 10⁵ km2 per decade on average, all of these led to the increase of reflected solar radiation and sea-ice zone albedo. During the summer from 2015 to 2022, as the increased temperature enhanced the sea ice ablation, more leads and open water appeared, and then decreased the SIC. The sea-ice zone thus absorbed more solar radiation and had less reflected radiation, which leads to a rapid decline of the albedo. In addition, the Antarctic annular mode is one of the driving factors changing the albedo in sea-ice zone in the Ross Sea and Weddell Sea.
-
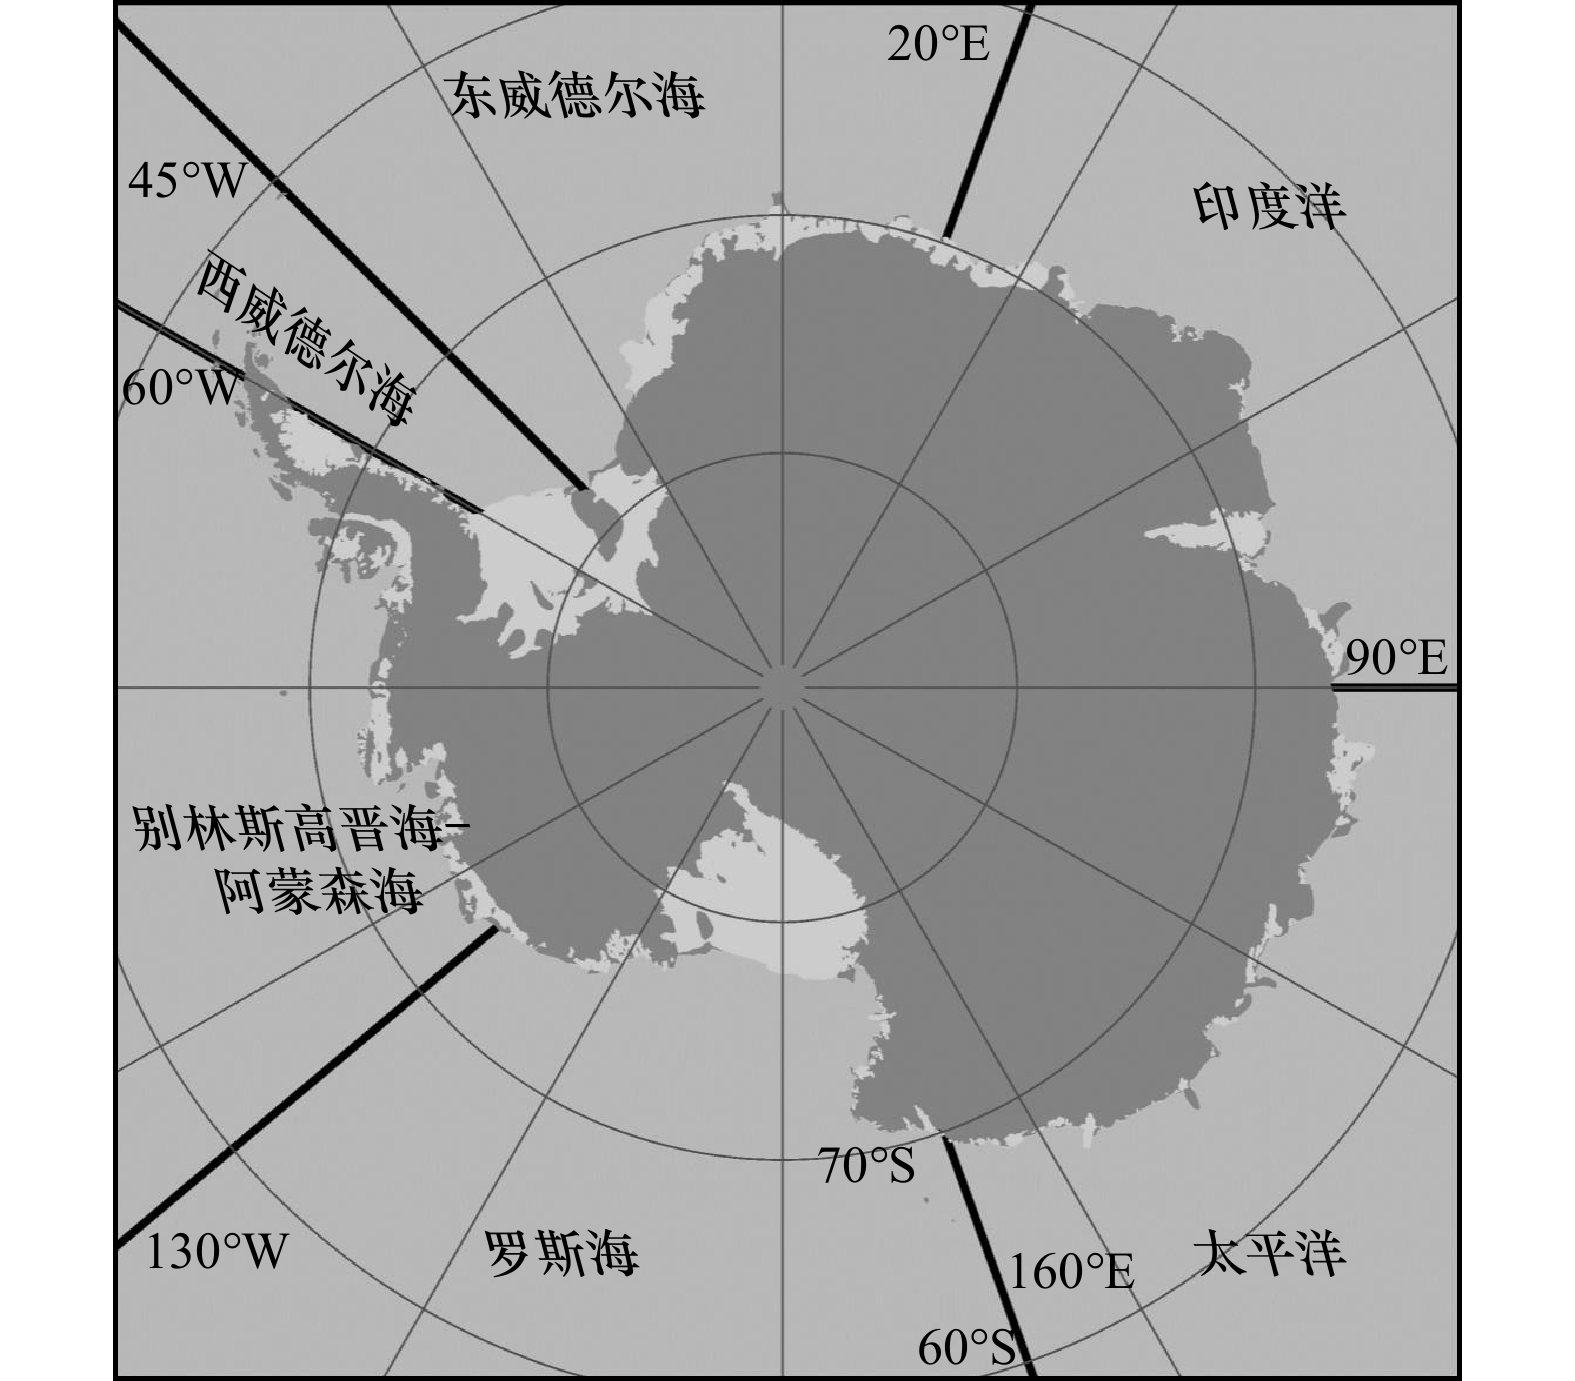

图 2 1983–2022年南极夏季(a)以及12月、翌年1月和2月(b)海冰区反照率变化
Fig. 2 The albedo variations in Antarctic sea ice regions in summer (a), and December, January and February of the following year (b) from 1983 to 2022

图 3 1983–2022年南极6个海域夏季海冰区反照率变化
Fig. 3 The albedo variations in sea ice regions of Antarctica and six sea sectors in summer from 1983 to 2022
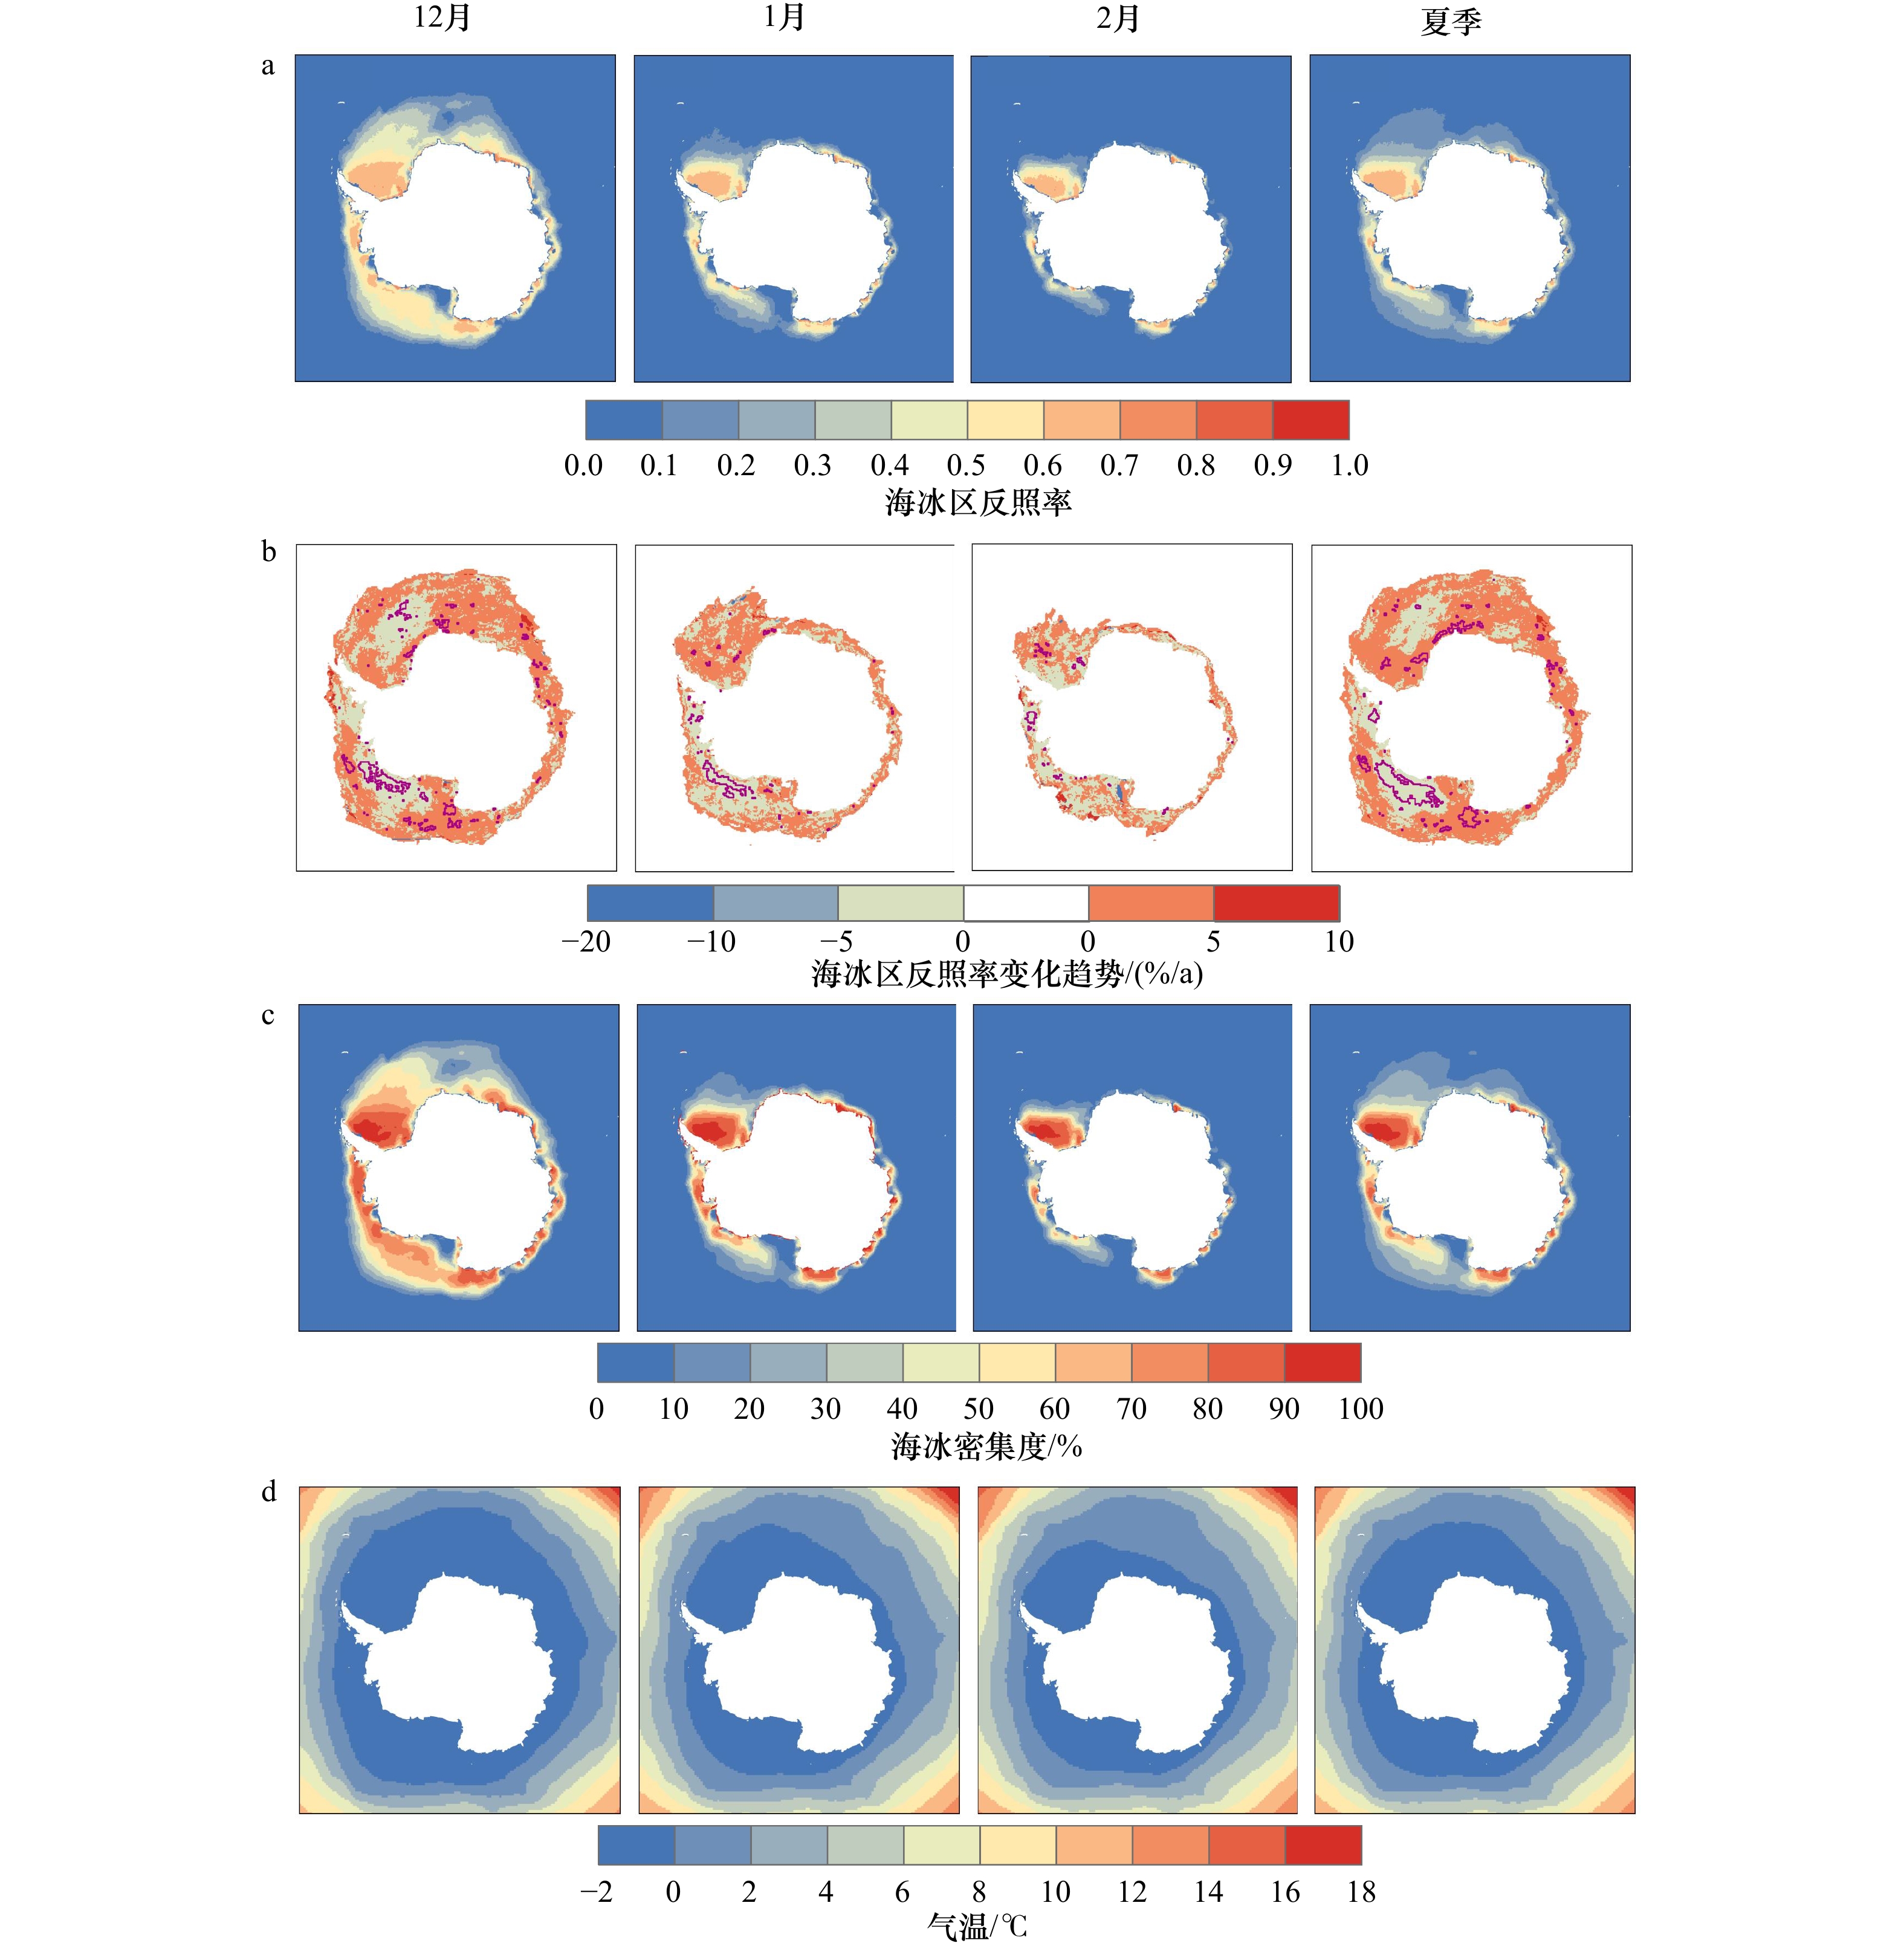
图 4 1983–2022年南极夏季及其不同月份平均海冰区反照率(a)、海冰区反照率变化趋势(b)、平均海冰密集度(c)和平均气温的空间分布(d)
图b中紫色框所指区域通过了95%显著性水平检验
Fig. 4 The spatial distributions of averaged albedo in sea ice region (a), variation trend of averaged albedo in sea ice region (b), averaged sea ice concentration (c) and averaged air temperature (d) in summer and individual month in Antarctica from 1983 to 2022
Regions indicated by purple box in figure b means these trends above 95% significance level
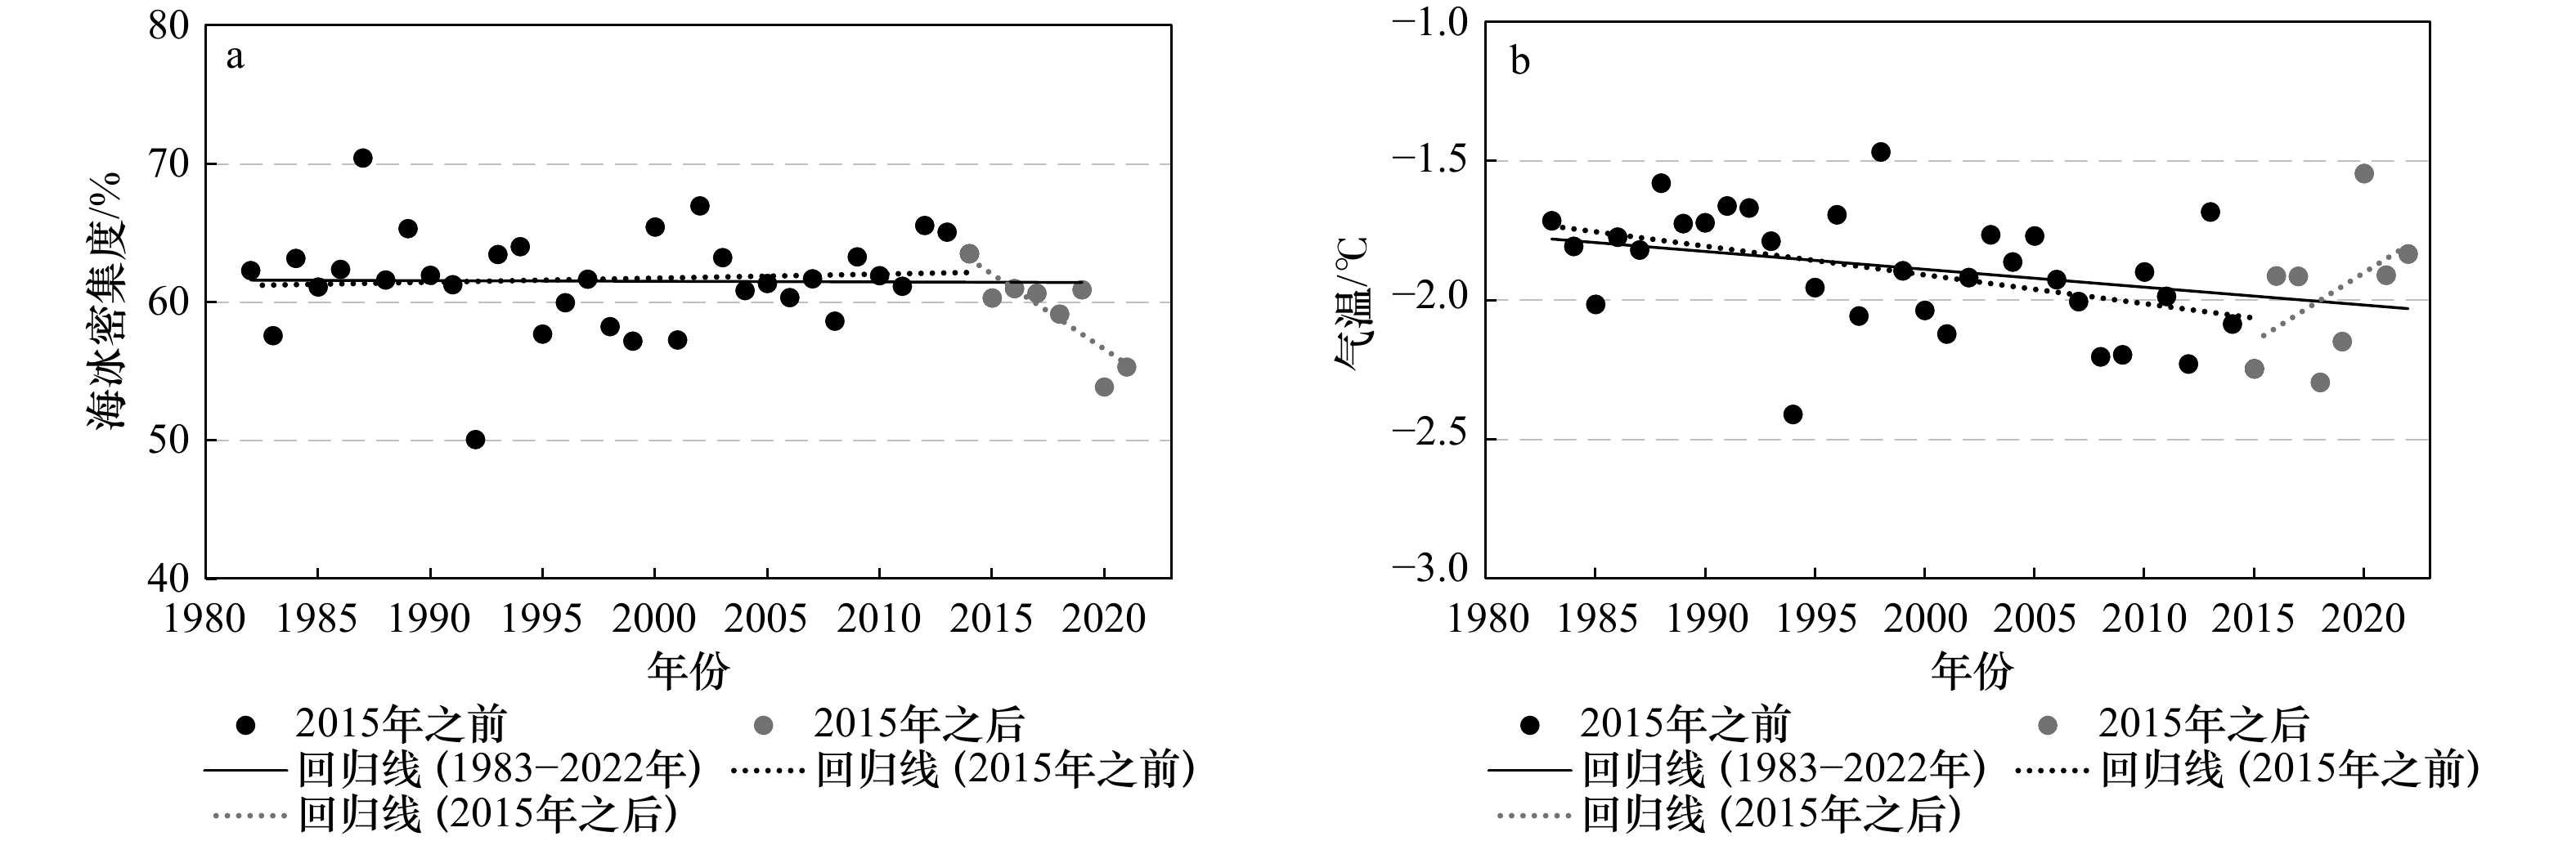
图 5 1983–2022年南极夏季海冰密集度(a)和气温(b)的变化
Fig. 5 The variations of summer sea ice concentration (a) and air temperature (b) in Antarctica from 1983 to 2022

图 6 1983–2022年南极夏季海冰区反照率与海冰密集度(a)和气温(b)的关系
Fig. 6 The relationships between albedo in sea ice regions and sea ice concentration (a) and air temperature (b) of Antarctica in summer from 1983 to 2022

图 7 1983–2022年南极夏季SAM变化(a)和SAM与海冰区反照率的关系(b)
图b中黑色框所指区域通过了95%显著性水平检验
Fig. 7 Changes in summer Antarctic SAM from 1983 to 2022 (a) and the relationship between albedo in sea ice regions and SAM of Antarctica in summer (b)
Regions indicated by black box in figure b means these trends above 95% significance level
表 1 2019年1–2月ICDR CLARA-A2与CLARA-A2海冰区反照率对比
Tab. 1 The comparison between ICDR CLARA-A2 albedo and CLARA-A2 albedo of Jan–Feb, 2019
南极海域 ICDR CLARA-A2-SAL CLARA-A2-SAL 1月 2月 1月 2月 别林斯高晋海–阿蒙森海 0.50 0.49 0.50 0.50 印度洋扇区 0.57 0.56 0.57 0.57 太平洋扇区 0.46 0.47 0.47 0.48 罗斯海 0.44 0.46 0.45 0.47 东威德尔海 0.50 0.57 0.50 0.57 西威德尔海 0.59 0.62 0.59 0.62  下载: 导出CSV
表 2 覆盖率加权平均的CLARA-A2反照率与ASPeCt反照率的对比
Tab. 2 The comparison between coverage-weighted CLARA-A2 albedo and ASPeCt albedo
南极海域 ASPeCt CLARA-A2-SAL 别林斯高晋海–阿蒙森海 0.37 0.36 印度洋扇区 0.28 0.26 太平洋扇区 0.36 0.32 罗斯海 0.28 0.28 威德尔海 0.35 0.40
下载: 导出CSV
表 3 1983–2022年南极及其6个海域夏季海冰区反照率平均值和变化速率(%/a)
Tab. 3 The mean value and change rates of albedo (%/a) in sea ice regions of Antarctica and six sea sectors in summer from 1983 to 2022
1983–2022年 1983–2015年 2015–2022年 均值 速率 均值 速率 均值 速率 别林斯高晋海–阿蒙森海 0.51 –0.16* 0.52 –0.19* 0.51 –0.78* 印度洋 0.48 0.07 0.48 0.15* 0.48 –0.53 太平洋 0.50 0.05 0.50 0.20** 0.48 –1.73** 罗斯海 0.45 –0.06 0.46 0.02 0.43 –1.00* 东威德尔海 0.47 0.00 0.48 0.12 0.49 –1.06* 西威德尔海 0.61 0.02 0.61 0.07 0.61 –1.21** 南极 0.50 –0.01 0.50 0.04 0.51 –0.96** 注:**和*分别表示0.01和0.05显著性水平。
下载: 导出CSV
表 4 1983–2022年南极及其6个海域夏季海冰密集度和气温均值及其变化速率
Tab. 4 The mean and change rate of summer sea ice concentration and air temperature in Antarctica and six sea sectors from 1983 to 2022
1983–2022年 1983–2015年 2015–2022年 均值 速率 均值 速率 均值 速率 海冰密集度[均值(%)和速率(%·a–1)] 印度洋扇区 48 0.07 48 0.07 48 0.90 别林斯高晋海–阿蒙森海 61 –0.25 62 –0.44* 61 0.13 罗斯海 52 –0.28** 53 –0.03 43 –0.73 太平洋扇区 62 0.23* 61 0.39** 63 –1.81 东威德尔海 56 –0.01 57 0.29* 51 –1.94 西威德尔海 88 0.05 88 0.07 89 –1.01* 南极 61 –0.05 62 0.03 59 –1.08* 气温[均值(℃)和速率(℃·(10 a)–1] 印度洋扇区 –1.87 –0.04 –1.88 –0.08 –1.85 –0.14 别林斯高晋海–阿蒙森海 –1.46 –0.01 –1.49 –0.08 –1.36 0.18 罗斯海 –1.94 –0.02 –1.94 –0.04 –1.97 1.02* 太平洋扇区 –1.72 –0.03 –1.73 –0.07 –1.70 0.14 东威德尔海 –2.19 –0.08 –2.14 –0.04 –2.42 0.53 西威德尔海 –1.95 –0.16** –1.91 –0.22** –2.16 0.03 南极 –1.91 –0.06* –1.90 –0.10** –1.98 0.50 注:**和*分别表示0.01和0.05显著性水平。
下载: 导出CSV
表 5 1983–2022年南极及其6个海域夏季海冰区反照率与海冰密集度和气温的相关系数及显著性
Tab. 5 Correlation coefficients and corresponding significances between albedo in sea ice region and sea ice concentration and air temperature of Antarctica and six sea sectors in summer from 1983 to 2022
海冰密集度 气温 印度洋扇区 0.55** –0.06 别林斯高晋海–阿蒙森海 0.91** –0.11 罗斯海 0.76** –0.44** 太平洋扇区 0.81** –0.07 东威德尔海 0.78** –0.32* 西威德尔海 0.77** –0.57** 南极 0.59** –0.41** 注:**和*分别表示0.01和0.05显著性水平。
下载: 导出CSV
-
[1] 丁永建, 张世强. 冰冻圈水循环在全球尺度的水文效应[J]. 科学通报, 2015, 60(7): 593−602. doi: 10.1360/N972014-00899Ding Yongjian, Zhang Shiqiang. The hydrological impact of cryosphere water cycle on global-scale water cycle[J]. Chinese Science Bulletin, 2015, 60(7): 593−602. doi: 10.1360/N972014-00899 [2] Curry J A, Schramm J I, Ebert E E. Sea ice-albedo climate feedback mechanism[J]. Journal of Climate, 1995, 8(2): 240−247. doi: 10.1175/1520-0442(1995)008<0240:SIACFM>2.0.CO;2 [3] Kattsov V M, Ryabinin V E, Overland J E, et al. Arctic sea-ice change: a grand challenge of climate science[J]. Journal of Glaciology, 2010, 56(200): 1115−1121. doi: 10.3189/002214311796406176 [4] Dickinson R E. Land surface processes and climate-surface albedos and energy balance[J]. Advances in Geophysics, 1983, 25: 305−353. [5] Holland M M, Landrum L, Raphael M N, et al. The regional, seasonal, and lagged influence of the Amundsen Sea Low on Antarctic sea ice[J]. Geophysical Research Letters, 2018, 45(20): 11227−11234. [6] Holloway G, Sou T. Has Arctic sea ice rapidly thinned?[J]. Journal of Climate, 2002, 15(13): 1691−1701. doi: 10.1175/1520-0442(2002)015<1691:HASIRT>2.0.CO;2 [7] Parkinson C L, Cavalieri D J. Arctic sea ice variability and trends, 1979–2006[J]. Journal of Geophysical Research, 2008, 113(C7): C07003. [8] Massom R A, Eicken H, Hass C, et al. Snow on Antarctic sea ice[J]. Reviews of Geophysics, 2001, 39(3): 413−445. doi: 10.1029/2000RG000085 [9] Riihelä A, Laine V, Manninen T, et al. Validation of the Climate-SAF surface broadband albedo product: comparisons with in situ observations over Greenland and the ice-covered Arctic Ocean[J]. Remote Sensing of Environment, 2010, 114(11): 2779−2790. doi: 10.1016/j.rse.2010.06.014 [10] Laine V, Manninen T, Riihelä A. High temporal resolution estimations of the Arctic sea ice albedo during the melting and refreezing periods of the years 2003–2011[J]. Remote Sensing of Environment, 2014, 140: 604−613. doi: 10.1016/j.rse.2013.10.001 [11] Wang Z, Meredith M P. Density-driven Southern Hemisphere subpolar gyres in coupled climate models[J]. Geophysical Research Letters, 2008, 35(14): L14608. [12] Wang Z, Kuhlbrodt T, Meredith M P. On the response of the Antarctic Circumpolar Current transport to climate change in coupled climate models[J]. Journal of Geophysical Research: Oceans, 2011, 116(C8): C08011. [13] Parkinson C L, Cavalieri D J. Antarctic sea ice variability and trends, 1979–2010[J]. The Cryosphere, 2012, 6(4): 871−880. doi: 10.5194/tc-6-871-2012 [14] He L Y, Ke C Q, Zhou X B, et al. Antarctic sea ice change based on a new sea ice dataset from 1992 to 2008[J]. Climate Research, 2017, 71(2): 155−169. [15] Stammerjohn S, Massom R, Rind D, et al. Regions of rapid sea ice change: an inter-hemispheric seasonal comparison[J]. Geophysical Research Letters, 2012, 39(6): L06501. [16] Simpkins G R, Ciasto L M, England M H. Observed variations in multidecadal Antarctic sea ice trends during 1979–2012[J]. Geophysical Research Letters, 2013, 40(14): 3643−3648. doi: 10.1002/grl.50715 [17] Cavalieri D J, Parkinson C L. Arctic sea ice variability and trends, 1979–2010[J]. The Cryosphere, 2012, 6(4): 881−889. doi: 10.5194/tc-6-881-2012 [18] Laine V. Antarctic ice sheet and sea ice regional albedo and temperature change, 1981–2000, from AVHRR Polar Pathfinder data[J]. Remote Sensing of Environment, 2008, 112(3): 646−667. doi: 10.1016/j.rse.2007.06.005 [19] Raphael M N, Handcock M S. A new record minimum for Antarctic sea ice[J]. Nature Reviews Earth & Environment, 2022, 3(4): 215−216. [20] Turner J, Holmes C, Caton Harrison T, et al. Record low Antarctic sea ice cover in February 2022[J]. Geophysical Research Letters, 2022, 49(12): e2022GL098904. doi: 10.1029/2022GL098904 [21] Eayrs C, Li Xichen, Raphael M N, et al. Rapid decline in Antarctic sea ice in recent years hints at future change[J]. Nature Geoscience, 2021, 14(7): 460−464. doi: 10.1038/s41561-021-00768-3 [22] Parkinson C L. A 40-y record reveals gradual Antarctic sea ice increases followed by decreases at rates far exceeding the rates seen in the Arctic[J]. Proceedings of the National Academy of Sciences of the United States of America, 2019, 116(29): 14414−14423. [23] Zhou Xiaobing, Li Shusun, Morris K, et al. Albedo of summer snow on sea ice, Ross Sea, Antarctica[J]. Journal of Geophysical Research: Earth Surface, 2007, 112(D16): D16105. [24] Pirazzini R. Surface albedo measurements over Antarctic sites in summer[J]. Journal of Geophysical Research: Earth Surface, 2004, 109(D20): D20118. [25] Brandt R E, Warren S G, Worby A P, et al. Surface albedo of the Antarctic sea ice zone[J]. Journal of Climate, 2005, 18(17): 3606−3622. doi: 10.1175/JCLI3489.1 [26] Hao Guanghua, Pirazzini R, Yang Qinghua, et al. Spectral albedo of coastal landfast sea ice in Prydz Bay, Antarctica[J]. Journal of Glaciology, 2021, 67(261): 126−136. doi: 10.1017/jog.2020.90 [27] Shao Zhude, Ke Changqing. Spring-summer albedo variations of Antarctic sea ice from 1982 to 2009[J]. Environmental Research Letters, 2015, 10(6): 064001. doi: 10.1088/1748-9326/10/6/064001 [28] Riihelä A, Bright R M, Anttila K. Recent strengthening of snow and ice albedo feedback driven by Antarctic sea-ice loss[J]. Nature Geoscience, 2021, 14(11): 832−836. doi: 10.1038/s41561-021-00841-x [29] Zhou Chunxia, Zhang Trng, Zheng Lei. The characteristics of surface albedo change trends over the Antarctic sea ice region during recent decades[J]. Remote Sensing, 2019, 11(7): 821. doi: 10.3390/rs11070821 [30] Zhang Teng, Zhou Chunxia, Zheng Lei. Analysis of the temporal–spatial changes in surface radiation budget over the Antarctic sea ice region[J]. Science of the Total Environment, 2019, 666: 1134−1150. doi: 10.1016/j.scitotenv.2019.02.264 [31] Li Huan, Xie Hongjie, Kern S, et al. Spatio-temporal variability of Antarctic sea-ice thickness and volume obtained from ICESat data using an innovative algorithm[J]. Remote Sensing of Environment, 2018, 219: 44−61. doi: 10.1016/j.rse.2018.09.031 [32] Xiong Xiaozhen, Stamnes K, Lubin D. Surface albedo over the arctic ocean derived from AVHRR and its validation with SHEBA data[J]. Journal of Applied Meteorology and Climatology, 2002, 41(4): 413−425. doi: 10.1175/1520-0450(2002)041<0413:SAOTAO>2.0.CO;2 [33] Riihelä A, Manninen T, Laine V, et al. CLARA-SAL: a global 28 yr timeseries of Earth’s black-sky surface albedo[J]. Atmospheric Chemistry and Physics, 2013, 13(7): 3743−3762, doi: 10.5194/acp-13-3743-2013 [34] Satellite Application Facility on Climate Monitoring. Algorithm Theoretical Basis Document CM SAF Cloud, Albedo, Radiation data record, AVHRR-based, Edition 2.1 (CLARA-A2.1) Surface Albedo[R/OL]. [2022−11−18]. https://www.cmsaf.eu/SharedDocs/Literatur/document/2020/saf_cm_fmi_atbd_gac_sal_2_4_pdf.pdf?__blob=publicationFile. [35] Satellite Application Facility on Climate Monitoring. Product User Manual ICDR AVHRR–based on CLARA-A2 methods Surface Albedo[R/OL]. [2022−11−18]. https://www.cmsaf.eu/SharedDocs/Literatur/document/2021/saf_cm_fmi_icdr_clara_sal_pum_2_1_pdf.pdf?__blob=publicationFile. [36] Karlsson K G, Anttila K, Trentmann J, et al. CLARA-A2: the second edition of the CM SAF cloud and radiation data record from 34 years of global AVHRR data[J]. Atmospheric Chemistry and Physics, 2017, 17(9): 5809−5828. doi: 10.5194/acp-17-5809-2017 [37] Allison I, Brandt R E, Warren S G. East Antarctic sea ice: albedo, thickness distribution, and snow cover[J]. Journal of Geophysical Research: Oceans, 1993, 98(C7): 12417−12429. doi: 10.1029/93JC00648 [38] Lei Ruibo, Tian-Kunze Xiangshan, Leppäranta M, et al. Changes in summer sea ice, albedo, and portioning of surface solar radiation in the Pacific Sector of Arctic Ocean during 1982–2009[J]. Journal of Geophysical Research: Oceans, 2016, 121(8): 5470–5486. [39] Perovich D K, Nghiem S V, Markus T, et al. Seasonal evolution and interannual variability of the local solar energy absorbed by the Arctic sea ice-ocean system[J]. Journal of Geophysical Research: Oceans, 2007, 112(C3): C03005. [40] Riihelä A, Manninen T, Laine V. Observed changes in the albedo of the Arctic sea-ice zone for the period 1982–2009[J]. Nature Climate Change, 2013, 3(10): 895−898. doi: 10.1038/nclimate1963 [41] Weiss A I, King J C, Lachlan-Cope T A, et al. Albedo of the ice covered Weddell and Bellingshausen Seas[J]. The Cryosphere, 2012, 6(2): 479−491. doi: 10.5194/tc-6-479-2012 [42] Nan Sulan, Li Jianping. The relationship between the summer precipitation in the Yangtze River valley and the boreal spring Southern Hemisphere annular mode[J]. Geophysical Research Letters, 2003, 30(24): 2266. [43] Gong Daoyi, Wang Shaowu. Definition of Antarctic oscillation index[J]. Geophysical Research Letters, 1999, 26(4): 459−462. doi: 10.1029/1999GL900003 [44] Feng Juan, Li Jianping, Li Yun. Is there a relationship between the SAM and southwest Western Australian winter rainfall?[J]. Journal of Climate, 2010, 23(22): 6082−6089. doi: 10.1175/2010JCLI3667.1 [45] Yuan Zhengxuan, Qin Jun, Li Shuanglin, et al. Impact of boreal autumn Antarctic Oscillation on winter wet-cold weather in the middle-lower reaches of Yangtze River Basin[J]. Climate Dynamics, 2022, 58(1/2): 329−349. [46] Lefebvre W, Goosse H, Timmermann R, et al. Influence of the Southern Annular Mode on the sea ice–ocean system[J]. Journal of Geophysical Research: Oceans, 2004, 109(C9): C09005. [47] Purich A, Cai Wenju, England M H, et al. Evidence for link between modelled trends in Antarctic sea ice and underestimated westerly wind changes[J]. Nature Communications, 2016, 7: 10409. doi: 10.1038/ncomms10409 -

计量
- 文章访问数: 465
- HTML全文浏览量: 267
- PDF下载量: 71
- 被引次数: 0
