

Interannual variability of winter water in the Indian Ocean Sector of the Southern Ocean and its causes during 2011−2020
-
摘要: 已有多个研究证实南大洋自海表到底层的海水特性存在长期变化特征,并指出其与大尺度外部强迫的改变紧密相关。然而,截至目前海洋学界对各水团的更高频年际变化特征及其影响原因依然了解甚少,其中包括了近海表最易受外部强迫影响的冬季水(Winter Water, WW)。本文结合2011−2020年间每年1月沿110°E断面采集的重复观测资料和再分析气象资料,研究季节性冰区内WW层10年间的年际变化。结果发现,该海域WW特性具有显著的时空变化特征。WW核心温度距平与前一年的南极涛动(Antarctic Oscillation, AAO)指数距平具有显著正相关关系(R = 0.69),而AAO指数与局地纬向风转向所在纬度呈负相关关系(R = −0.61),说明AAO指数越大(小)时,辐散带会向南(北)移动,季节性冰区的WW核心温度升高(降低)。局地净降水量距平变化与WW核心盐度距平的变化相反,2016年之后负的净降水量距平(大气向海洋输送淡水减少)促使WW核心盐度距平增大。另外,局地涡动能距平与WW厚度距平呈负相关关系(R = −0.70),据此推测该海域持续存在的气旋式涡旋的强度增强(减弱),引发向上抽吸作用增强(减弱),导致绕极深层水的深度变浅(加深),进而引起其上层WW层厚度的变化。通过本研究工作,有助于深入理解南大洋海洋水柱对外部强迫高频变化的具体响应。Abstract: Multiple studies have confirmed the long-term property modification of water columns from the bottom to the sea surface at the Southern Ocean and pointed out that it is closely related to the changes of large-scale external forcing. However, the higher frequency interannual variability of the water masses and its causes are still poorly understood, including the winter water (WW), which is the most vulnerable to external forcing near the sea surface. Based on repeated hydrographic observations along 110°E in Januaries 2011 to 2020 and meteorological reanalysis datasets, this study estimated interannual variability of the WW layer in the seasonal ice zone (SIZ) and its possible causes over ten years. Results show that WW properties have significant temporal and spatial variability in this region. A significant positive correlation between the WW core temperature anomaly and the previous-year Antarctic Oscillation (AAO) index anomaly (R = 0.69) and a negative correlation between the AAO index and the turning latitude of the local zonal wind component (R = −0.61), indicate that a larger (smaller) AAO index corresponds to a southward (northward) shift of the divergence zone, and the increase (decrease) of the WW core temperature in the SIZ. A negative correspondence between the local net precipitation anomaly and the WW core salinity anomaly indicates the negative net precipitation anomaly (less freshwater transport to the ocean) after 2016 contributes to an increase in the WW core salinity anomaly. Meanwhile, the local eddy kinetic energy anomaly is negatively correlated with the WW thickness anomaly (R = −0.70), which supports the idea that the enhancement (decrease) in the intensity of persistent cyclonic eddies in this region may strengthen (weaken) the upward pumping to shoal the depth of the circumpolar deep water, and further affect the WW thickness. This study contributes to an in-depth understanding of the specific response of water columns in the Southern Ocean to the high-frequency variability of external forcing.
-

图 1 观测站点分布
各站点对应数字代表重复观测次数;浅绿色线和红色线分别代表冬季冰缘线和夏季冰缘线,分别为2011−2020年10年平均的1月和7月的月平均15%海冰密集度线;海底地形基于ETOPO1数据[45]绘制
Fig. 1 Distribution of observation sites
Numbers represent the number of repeated observations at the corresponding stations; the light green line and red line represent the winter ice edge and the summer ice edge, respectively, calculated from the mean 15% sea ice concentration lines in Januaries and Julies over 2011−2020; bottom topography is drawn according to the ETOPO1 dataset[45]

图 2 2011−2020年1月沿110°E获得的位温(θ)、盐度断面图
等值线表示盐度;黑色虚线为θ = −0.5℃等温线,代表WW层的上下界;白点代表每个站点冷核最低温度所在深度
Fig. 2 Cross sections of potential temperature (θ) and salinity obtained along 110°E in Januaries 2011−2020
Contours indicate salinity; black dashed lines show the θ = −0.5℃ isotherms, being the upper and lower boundaries of the WW layer; white dot represents the depth where the cold core temperature is observed at each station

图 3 2011−2020年间所有观测站点上WW冷核对应的位温和盐度分布
不同颜色区分观测的年份;黑色三角代表同一整数纬度站点上的平均值;误差条代表1个标准差
Fig. 3 Distributions of potential temperature and salinity for WW cold core at all stations during 2011−2020
Different colors distinguish the years of observation; black triangles represent the mean values at the same integer latitude stations; error bars represent one standard deviation
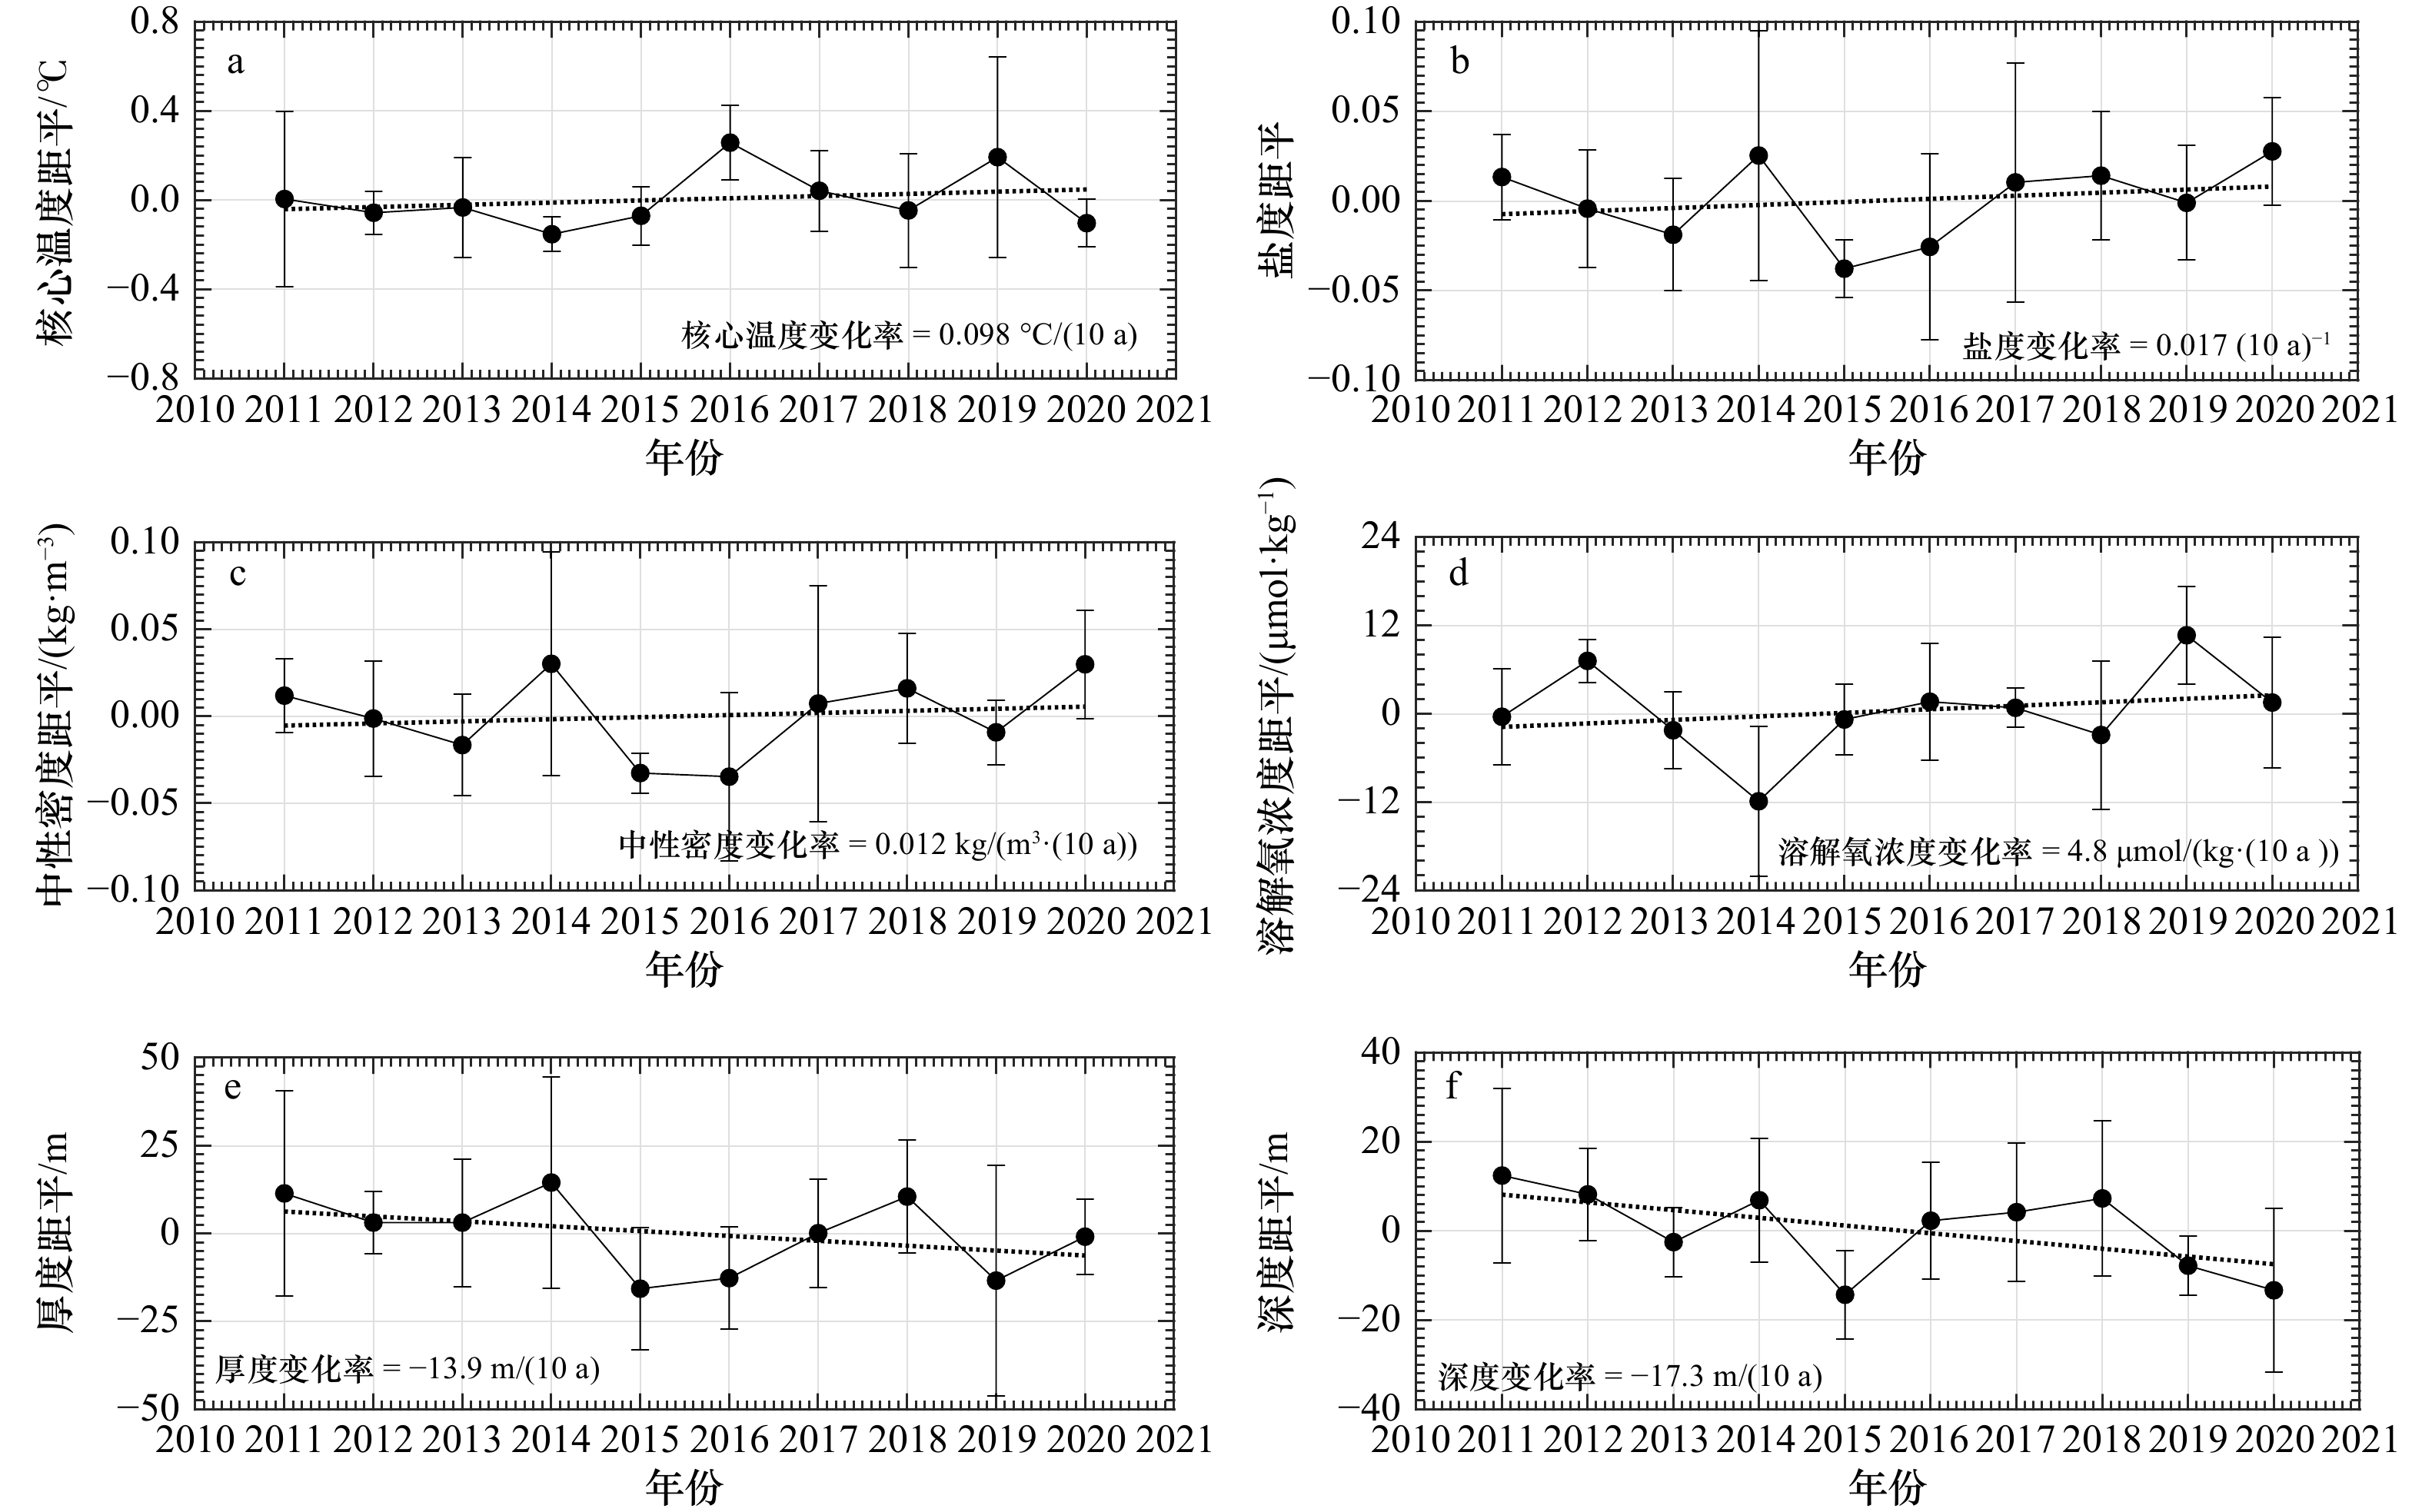
图 4 2011−2020年间WW核心温度距平(a)、盐度距平(b)、中性密度距平(c)、溶解氧浓度距平(d)、厚度距平(e)和冷核所在深度距平(f)的时间序列
误差条代表相同年份不同网格之间结果的一个标准差,即空间变化部分
Fig. 4 Time series of anomalies of core temperature (a), salinity (b), neutral density (c), dissolved oxygen concentration (d) at cold core of WW, thickness anomalies of WW (e), and depth anomalies of the cold core of WW (f) during 2011−2020
Error bars denote one standard deviation of the results between different grids for the same year, as the spatial variability components

图 5 AAO指数(a)、Lt(b)的时间序列及两者相关关系(c)
图a和图b中灰色空心圆圈及虚线代表月平均结果;黑线代表每3个月滑动平均后结果;点线及黑点代表年平均结果
Fig. 5 Time series of AAO index (a), Lt (b), and their correlation (c)
In figure a and figure b, gray circles and dashed lines show the monthly results; black lines are results after 3-month moving average; the dotted lines with black dots are annual averages, respectively

图 6 研究海域2010−2019年间基于10年平均的涡动能(EKE)距平(a),净降水量(P−E)距平(b)和海冰密集度(SIC)距平(c)时间序列
图a中灰色线代表日平均,黑色线代表以1个月为跨度实现的滑动平均结果;图b和图c中灰色线代表月平均,黑色线代表每3个月一次滑动平均的结果;红色线代表年平均,10年平均值标注于各分图右下角
Fig. 6 Time series of anomalies of eddy kinetic energy (a), net precipitation (b) and sea ice concentration (c) based on 10-year averages over the study area for the period of 2010−2019
Grey line in figure a represents the daily average and the black line represents the results after one-month moving average; grey lines in figure b and figure c represent monthly averages and the black line represents the result after 3-month moving average; red lines represent the annual averages, 10-year averages are marked at the right bottom corner of each subplot

图 7 外部强迫年平均距平和WW核心温度距平的时间序列比较
纵坐标左侧刻度、内部实线和圆点代表外部强迫距平;纵坐标右侧刻度、虚线和三角代表WW核心温度距平
Fig. 7 Comparison of time series of annual external forcing anomalies and temperature anomalies of WW core
The left axis, the internal solid line and dots represent external forcing anomalies; the right axis, the dashed line and the triangle represent WW core temperature anomalies

图 8 外部强迫年平均距平和WW核心盐度距平的时间序列比较
纵坐标左侧刻度、内部实线和圆点代表外部强迫距平;纵坐标右侧刻度、虚线和三角代表WW核心盐度距平
Fig. 8 Comparison of time series of annual external forcing anomalies and salinity anomalies of WW core
The left axis, the internal solid line and dots represent external forcing anomalies; the right axis, the dashed line and the triangle represent WW core salinity anomalies
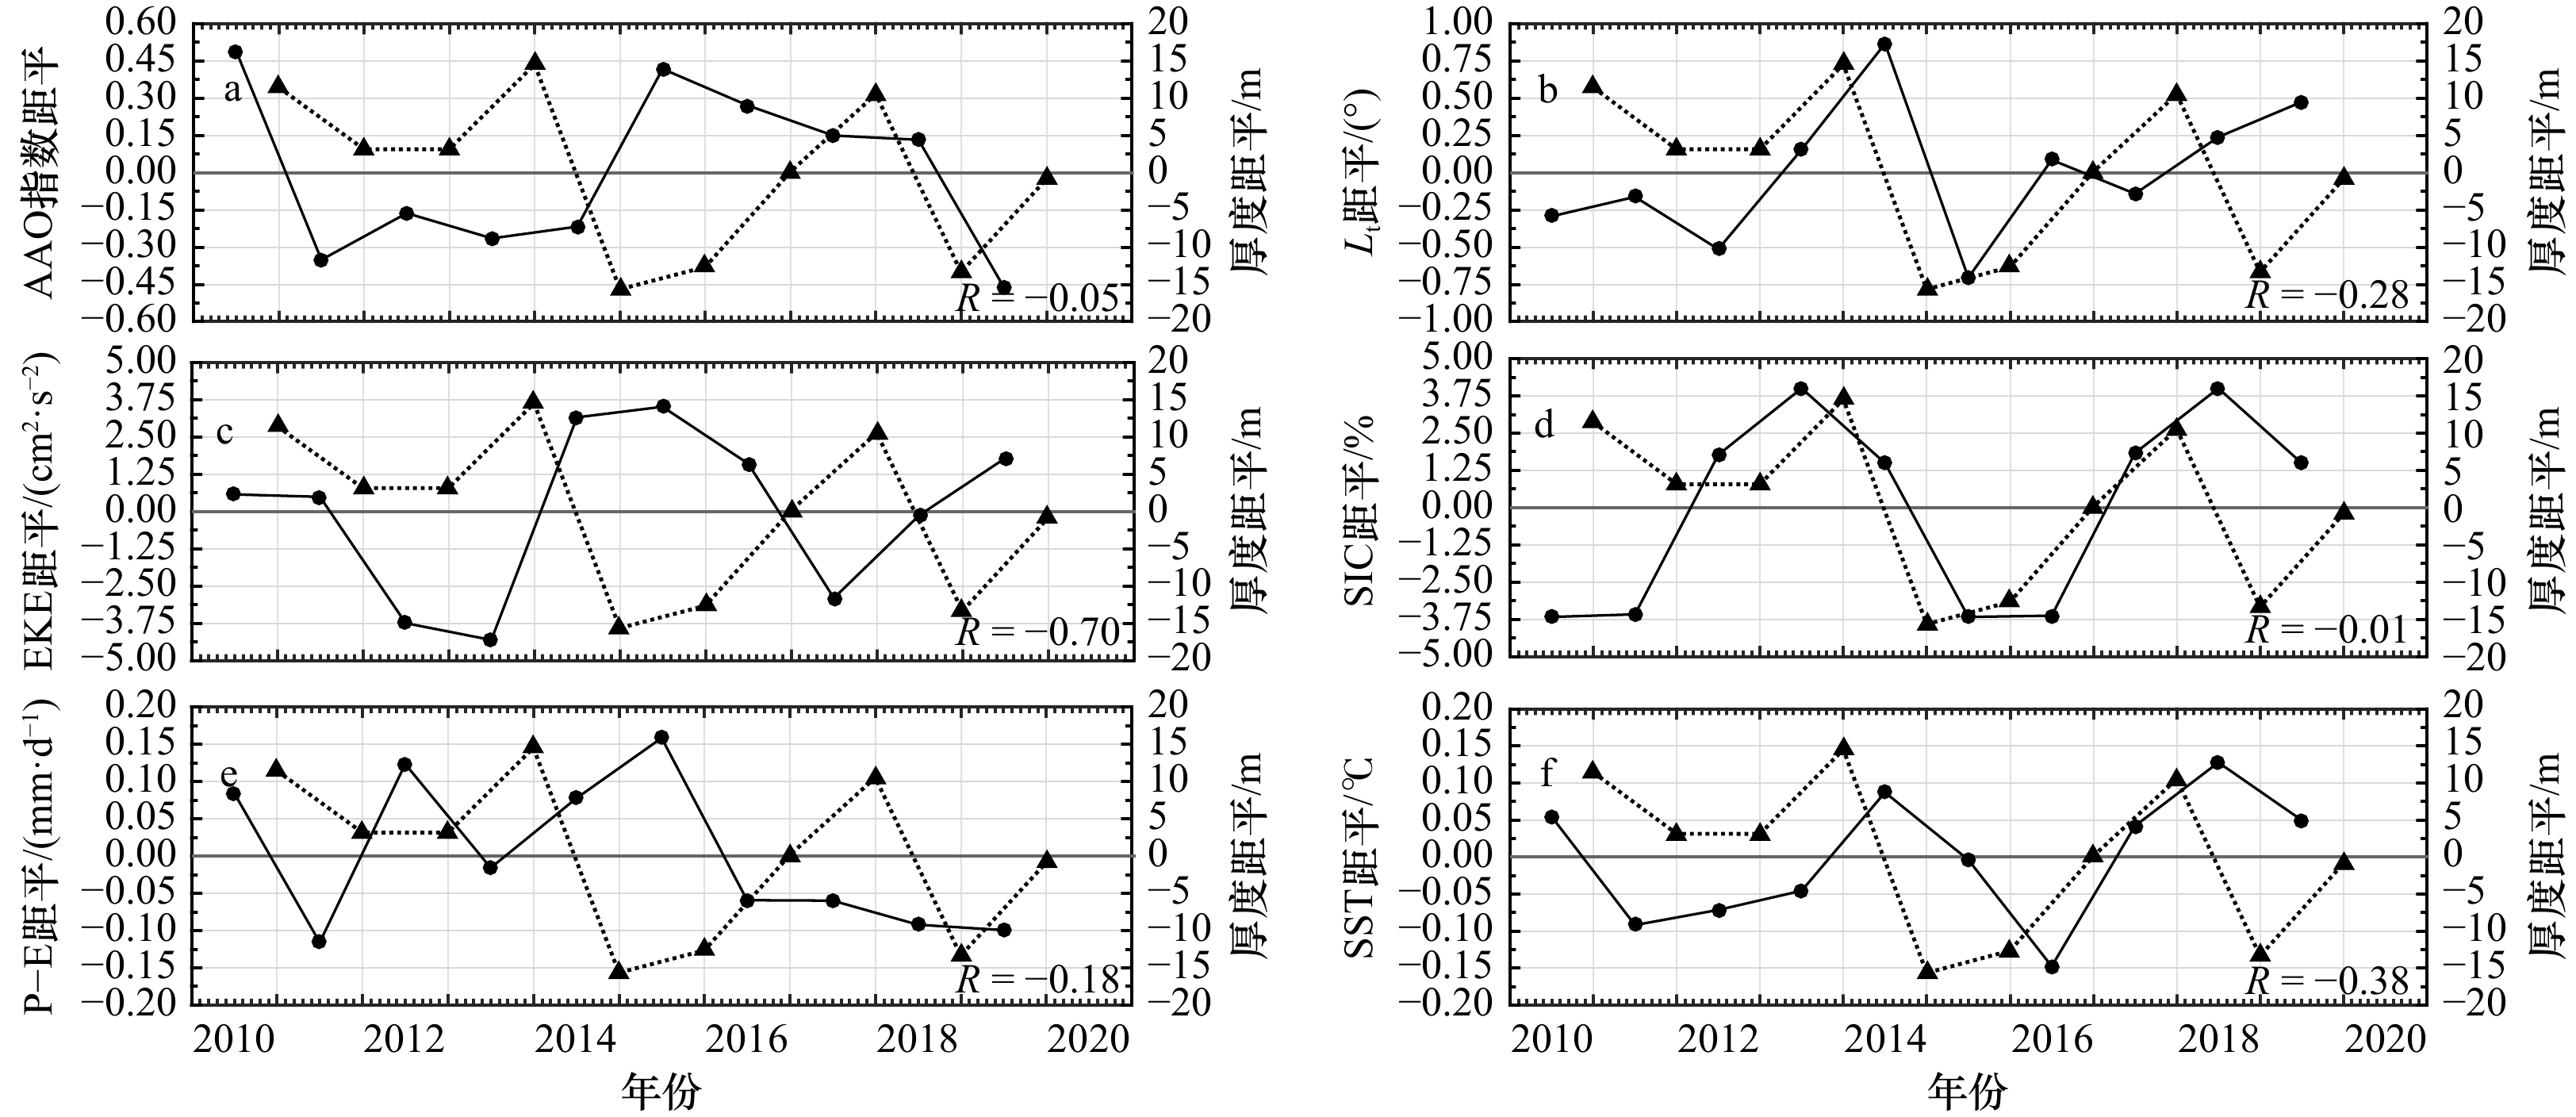
图 9 外部强迫年平均距平和WW厚度距平的时间序列比较
纵坐标左侧刻度、内部实线和圆点代表外部强迫距平;纵坐标右侧刻度、虚线和三角代表WW厚度距平
Fig. 9 Comparison of time series of annual external forcing anomalies and WW thickness anomalies
The left axis, the internal solid line and dots represent external forcing anomalies; the right axis, the dashed line and the triangle represent WW thickness anomalies
表 1 观测站位日期信息
Tab. 1 Date information of observation stations
纬度 2011年 2012年 2013年 2014年 2015年 2016年 2017年 2018年 2019年 2020年 60°S ${\underline {12月31日} }$ 1月3日 1月6日 1月19日 1月18日 1月23日 1月7日 1月8日 1月9日 1月15日 61°S 1月3日 1月7日 1月20日 1月18日 1月23日 1月8日 1月8日 1月10日 1月15日 61.5°S 1月17日 62°S 1月1日 1月8日 1月22日 1月20日 1月25日 1月9日 1月9日 1月11日 1月17日 62.5°S 1月8日 1月20日 1月18日 63°S 1月1日 1月5日 1月8日 1月23日 1月28日 1月25日 1月15日 1月10日 1月12日 1月18日 63.45°S 1月17日 63.5°S 1月6日 1月9日 1月21日 1月17日 1月20日 64°S 1月1日 1月6日 1月9日 1月23日 1月21日 1月26日 1月10日 1月16日 1月20日 64.24°S 1月10日 64.30°S 1月9日 64.5°S 1月6日 1月12日 1月22日 1月24日 64.68°S 1月12日 65°S 1月2日 1月9日 1月24日 1月22日 1月27日 1月15日 1月23日 65.28°S 1月11日 注:2011年在60°S站点的观测日期为2010年12月31日,用下划线标注。  下载: 导出CSV
-
[1] Rintoul S R, England M H. Ekman transport dominates local air-sea fluxes in driving variability of Subantarctic mode water[J]. Journal of Physical Oceanography, 2002, 32(5): 1308−1321. doi: 10.1175/1520-0485(2002)032<1308:ETDLAS>2.0.CO;2 [2] Williams R G. Ocean eddies and plankton blooms[J]. Nature Geoscience, 2011, 4(11): 739−740. doi: 10.1038/ngeo1307 [3] Orsi A H, Johnson G C, Bullister J L. Circulation, mixing, and production of Antarctic Bottom Water[J]. Progress in Oceanography, 1999, 43(1): 55−109. doi: 10.1016/S0079-6611(99)00004-X [4] Speer K, Rintoul S R, Sloyan B. The diabatic Deacon cell[J]. Journal of Physical Oceanography, 2000, 30(12): 3212−3222. doi: 10.1175/1520-0485(2000)030<3212:TDDC>2.0.CO;2 [5] Rintoul S R, Sokolov S, Church J. A 6 year record of baroclinic transport variability of the Antarctic Circumpolar Current at 140°E derived from expendable bathythermograph and altimeter measurements[J]. Journal of Geophysical Research: Oceans, 2002, 107(C10): 19−1−19−22. [6] Broecker W S. Thermohaline circulation, the Achilles heel of our climate system: will man-made CO2 upset the current balance?[J]. Science, 1997, 278(5343): 1582−1588. doi: 10.1126/science.278.5343.1582 [7] Aoki S, Rintoul S R, Ushio S, et al. Freshening of the Adélie Land Bottom Water near 140°E[J]. Geophysical Research Letters, 2005, 32(23): L23601. doi: 10.1029/2005GL024246 [8] Aoki S, Kitade Y, Shimada K, et al. Widespread freshening in the Seasonal Ice Zone near 140°E off the Adélie Land Coast, Antarctica, from 1994 to 2012[J]. Journal of Geophysical Research: Oceans, 2013, 118(11): 6046−6063. doi: 10.1002/2013JC009009 [9] Aoki S, Katsumata K, Hamaguchi M, et al. Freshening of Antarctic bottom water off Cape Darnley, East Antarctica[J]. Journal of Geophysical Research: Oceans, 2020, 125(8): e2020JC016374. [10] Rintoul S R. Rapid freshening of Antarctic Bottom Water formed in the Indian and Pacific oceans[J]. Geophysical Research Letters, 2007, 34(6): L06606. [11] Johnson G C, Purkey S G, Bullister J L. Warming and freshening in the abyssal southeastern Indian Ocean[J]. Journal of Climate, 2008, 21(20): 5351−5363. doi: 10.1175/2008JCLI2384.1 [12] Meredith M P, Garabato A C N, Gordon A L, et al. Evolution of the deep and bottom waters of the Scotia Sea, Southern Ocean, during 1995−2005[J]. Journal of Climate, 2008, 21(13): 3327−3343. doi: 10.1175/2007JCLI2238.1 [13] Jacobs S S, Giulivi C F. Large multidecadal salinity trends near the Pacific-Antarctic continental margin[J]. Journal of Climate, 2010, 23(17): 4508−4524. doi: 10.1175/2010JCLI3284.1 [14] Purkey S G, Johnson G C. Warming of global abyssal and deep Southern Ocean waters between the 1990s and 2000s: Contributions to global heat and sea level rise budgets[J]. Journal of Climate, 2010, 23(23): 6336−6351. doi: 10.1175/2010JCLI3682.1 [15] Purkey S G, Johnson G C. Global contraction of Antarctic Bottom Water between the 1980s and 2000s[J]. Journal of Climate, 2012, 25(17): 5830−5844. doi: 10.1175/JCLI-D-11-00612.1 [16] Fahrbach E, Hoppema M, Rohardt G, et al. Warming of deep and abyssal water masses along the Greenwich meridian on decadal time scales: The Weddell gyre as a heat buffer[J]. Deep-Sea Research Part II: Topical Studies in Oceanography, 2011, 58(25/26): 2509−2523. [17] Azaneu M, Kerr R, Mata M M, et al. Trends in the deep Southern Ocean (1958−2010): Implications for Antarctic Bottom Water properties and volume export[J]. Journal of Geophysical Research: Oceans, 2013, 118(9): 4213−4227. doi: 10.1002/jgrc.20303 [18] Gille S T. Decadal-scale temperature trends in the Southern Hemisphere ocean[J]. Journal of Climate, 2008, 21(18): 4749−4765. doi: 10.1175/2008JCLI2131.1 [19] Böning C W, Dispert A, Visbeck M, et al. The response of the Antarctic Circumpolar Current to recent climate change[J]. Nature Geoscience, 2008, 1(12): 864−869. doi: 10.1038/ngeo362 [20] Aoki S. Trends and interannual variability of surface layer temperature in the Indian Sector of the Southern Ocean observed by Japanese Antarctic Research expeditions[J]. Journal of Oceanography, 1997, 53(6): 623−631. [21] Aoki S, Yoritaka M, Masuyama A. Multidecadal warming of subsurface temperature in the Indian Sector of the Southern Ocean[J]. Journal of Geophysical Research: Oceans, 2003, 108(C4): 8081. doi: 10.1029/2000JC000307 [22] Siems S T, Huang Yi, Manton M J. Southern Ocean precipitation: toward a process-level understanding[J]. WIREs Climate Change, 2022, 13(6): e800. [23] Helm K P, Bindoff N L, Church J A. Changes in the global hydrological-cycle inferred from ocean salinity[J]. Geophysical Research Letters, 2010, 37(18): L18701. [24] Durack P J, Wijffels S E, Matear R J. Ocean salinities reveal strong global water cycle intensification during 1950 to 2000[J]. Science, 2012, 336(6080): 455−458. doi: 10.1126/science.1212222 [25] Haumann F A, Gruber N, Münnich M, et al. Sea-ice transport driving Southern Ocean salinity and its recent trends[J]. Nature, 2016, 537(7618): 89−92. doi: 10.1038/nature19101 [26] Hu Yuyi, Shao Weizeng, Li Jun, et al. Short-term variations in water temperature of the Antarctic surface layer[J]. Journal of Marine Science and Engineering, 2022, 10(2): 287. doi: 10.3390/jmse10020287 [27] Auger M, Morrow R, Kestenare E, et al. Southern ocean in-situ temperature trends over 25 years emerge from interannual variability[J]. Nature Communications, 2021, 12(1): 1840. doi: 10.1038/s41467-021-22318-6 [28] Robertson R, Visbeck M, Gordon A L, et al. Long-term temperature trends in the deep waters of the Weddell Sea[J]. Deep-Sea Research Part II: Topical Studies in Oceanography, 2002, 49(21): 4791−4806. doi: 10.1016/S0967-0645(02)00159-5 [29] Fahrbach E, Hoppema M, Rohardt G, et al. Decadal-scale variations of water mass properties in the deep Weddell Sea[J]. Ocean Dynamics, 2004, 54(1): 77−91. doi: 10.1007/s10236-003-0082-3 [30] Jullion L, Jones S C, Garabato A C N, et al. Wind-controlled export of Antarctic Bottom Water from the Weddell Sea[J]. Geophysical Research Letters, 2010, 37(9): L09609. [31] Meredith M P, Gordon A L, Garabato A C N, et al. Synchronous intensification and warming of Antarctic Bottom Water outflow from the Weddell Gyre[J]. Geophysical Research Letters, 2011, 38(3): L03603. [32] Whitworth III T. Two modes of bottom water in the Australian-Antarctic Basin[J]. Geophysical Research Letters, 2002, 29(5): 17−1−17−3. [33] Purkey S G, Johnson G C. Antarctic Bottom Water warming and freshening: Contributions to sea level rise, ocean freshwater budgets, and global heat gain[J]. Journal of Climate, 2013, 26(16): 6105−6122. doi: 10.1175/JCLI-D-12-00834.1 [34] Van Wijk E M, Rintoul S R. Freshening drives contraction of Antarctic bottom water in the Australian Antarctic Basin[J]. Geophysical Research Letters, 2014, 41(5): 1657−1664. doi: 10.1002/2013GL058921 [35] Menezes V V, Macdonald A M, Schatzman C. Accelerated freshening of Antarctic Bottom Water over the last decade in the Southern Indian Ocean[J]. Science Advances, 2017, 3(1): e1601426. doi: 10.1126/sciadv.1601426 [36] Shimada K, Kitade Y, Aoki S, et al. Shoaling of abyssal ventilation in the Eastern Indian Sector of the Southern Ocean[J]. Communications Earth & Environment, 2022, 3(1): 120. [37] Castagno P, Capozzi V, DiTullio G R, et al. Rebound of shelf water salinity in the Ross Sea[J]. Nature Communications, 2019, 10(1): 5441. doi: 10.1038/s41467-019-13083-8 [38] Silvano A, Foppert A, Rintoul S R, et al. Recent recovery of Antarctic Bottom Water formation in the Ross Sea driven by climate anomalies[J]. Nature Geoscience, 2020, 13(12): 780−786. doi: 10.1038/s41561-020-00655-3 [39] Orsi A H, Whitworth III T, Nowlin W D Jr. On the meridional extent and fronts of the Antarctic Circumpolar Current[J]. Deep-Sea Research Part I: Oceanographic Research Papers, 1995, 42(5): 641−673. doi: 10.1016/0967-0637(95)00021-W [40] Park Y H, Charriaud E, Fieux M. Thermohaline structure of the Antarctic surface water/winter water in the Indian Sector of the Southern Ocean[J]. Journal of Marine Systems, 1998, 17(1/4): 5−23. [41] Sabu P, Libera S A, Chacko R, et al. Winter water variability in the Indian Ocean Sector of Southern Ocean during austral summer[J]. Deep-Sea Research Part II: Topical Studies in Oceanography, 2020, 178: 104852. doi: 10.1016/j.dsr2.2020.104852 [42] Shimada K, Aoki S, Ohshima K I. Creation of a gridded dataset for the Southern Ocean with a topographic constraint scheme[J]. Journal of Atmospheric and Oceanic Technology, 2017, 34(3): 511−532. doi: 10.1175/JTECH-D-16-0075.1 [43] Shimada K, Makabe R, Takao S, et al. Physical and chemical oceanographic data during Umitaka-maru cruise of the 58th Japanese Antarctic Research Expedition in January 2017[J]. Polar Data Journal, 2020, 4: 1−29. [44] 李亚婧. 南极半岛周边海域水团性质及水交换特征的研究[D]. 青岛: 自然资源部第一海洋研究所, 2019.Li Yajing. Study on the properties and exchanges of water masses in the region of Antarctic Peninsula[D]. Qingdao: First Institute of Oceanography, MNR, 2019. [45] Amante C, Eakins B W. ETOPO1 arc-minute global relief model: procedures, data sources and analysis[R]. Boulder: National Oceanic and Atmospheric Administration, 2009. [46] Thompson D W J, Solomon S, Kushner P J, et al. Signatures of the Antarctic ozone hole in Southern Hemisphere surface climate change[J]. Nature Geoscience, 2011, 4(11): 741−749. doi: 10.1038/ngeo1296 [47] Schlosser E, Haumann F A, Raphael M N. Atmospheric influences on the anomalous 2016 Antarctic sea ice decay[J]. The Cryosphere, 2018, 12(3): 1103−1119. doi: 10.5194/tc-12-1103-2018 [48] 严晨冰, 程灵巧, 朱国平. 南极斯科舍海涡旋分布及其内部水文结构特征分析[J]. 海洋学报, 2022, 44(3): 1−14.Yan Chenbing, Cheng Lingqiao, Zhu Guoping. Distribution and the internal hydrographic characteristics of eddies in the Scotia Sea, Antarctica[J]. Haiyang Xuebao, 2022, 44(3): 1−14. [49] 李等, 程灵巧, 严晨冰, 等. 基于2005−2019年卫星遥感观测的南大洋印度洋扇区中部涡旋特征分布研究[J]. 海洋与湖沼, 2022, 53(5): 1054−1066. doi: 10.11693/hyhz20220100005Li Deng, Cheng Lingqiao, Yan Chenbing, et al. Characteristics of eddies in the Central Indian Sector of the Southern Ocean based on satellite observation from 2005 to 2019[J]. Oceanologia et Limnologia Sinica, 2022, 53(5): 1054−1066. doi: 10.11693/hyhz20220100005 [50] Wakatsuchi M, Ohshima K I, Hishida M, et al. Observations of a street of cyclonic eddies in the Indian Ocean Sector of the Antarctic divergence[J]. Journal of Geophysical Research: Oceans, 1994, 99(C10): 20417−20426. doi: 10.1029/94JC01478 [51] Mizobata K, Shimada K, Aoki S, et al. The cyclonic eddy train in the Indian Ocean Sector of the Southern Ocean as revealed by satellite radar altimeters and in situ measurements[J]. Journal of Geophysical Research: Oceans, 2020, 125(6): e2019JC015994. [52] Stuecker M F, Bitz C M, Armour K C. Conditions leading to the unprecedented low Antarctic sea ice extent during the 2016 austral spring season[J]. Geophysical Research Letters, 2017, 44(17): 9008−9019. doi: 10.1002/2017GL074691 -

计量
- 文章访问数: 461
- HTML全文浏览量: 242
- PDF下载量: 78
- 被引次数: 0
