

Sea level rise projection in China’s coastal and offshore areas
-
摘要: 本文利用验潮站观测和卫星高度计数据,以及基于筛选的CMIP6的10个模拟性能较好的地球系统模式结果,对中国海平面的长期变化趋势,以及未来上升幅度进行了分析和预测。结果显示:(1)1960−2021年,中国沿海海平面呈加速上升趋势,上升速率为2.5 mm/a,加速度为0.06 mm/a2;1993−2021年上升速率为4.0 mm/a,高于全球同期3.3 mm/a的上升值。(2)1980−2021年,渤、黄海,东海和南海沿海海平面上升速率分别为3.5 mm/a、3.3 mm/a和3.6 mm/a,渤、黄海和南海沿海海平面上升速率较快,东海偏慢;渤、黄海沿海海平面在20世纪60−70年代上升较慢,80年代之后上升加快。(3)在中等情景(SSP2-4.5)和高情景(SSP5-8.5)下,2050年中国近海海平面将上升0.22 m(0.19~0.28 m)和0.24 m(0.21~0.33 m);到2100年,中国近海海平面将上升0.59 m(0.47~0.80 m)和0.83 m(0.64~1.09 m)。(4)2021−2040年,统计预测的海平面上升中值略接近数值模式低、中和高情景预测值。2041−2060年,数值模式低、中和高情景预测值均介于统计预测的中值和高值之间。2081−2100年,统计预测的海平面上升高值与数值模式中情景预测值接近,绝对偏差为0.017 m,相对偏差为3.4%。(5)高情景下,2100年现有100年一遇的极端高海面将变为不足10年一遇,其中超过50%的站点将变为不足两年一遇,沿海防护工程等基础设施的防御能力降低,复合型滨海城市洪涝等灾害事件的风险增加。Abstract: Using tide gauge observation, satellite altimeter data, and the result of 10 CMIP6 Earth System Models with good simulation performance, the long-term trend of sea level change in China, and predicts the range of sea level rise in the future are analyzed in this study. The results show that: (1) from 1960 to 2021, the sea level in China’s coastal areas showed an accelerated rising trend, with a rise rate of 2.5 mm/a and an acceleration of 0.06 mm/a2. From 1993 to 2021, the rise rate was 4.0 mm/a, higher than the global rate of 3.3 mm/a in the same period. (2) From 1980 to 2021, the sea level rise rates of the Bohai Sea and the Yellow Sea, the East China Sea and the South China Sea were 3.5 mm/a, 3.3 mm/a and 3.6 mm/a, respectively. The sea level rise rates of the Bohai Sea and the Yellow Sea, the South China Sea were relatively fast, while the sea level rise rates of East China Sea was slow. The coastal sea level rose slowly from 1960s to 1970s, and accelerated after 1980s in the Bohai Sea and the Yellow Sea. (3) Under the medium (SSP2-4.5) and high (SSP5-8.5) scenarios, China’s offshore sea level will rise by 0.22 m (0.19−0.28 m) and 0.24 m (0.21−0.33 m) respectively in 2050, and will rise by 0.59 m (0.47−0.80 m) and 0.83 m (0.64−1.09 m) respectively in 2100. (4) During 2021−2040, the median value of sea level rise predicted by statistics is close to the predicted value under the low, medium and high scenarios of the numerical model. During 2041−2060, the predicted values of the low, medium and high scenarios of the numerical model are between the middle and high values of the statistical prediction. During 2081−2100, the high value of sea level rise predicted by statistics is close to that predicted by the medium scenario of the numerical model, the absolute deviation is 0.017 m, and the relative deviation is 3.4%. (5) Under the high scenario, the existing once-in-a-century extreme high sea level in 2100 will become less than 10 year return period, in which more than 50% of the stations will become less than 2 year return period, the defense capacity of coastal protection works and other infrastructure will be reduced, and the risk of flood and other disaster events in complex coastal cities will increase.
-
Key words:
- climate change /
- sea level /
- rise trend /
- prediction
-
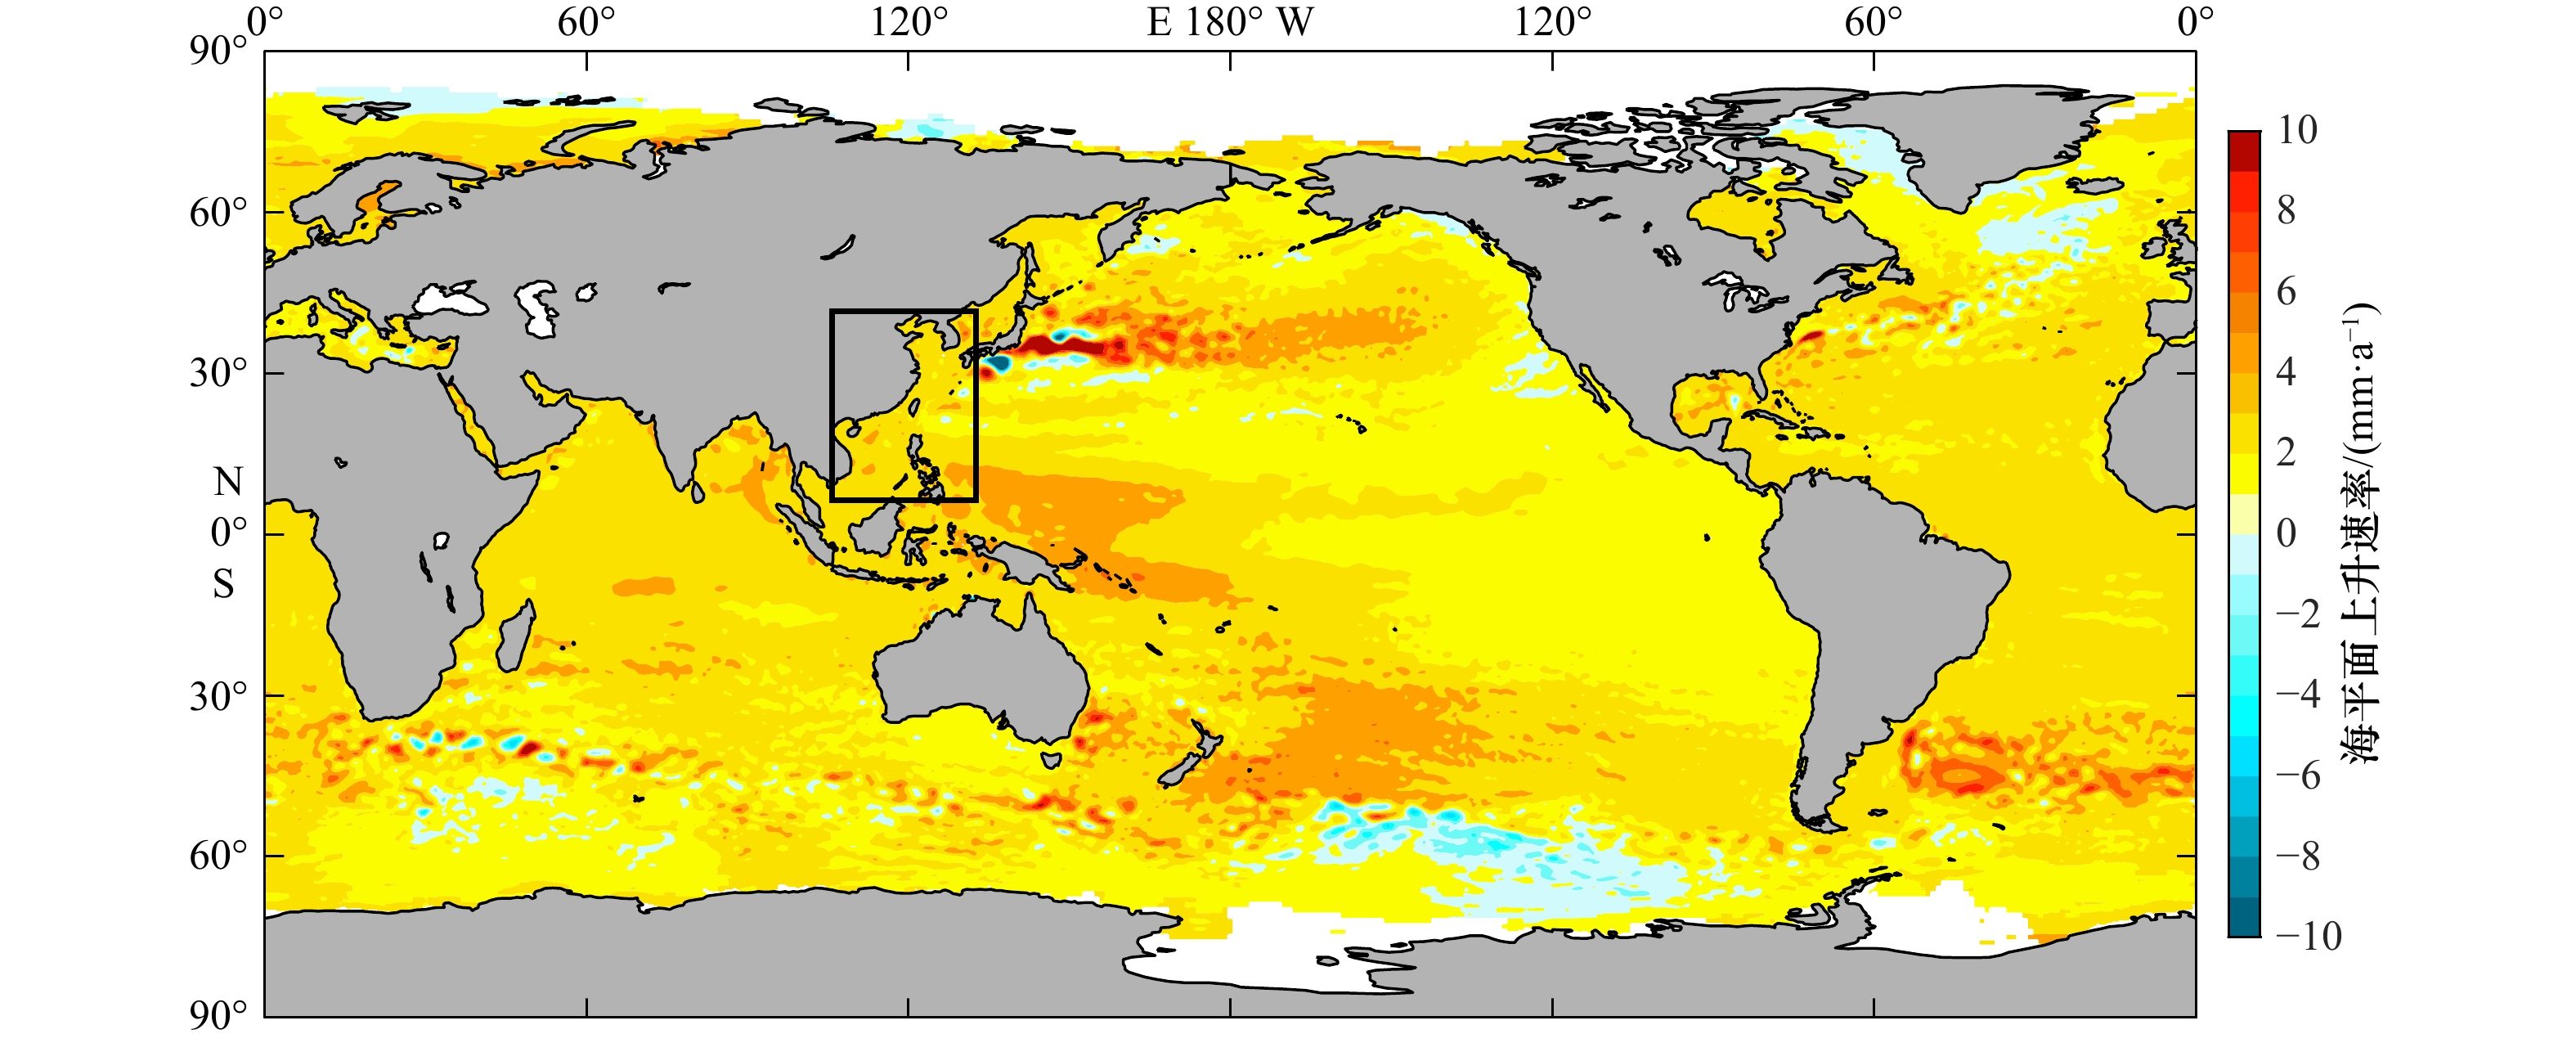
图 1 1993−2021年全球(80°S~80°N)卫星高度计海平面上升趋势空间分布
图中黑色框形为本研究选取的中国近海区域
Fig. 1 Spatial distribution of global (80°S−80°N) satellite altimeter sea level rise trend from 1993 to 2021
Black box is the China offshore region
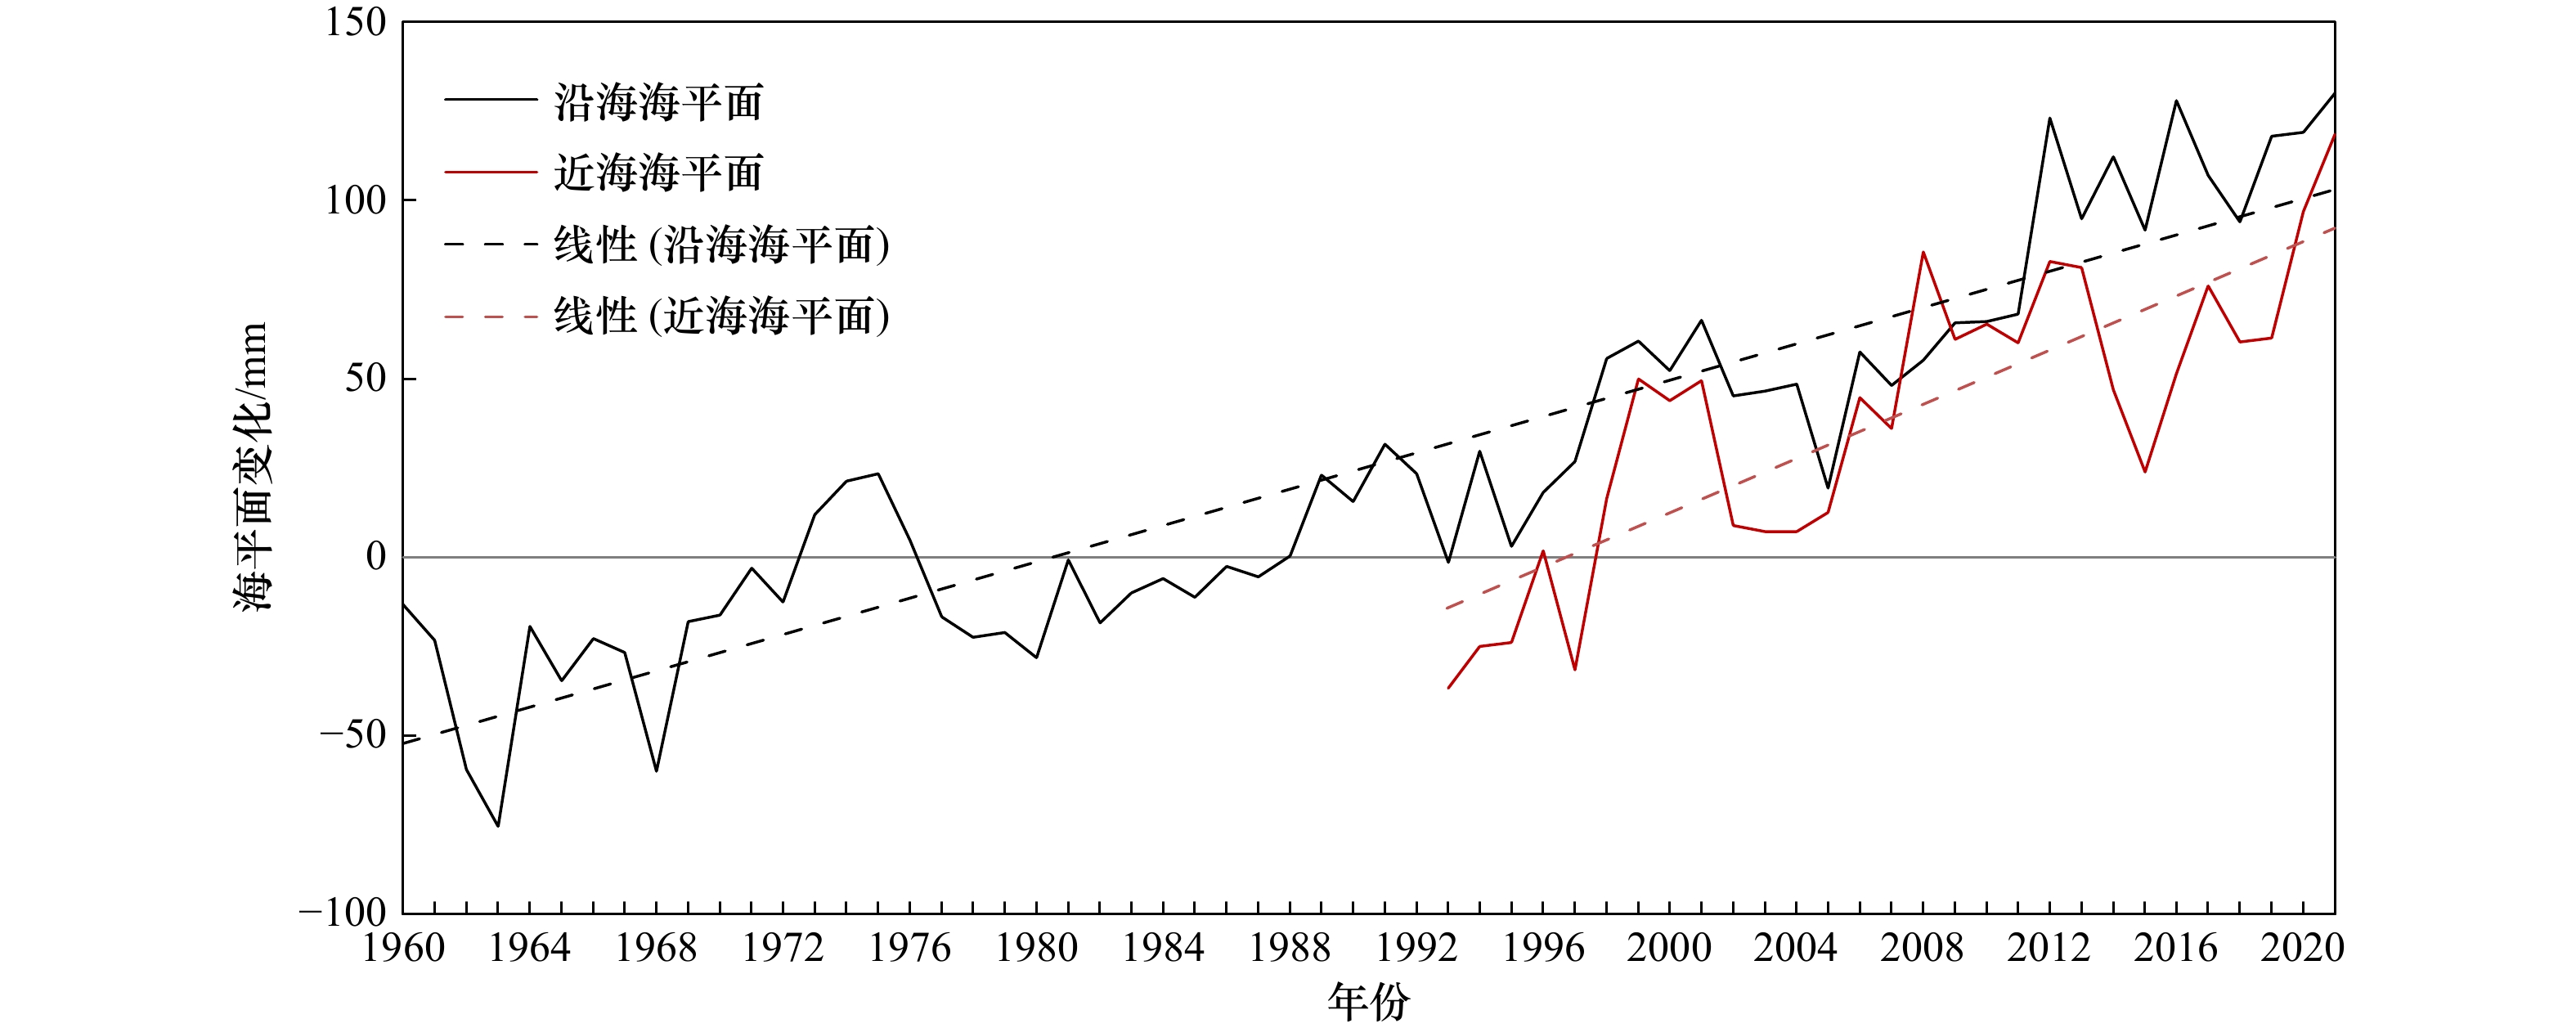
图 2 1960−2021年中国沿海和近海海平面长期变化
Fig. 2 Long term changes of China’s coastal and offshore areas sea level during 1960−2021

图 3 渤、黄海,东海和南海沿海不同时期海平面长期变化趋势
Fig. 3 Long term change trend of sea level in the Bohai Sea and Yellow Sea, East China Sea and South China Sea in different periods

图 4 1993−2021年,EC-Earth3模式在涠洲(a)和大万山(b)海域历史海平面模拟结果与观测数据对比
Fig. 4 Comparison of historical sea level simulation results of EC-Earth3 model and observation datain Weizhou (a) and Dawanshan (b) sea areas from 1993 to 2021

图 5 中国近海及各海区海平面上升预测(相对于1995−2014年)
Fig. 5 Prediction of sea level rise in China’s offshore and various sea areas (relative to 1995−2014)
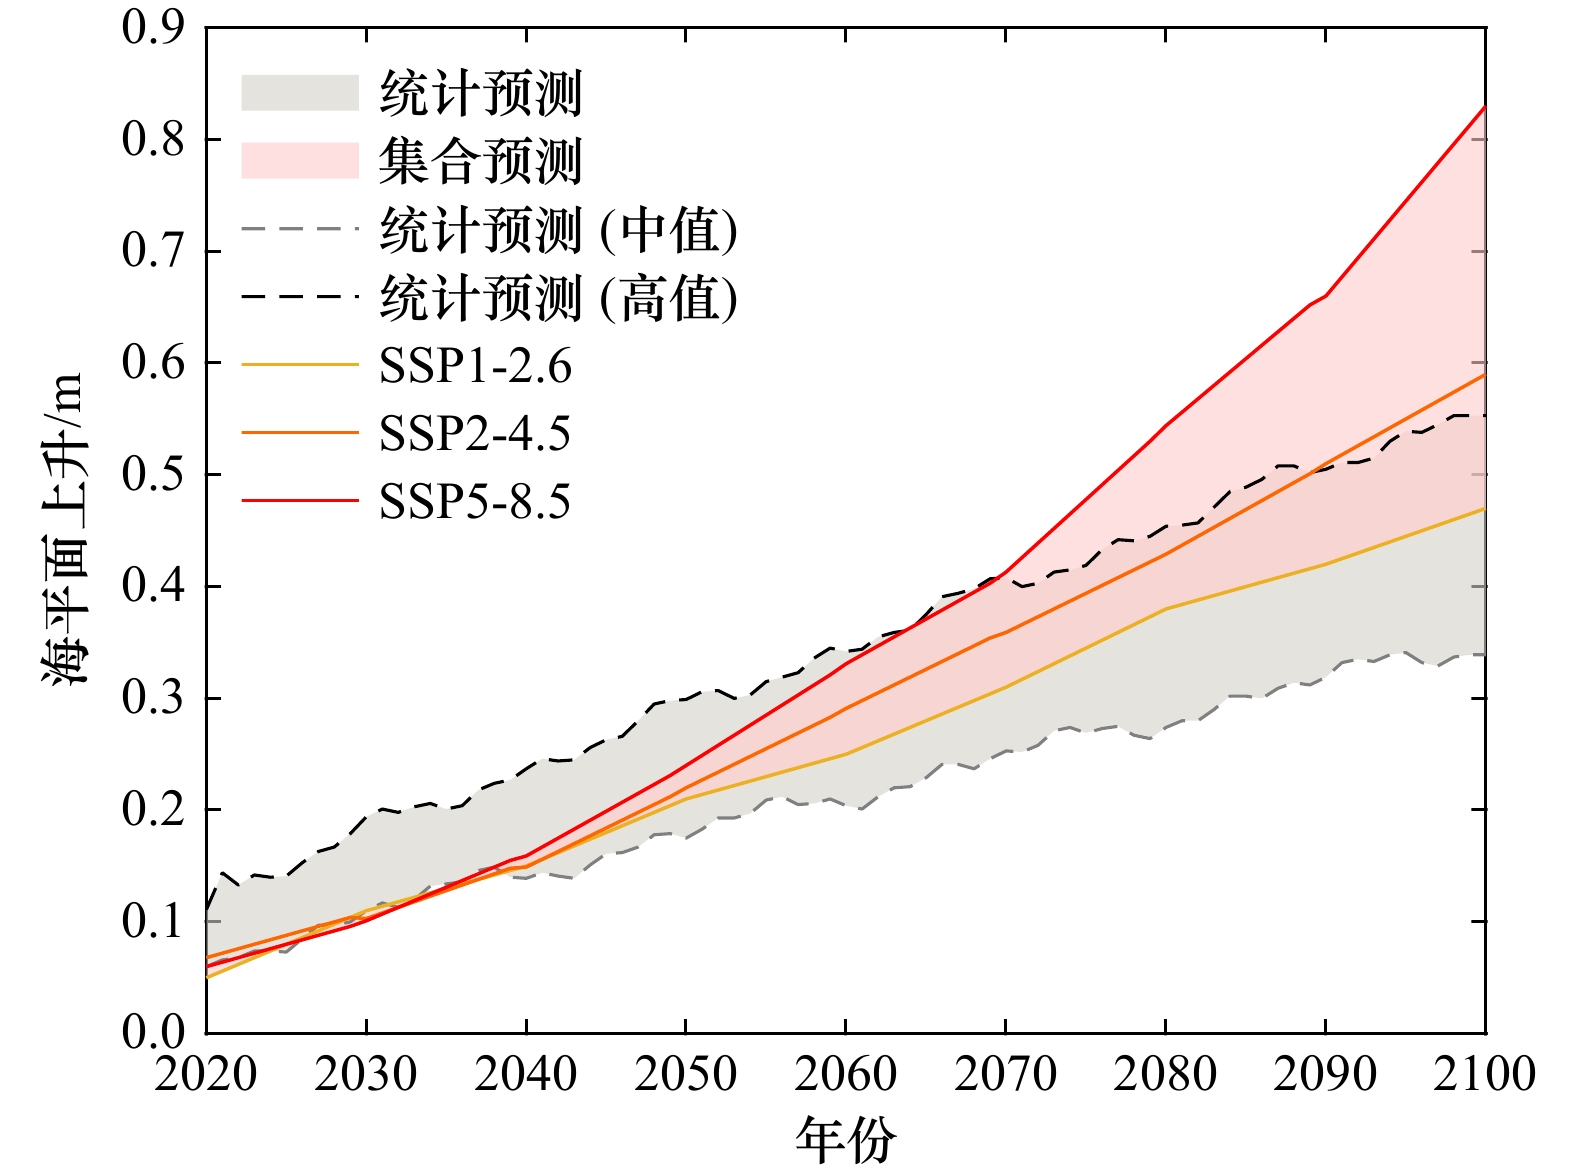
图 6 2020−2100年统计预测和集合预测结果比较
Fig. 6 Comparison of statistical prediction and numerical prediction results from 2020 to 2100
表 1 可应用于中国近海集合预测的CMIP6 模型
Tab. 1 CMIP6 model that can be applied to China offshore collective forecasting
序号 模式 机构 国家/组织 相关系数 1 EC-Earth3 EC-EARTH-Cons 欧盟 0.77 2 EC-Earth3-Veg-LR EC-EARTH-Cons 欧盟 0.67 3 CNRM-CM6 CNRM 法国 0.70 4 CNRM-ESM2 CNRM 法国 0.69 5 ACCESS-CM2 CSIRO-BOM 澳大利亚 0.67 6 CanESM5 CCCMA 加拿大 0.67 7 IPSL-CM6A-LR IPSL 法国 0.63 8 MPI-ESM1-2-HR MPI-M 德国 0.62 9 CMCC-CM2-SR5 CMCC 意大利 0.66 10 CMCC-ESM2 CMCC 意大利 0.62 11 NorESM2-MM NCC 挪威 0.55 12 ACCESS-ESM1-5 CSIRO-BOM 澳大利亚 0.56 13 MIROC6 MIROC 日本 0.53 14 MPI-ESM1-2-LR MPI-M 德国 0.39 15 NorESM2-LM NCC 挪威 0.38  下载: 导出CSV
表 2 中国和各海区海平面上升预测值(单位:m)
Tab. 2 Projection value of sea level rise in the China sea and other sea areas (unit: m)
时间 2050年 2100年 情景 SSP1-2.6 SSP2-4.5 SSP5-8.5 SSP1-2.6 SSP2-4.5 SSP5-8.5 渤、黄海 低 0.16 0.17 0.20 0.30 0.47 0.67 中 0.20 0.21 0.24 0.46 0.56 0.82 高 0.26 0.27 0.33 0.63 0.76 1.08 东海 低 0.18 0.19 0.21 0.32 0.49 0.69 中 0.23 0.22 0.25 0.49 0.61 0.86 高 0.29 0.28 0.32 0.67 0.81 1.13 南海 低 0.15 0.18 0.20 0.32 0.48 0.64 中 0.20 0.21 0.24 0.48 0.59 0.81 高 0.22 0.27 0.32 0.65 0.80 1.07 中国近海 低 0.16 0.19 0.21 0.31 0.47 0.64 中 0.21 0.22 0.24 0.47 0.59 0.83 高 0.26 0.28 0.33 0.64 0.80 1.09 注:相对于1995−2014年平均海平面。
下载: 导出CSV
表 3 3种SSPs情景下2100年中国近海海平面预测(相对于1995−2014年,单位:m)
Tab. 3 Predictions of China’s offshore sea level in 2100 under three SSP scenarios (relative to 1995−2014, unit: m)
SSP1-2.6 SSP2-4.5 SSP5-8.5 比容加动力(贡献) 0.18(38%) 0.23(39%) 0.33(40%) 质量贡献(贡献) 0.29(62%) 0.36(61%) 0.50(60%) 总计 0.47 0.59 0.83
下载: 导出CSV
表 4 中国沿海各省(自治区、直辖市)未来海平面变化预测(单位:m)
Tab. 4 Predictions of future sea level change in China’s coastal provinces (autonomous regions and municipalities) (unit: m)
行政区 2030年 2050年 2060年 2100年 辽宁 0.11 0.17 0.18 0.30 河北 0.12 0.17 0.19 0.32 天津 0.18 0.26 0.27 0.47 山东 0.11 0.18 0.22 0.37 江苏 0.10 0.17 0.20 0.37 上海 0.11 0.18 0.22 0.37 浙江 0.11 0.18 0.21 0.37 福建 0.08 0.12 0.15 0.27 广东 0.10 0.16 0.19 0.32 广西 0.06 0.10 0.12 0.22 海南 0.12 0.20 0.21 0.38 全海域(低) 0.06 0.10 0.12 0.22 全海域(中) 0.10 0.17 0.20 0.34 全海域(高) 0.18 0.29 0.34 0.55 注:相对于1995−2014年平均海平面。
下载: 导出CSV
表 5 不同情景和重现期水平下的极端高海面(单位:m)
Tab. 5 Extreme high sea level under different scenarios and return periods (unit: m)
序号 验潮站 现代情景 SSP2-4.5 SSP5-8.5 100年一遇 20年一遇 10年一遇 100年一遇 20年一遇 10年一遇 100年一遇 10年一遇 2年一遇 1 葫芦岛 2.81 2.66 2.60 3.38 3.23 3.17 3.65 3.44 3.27 2 秦皇岛 1.72 1.52 1.43 2.29 2.09 2.00 2.56 2.27 2.04 3 龙口 2.37 2.03 1.88 2.94 2.60 2.45 3.21 2.72 2.33 4 烟台 2.46 2.18 2.06 3.03 2.75 2.63 3.30 2.90 2.58 5 日照 3.13 2.92 2.82 3.70 3.49 3.39 3.97 3.66 3.41 6 吕四 4.85 4.37 4.15 5.46 4.98 4.76 5.73 5.03 4.47 7 大戢山 3.49 3.22 3.11 4.10 3.83 3.72 4.37 3.99 3.68 8 镇海 3.40 2.93 2.73 4.01 3.54 3.34 4.28 3.61 3.08 9 坎门 5.09 4.50 4.24 5.70 5.11 4.85 5.97 5.12 4.45 10 三沙 4.36 4.00 3.85 4.97 4.61 4.46 5.24 4.73 4.32 11 厦门 4.16 3.88 3.75 4.77 4.49 4.36 5.04 4.63 4.30 12 汕尾 2.23 1.93 1.80 2.82 2.52 2.39 3.04 2.61 2.26 13 闸坡 2.88 2.55 2.41 3.47 3.14 3.00 3.69 3.22 2.85 14 海口 2.69 2.20 1.99 3.28 2.79 2.58 3.50 2.80 2.24 15 北海 3.41 3.17 3.06 4.00 3.76 3.65 4.22 3.87 3.60
下载: 导出CSV
-
[1] IPCC. Climate Change 2021: The Physical Science Basis. Contribution of Working Group I to the Sixth Assessment Report of the Intergovernmental Panel on Climate Change[M]. Cambridge, United Kingdom and New York, NY, USA: Cambridge University Press, 2021: 2391. [2] Dangendorf S, Hay C, Calafat F M, et al. Persistent acceleration in global sea-level rise since the 1960s[J]. Nature Climate Change, 2019, 9(9): 705−710. doi: 10.1038/s41558-019-0531-8 [3] World Meteorological Organization. State of the global climate 2021[R]. Geneva: World Meteorological Organization, 2022. [4] IPCC. Sea level change[M]//Stocker T, Qin D, Plattner G, et al. Climate Change 2013: The Physical Science Basis. Contribution of Working Group I to the Fifth Assessment Report of the Intergovernmental Panel on Climate Change. Cambridge: Cambridge University Press, 2014: 1137−1216. [5] Oppenheimer M, Glavovic B C, Hinkel J, et al. Sea level rise and implications for low-lying islands, coasts and communities[M]//Pörtner H O, Roberts D C, Masson-Delmotte V, et al. IPCC Special Report on the Ocean and Cryosphere in a Changing Climate. Cambridge, UK and New York, NY, USA: Cambridge University Press, 2019: 321−445. [6] IPCC. Summary for policymakers[M]//Stocker T F, Qin D, Plattner G K, et al. Climate Change 2013: The Physical Science Basis. Contribution of Working Group I to the Fifth Assessment Report of the Intergovernmental Panel on Climate Change. Cambridge: Cambridge University Press, 2014: 3−29. [7] Church J A, White N J. Sea-level rise from the late 19th to the early 21st century[J]. Surveys in Geophysics, 2011, 32(4): 585−602. doi: 10.1007/s10712-011-9119-1 [8] IPCC. Summary for policymakers[M]//Pörtner H O, Roberts D C, Masson-Delmotte V, et al. IPCC Special Report on the Ocean and Cryosphere in a Changing Climate. Cambridge: Cambridge University Press, 2019. [9] 自然资源部. 2021年中国海平面公报[R]. 北京: 自然资源部, 2022.Ministry of Natural Resources. 2021 China sea level bulletin[R]. Beijing: Ministry of Natural Resources, 2022. [10] Merrifield M A, Thompson P R, Lander M. Multidecadal sea level anomalies and trends in the western tropical Pacific[J]. Geophysical Research Letters, 2012, 39(13): L13602. doi: 10.1029/2012gl052032 [11] Zhang Xuebin, Church J A. Sea level trends, interannual and decadal variability in the Pacific Ocean[J]. Geophysical Research Letters, 2012, 39(21): L21701. doi: 10.1029/2012GL053240 [12] Stammer D, Cazenave A, Ponte R M, et al. Causes for contemporary regional sea level changes[J]. Annual Review of Marine Science, 2013, 5(1): 21−46. doi: 10.1146/annurev-marine-121211-172406 [13] Gregory J M, Andrews T, Ceppi P, et al. How accurately can the climate sensitivity to CO2 be estimated from historical climate change?[J]. Climate Dynamics, 2020, 54(1): 129−157. [14] Van Breedam J, Goelzer H, Huybrechts P. Semi-equilibrated global sea-level change projections for the next 10 000 years[J]. Earth System Dynamics, 2020, 11(4): 953−976. doi: 10.5194/esd-11-953-2020 [15] IPCC. Climate Change 2022: Impacts, Adaptation, and Vulnerability. Contribution of Working Group II to the Sixth Assessment Report of the Intergovernmental Panel on Climate Change[M]. Cambridge, UK and New York, NY, USA: Cambridge University Press, 2022: 3056. [16] 陈长霖. 全球海平面长期趋势变化及气候情景预测研究[D]. 青岛: 中国海洋大学, 2010.Chen Changlin. Long term trends in global sea level analyses and predictions[D]. Qingdao: Ocean University of China, 2010. [17] 罗凤云. 21世纪东中国海海平面变化预测研究[D]. 舟山: 浙江海洋大学, 2020.Luo Fengyun. Study on sea level changes of the East China Sea for the 21st century[D]. Zhoushan: Zhejiang Ocean University, 2020. [18] 张吉, 左军成, 李娟, 等. RCP4.5情景下预测21世纪南海海平面变化[J]. 海洋学报, 2014, 36(11): 21−29. doi: 10.3969/j.issn.0253-4193.2014.11.003Zhang Ji, Zuo Juncheng, Li Juan, et al. Sea level variations in the South China Sea during the 21st Century under RCP4.5[J]. Haiyang Xuebao, 2014, 36(11): 21−29. doi: 10.3969/j.issn.0253-4193.2014.11.003 [19] Huang Chuanjiang, Qiao Fangli. Sea level rise projection in the South China Sea from CMIP5 models[J]. Acta Oceanologica Sinica, 2015, 34(3): 31−41. doi: 10.1007/s13131-015-0631-x [20] 王慧, 刘秋林, 李欢, 等. 海平面变化研究进展[J]. 海洋信息, 2018, 33(3): 19−25, 54.Wang Hui, Liu Qiulin, Li Huan, et al. Latest research and progress on sea level change[J]. Marine Information, 2018, 33(3): 19−25, 54. [21] 刘睿, 刘晓东, 刘恒. 基于CMIP5多模式集合预估东海和南海21世纪海平面高度变化[J]. 地球环境学报, 2020, 11(4): 412−428.Liu Rui, Liu Xiaodong, Liu Heng. Projection of the 21st century sea level change in East China Sea and South China Sea based on CMIP5 model results[J]. Journal of Earth Environment, 2020, 11(4): 412−428. [22] 王慧, 刘克修, 范文静. 渤海西部海平面资料均一性订正及变化特征[J]. 海洋通报, 2013, 32(3): 256−264.Wang Hui, Liu Kexiu, Fan Wenjing. Data uniformity revision and variations of the sea level of the western Bohai Sea[J]. Marine Science Bulletin, 2013, 32(3): 256−264. [23] WCRP Global Sea Level Budget Group. Global sea-level budget 1993-present[J]. Earth System Science Data, 2018, 10(3): 1551−1590. doi: 10.5194/essd-10-1551-2018 [24] 李薇, 张学洪, 金向泽. 海洋环流模式中不同近似假设下的海表高度[J]. 海洋科学进展, 2003, 21(2): 132−141.Li Wei, Zhang Xuehong, Jin Xiangze. Sea level height on different approximations assumptions in ocean circulation models[J]. Advances in Marine Science, 2003, 21(2): 132−141. [25] 黄禄丰, 朱再春, 黄萌田, 等. 基于CMIP6模式优化集合平均预估21世纪全球陆地生态系统总初级生产力变化[J]. 气候变化研究进展, 2021, 17(5): 514−524.Huang Lufeng, Zhu Zaichun, Huang Mengtian, et al. Projection of gross primary productivity change of global terrestrial ecosystem in the 21st century based on optimal ensemble averaging of CMIP6 models[J]. Climate Change Research, 2021, 17(5): 514−524. [26] 左军成, 陈宗镛, 周天华. 中国沿岸海平面变化的一种本征分析和随机动态联合模型[J]. 海洋学报, 1996, 18(2): 7−14.Zuo Juncheng, Chen Zongyong, Zhou Tianhua. A combined model of intrinsic analysis and stochastic dynamics for sea level changes along the coast of China[J]. Haiyang Xuebao, 1996, 18(2): 7−14. [27] 方国洪, 郑文振, 陈宗镛, 等. 潮汐和潮流的分析和预报[M]. 北京: 海洋出版社, 1986.Fang Guohong, Zheng Wenzhen, Chen Zongyong, et al. Analysis and Prediction of Tides and Tidal Currents[M]. Beijing: China Ocean Press, 1986. -

计量
- 文章访问数: 1690
- HTML全文浏览量: 520
- PDF下载量: 197
- 被引次数: 0
