

Effect of sea ice deformation on winter ice thickness in Arctic based on CICE model simulation results
-
摘要: 海冰数值模式是研究海冰动力热力状态参量及之间联系的有效途径。目前对冰厚数值模拟结果的分析远远少于对海冰范围/面积和密集度的研究,对冰速与海冰形变对冰厚分布影响的研究也尚欠缺。本文利用Los Alamos sea ice model(CICE)海冰模式模拟了1980−2018年的北极海冰变化,并使用遥感、同化冰厚数据进行比对验证,分析了模拟冰速和海冰形变对冰厚的影响,计算了冰速的散度和切变偏差对冰厚偏差的贡献。结果显示,CICE对北极70°N以北区域平均冰厚和冰速的年际变化模拟基本合理,但模拟的平均冰厚和冰速多年变化趋势均小于同化数据的变化率;模拟和观测冰厚的空间分布差异与冰速和形变率的偏差有密切联系,主要表现为波弗特海的正偏差和北极中央区至弗拉姆海峡的负偏差。泛北极区域散度和切变偏差在3月之前对冰厚偏差的贡献在13%~16%之间变化,3−4月则由16%跃变至27%。散度偏差主导了11月、12月波弗特海区域的冰厚正偏差,切变偏差主导了冬季加拿大群岛以北海域和穿极流区域的冰厚负偏差。Abstract: Sea ice numerical model is an effective way to study the dynamical and thermal state parameters of sea ice and the connections between them. The current assessment of the results of numerical ice thickness simulation is much less than the sea ice extent/area and concentration, and the study of the influence of ice velocity and sea ice deformation on ice thickness distribution is still lacking. We simulated the Arctic sea ice variability from 1980 to 2018 using the Los Alamos sea ice model (CICE), and validated and comparison the CICE simulation results using remote sensing and assimilated ice thickness data. We further analyzed the effects of simulated ice velocity and sea ice deformation on ice thickness, and calculated the contributions of ice velocity divergence and shear bias to ice thickness bias. The results show that the interannual variability of the mean ice thickness and ice speed in the Arctic north of 70°N is reasonable, but the multi-year trends of the simulated mean ice thickness and ice speed are smaller than the variability of the assimilated data; the differences in the spatial distribution of the simulated and observed ice thickness are closely related to the deviations of the ice speed and deformation rate, mainly in the positive deviation in the Beaufort Sea and the negative deviation in the Arctic central zone to Fram Strait. The contribution of divergence and shear deviation to ice thickness deviation in the pan-Arctic region fluctuates between 13% and 16% before March, and jumps from 16% to 27% in March-April. The divergence bias dominates the positive bias of ice thickness in the Beaufort Sea region in November and December, while the shear bias dominates the negative ice thickness bias in the winter in the ocean north of the Canadian archipelago and in the region of the Arctic transpolar drift.
-
Key words:
- Arctic /
- ice thickness /
- ice velocity /
- deformation /
- simulation results
-
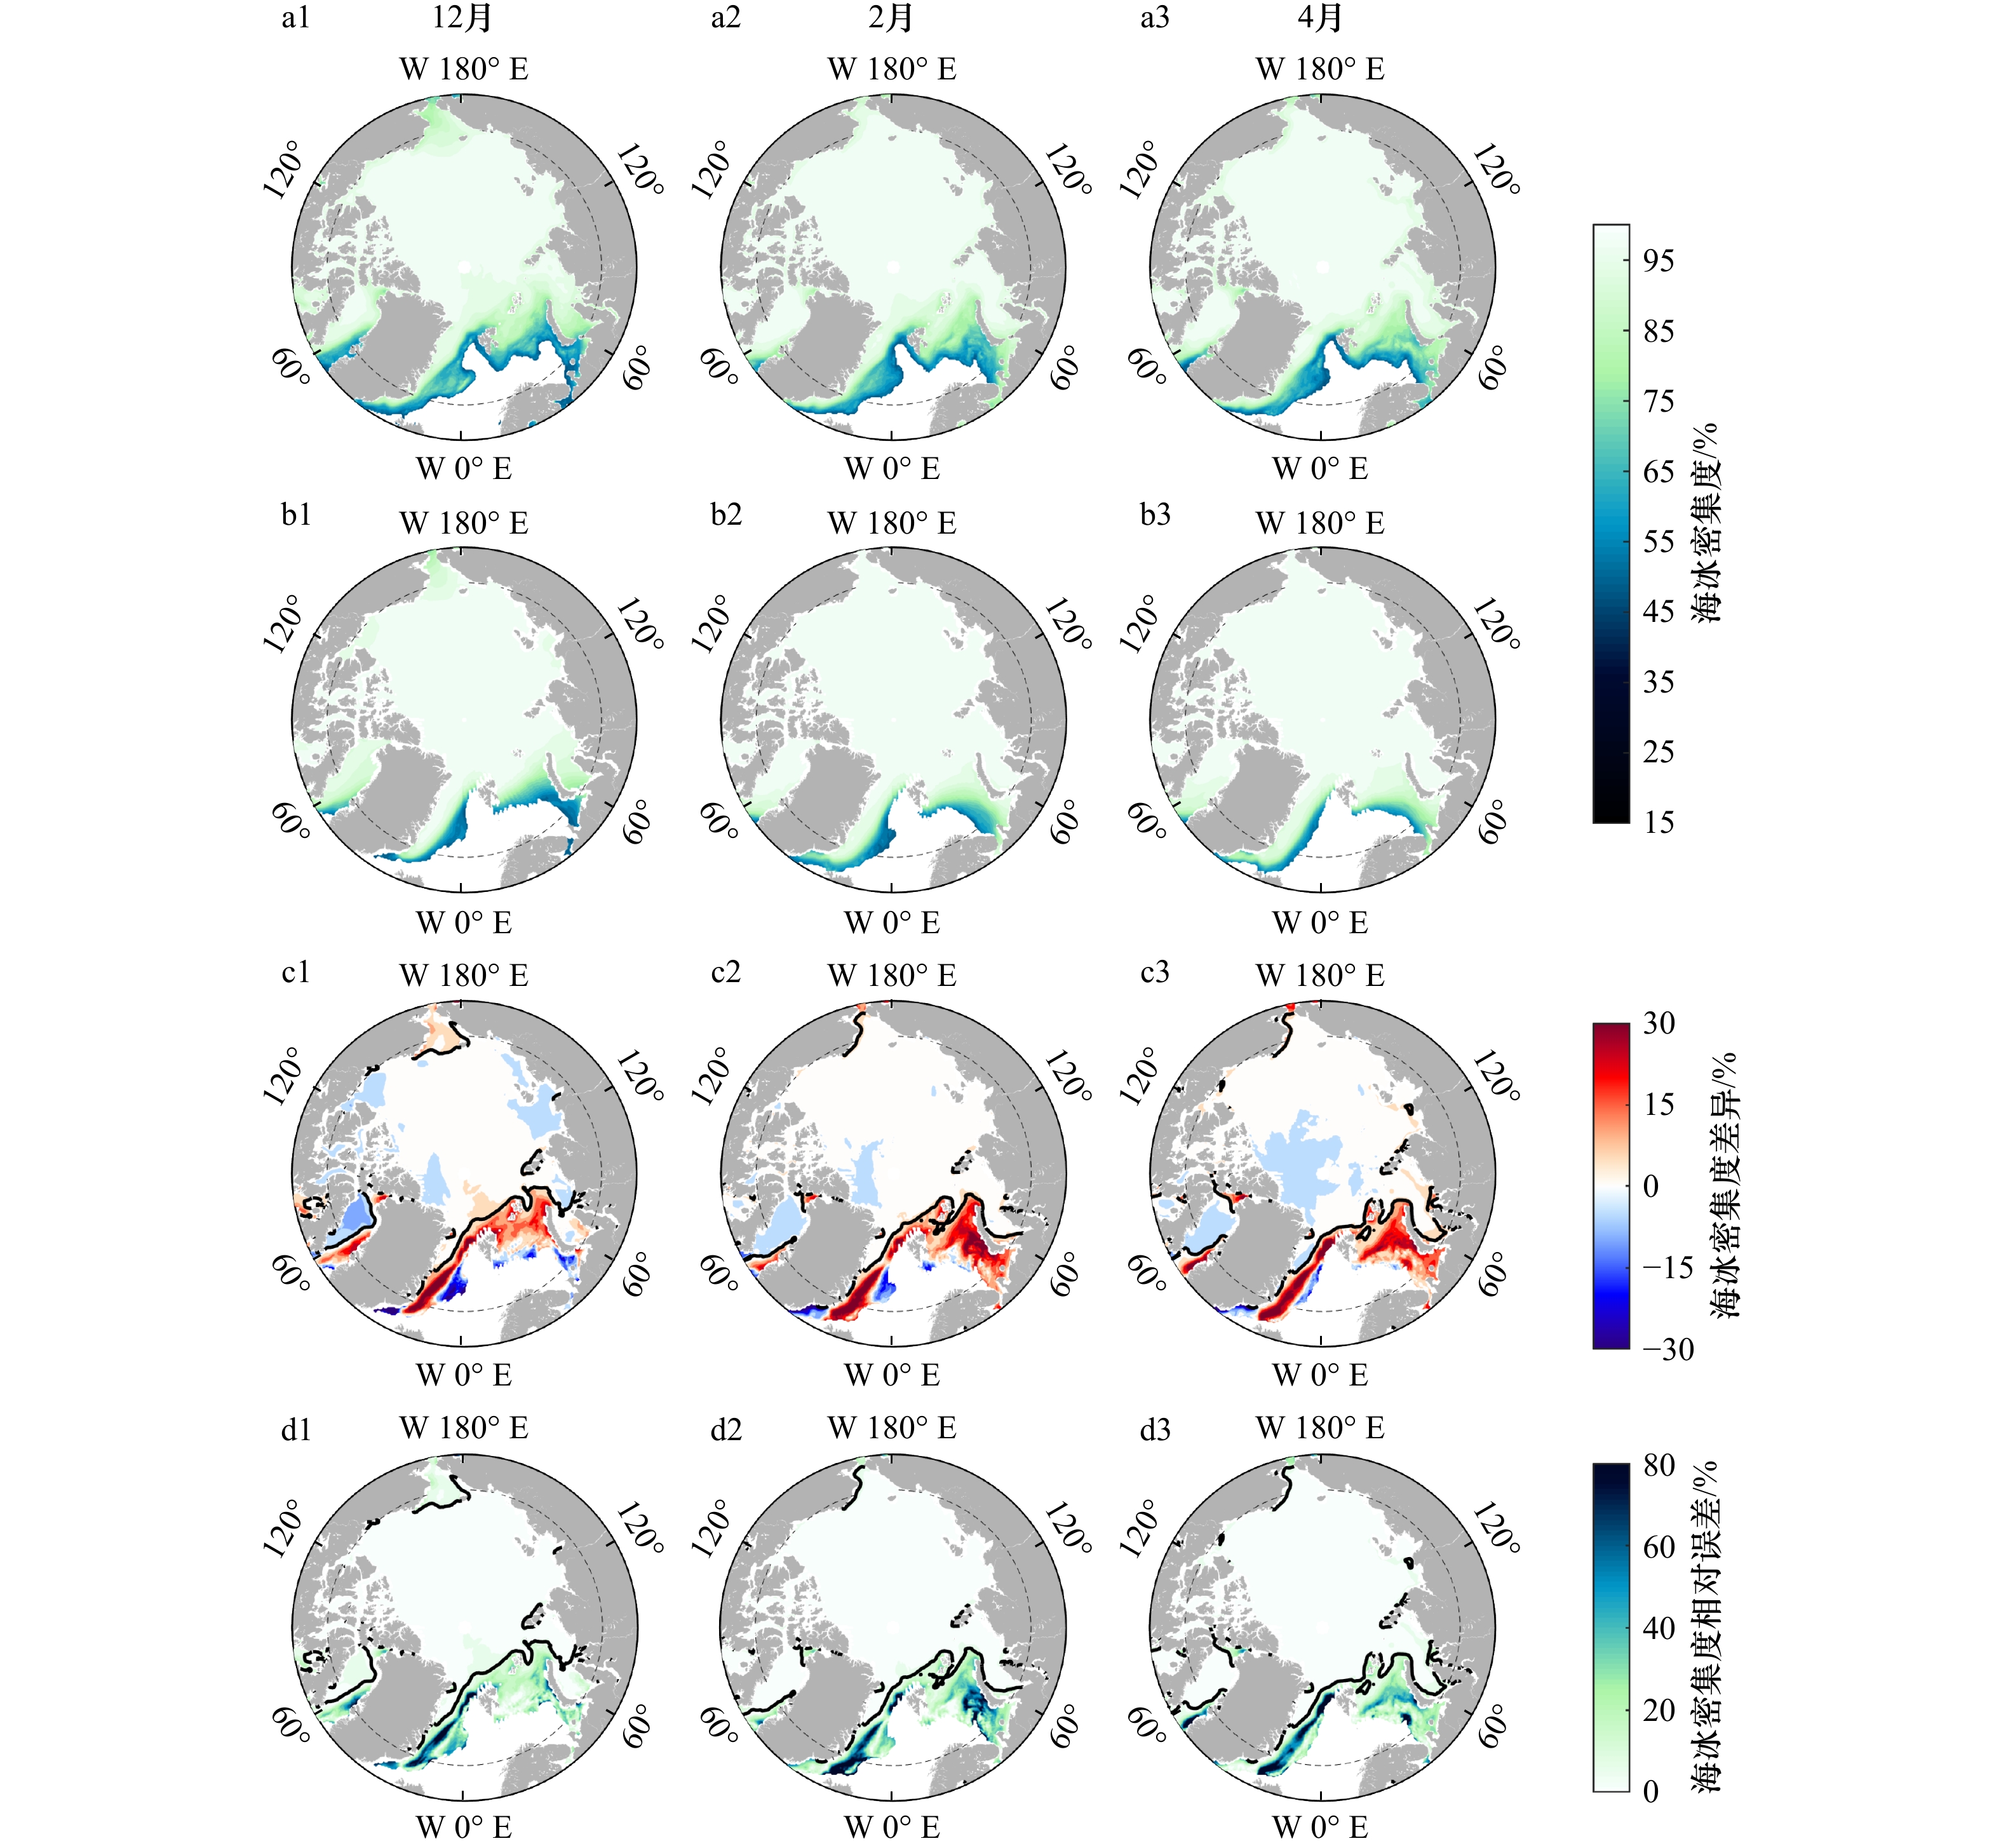
图 1 1980–2018年北极冬季(12月、2月、4月)气候态月平均海冰密集度(a1−b3)、海冰密集度差异(c1−c3)和相对误差(d1−d3)
数据来源:a. SSM/I;b. CICE;c. CICE−SSM/I。c、d中的黑线为SSM/I海冰密集度90%等值线;图中纬线为70°N
Fig. 1 Monthly mean sea ice concentration (a1−b3), sea ice concentration difference (c1−c3) and relative error of sea ice concentration (d1−d3) of Arctic winter (December, February, April) climatic regimes from 1980 to 2018
Date source: a. SSM/I; b. CICE; c. CICE−SSM/I. The black lines in c and d are the 90% contours of SSM/I sea ice density; the latitude line in the graph is 70°N

图 3 2010−2018年11月至翌年4月ERA5月平均2 m气温
图中纬线为70°N
Fig. 3 ERA5 monthly average 2 m temperature from November to April of the following year from 2010 to 2018
The latitude line in the graph is 70°N

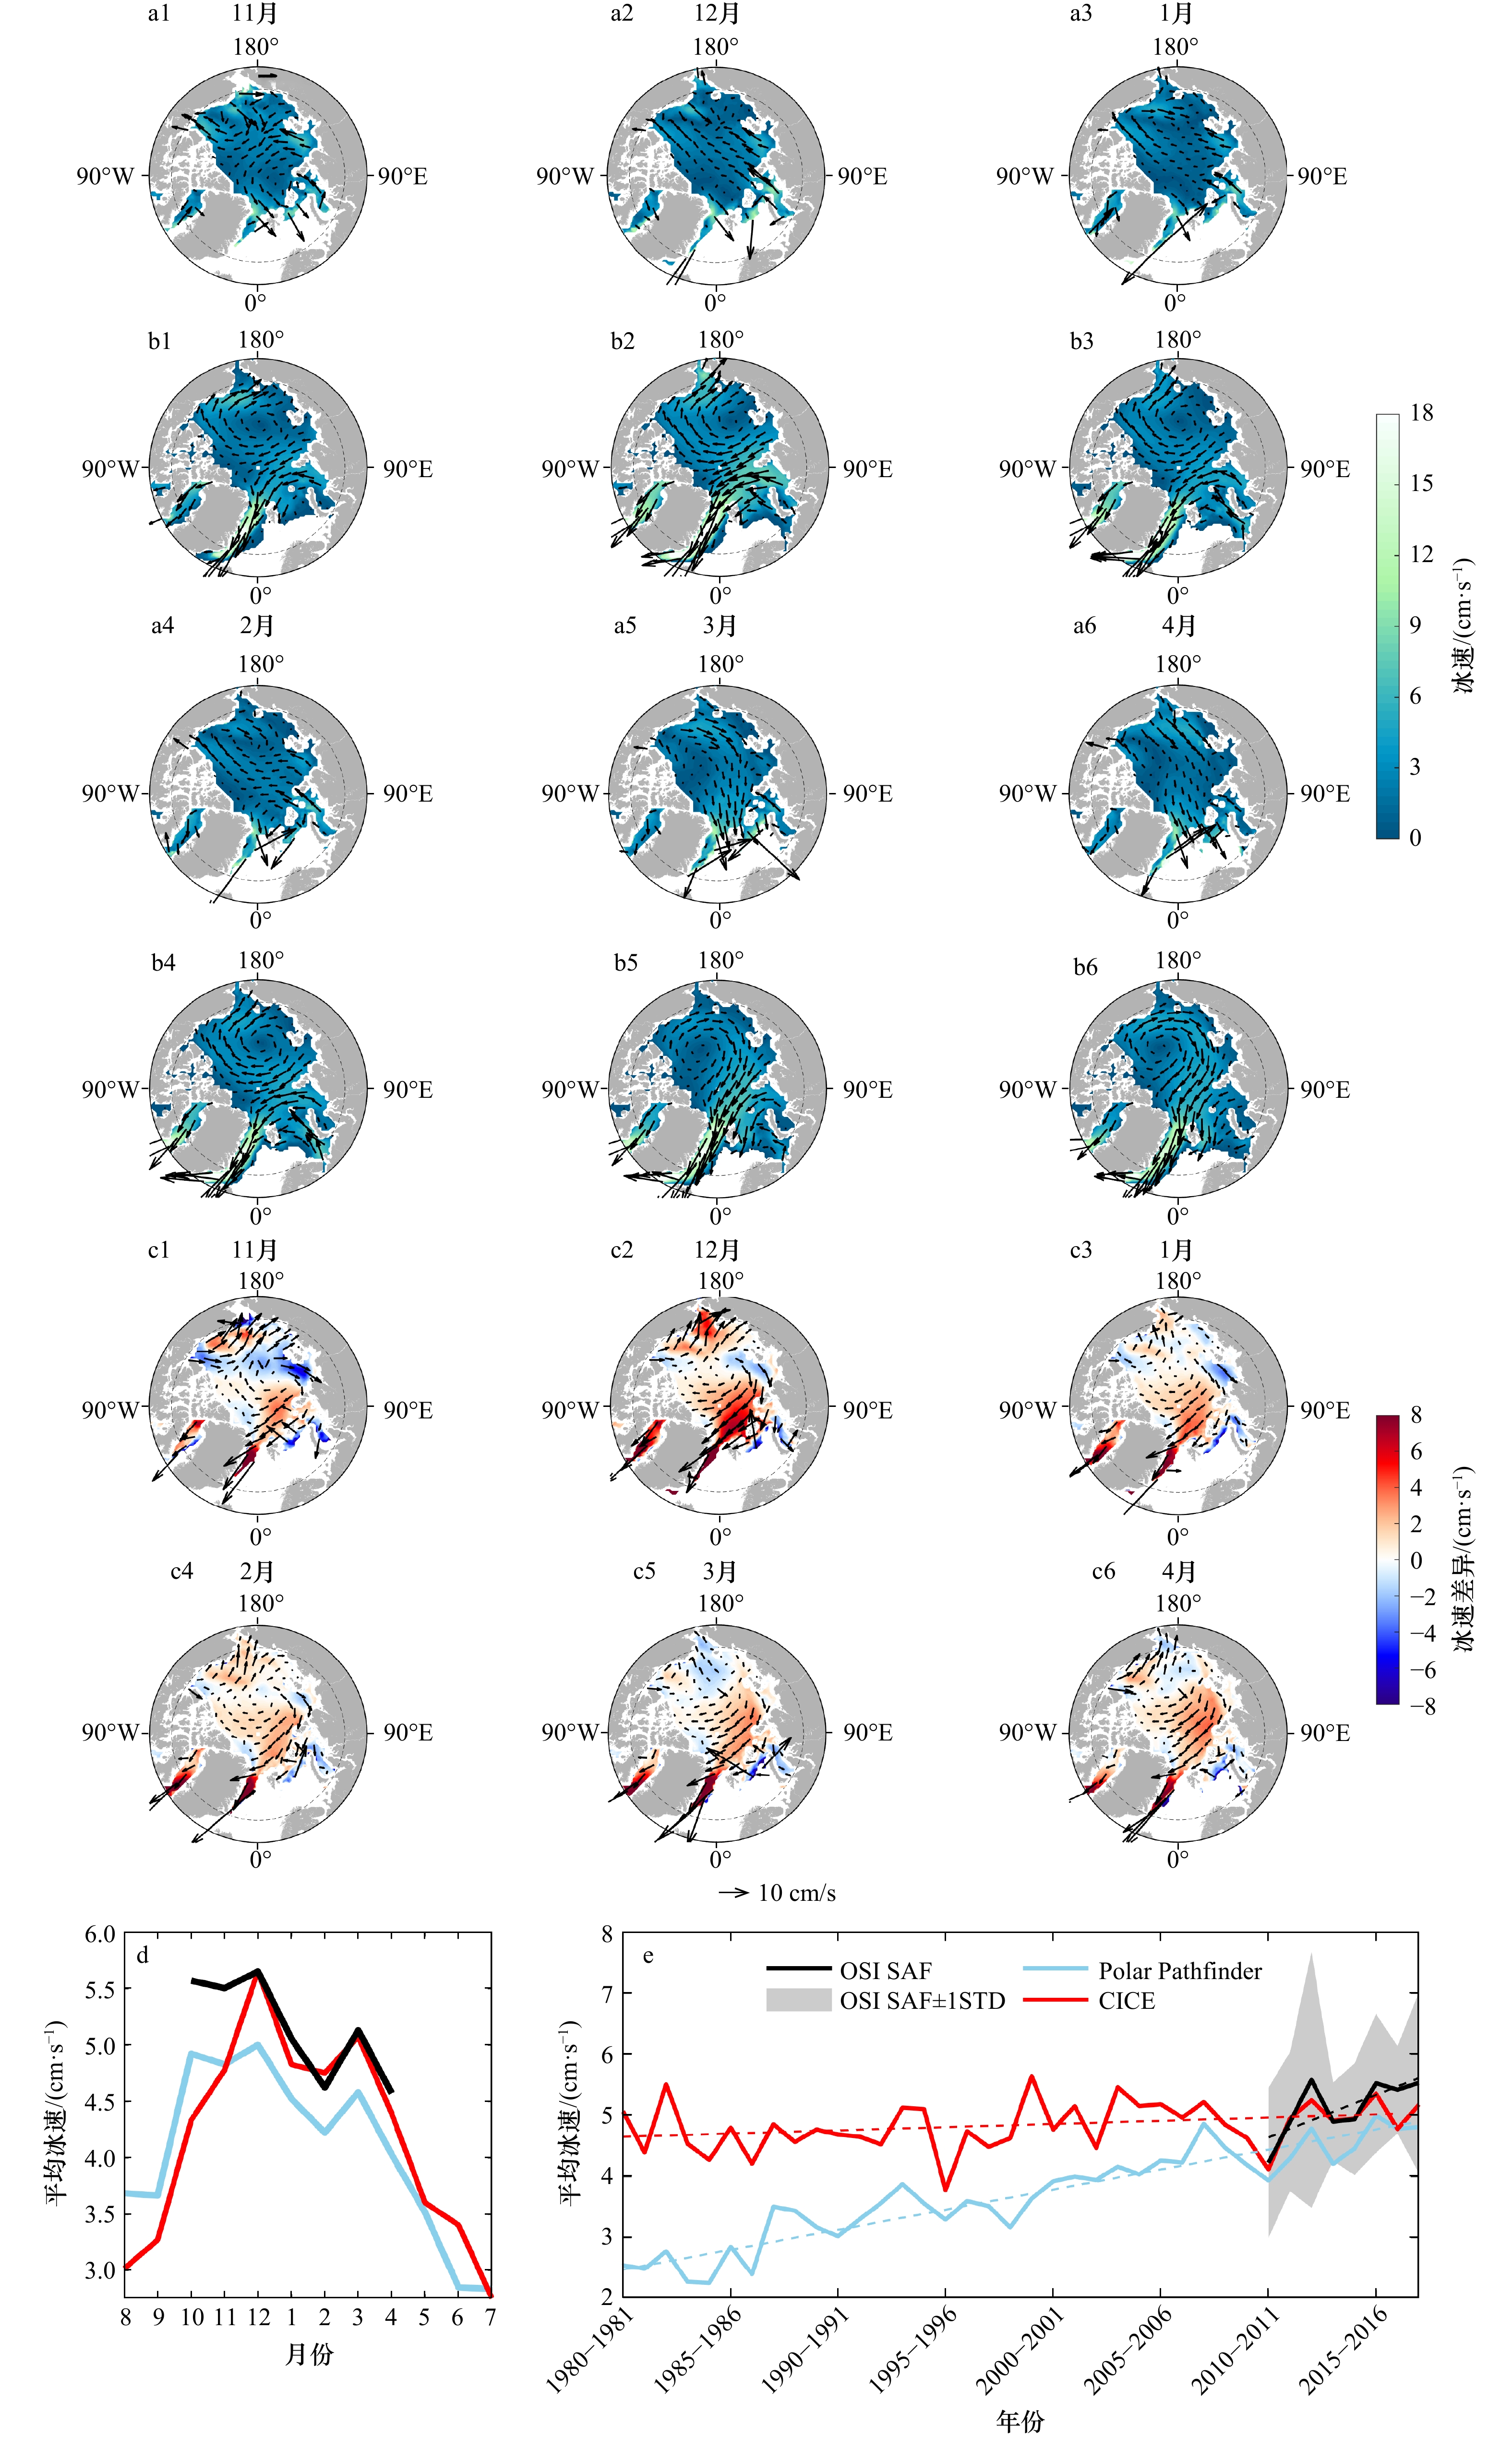
图 5 2010–2018年北极冬季(11月至翌年4月)OSISAF遥感观测冰速散度场(a1−a6)和CICE冰速散度场(b1−b6)
图中纬线为70°N
Fig. 5 OSISAF remotely observed ice velocity divergence fields (a1−a6) and CICE ice velocity divergence fields (b1−b6) for the Arctic winter (from November to April of the following year) from 2010 to 2018
The latitude line in the graph is 70°N

图 6 2010–2018年北极冬季(11月至翌年4月)OSISAF遥感观测冰速切变场(a1−a6)和CICE冰速切变场(b1−b6)
图中纬线为70°N
Fig. 6 OSISAF remotely observed ice velocity shear fields (a1−a6) and CICE ice velocity shear fields (b1−b6) for the Arctic winter (from November to April of the following year) from 2010 to 2018
The latitude line in the graph is 70°N
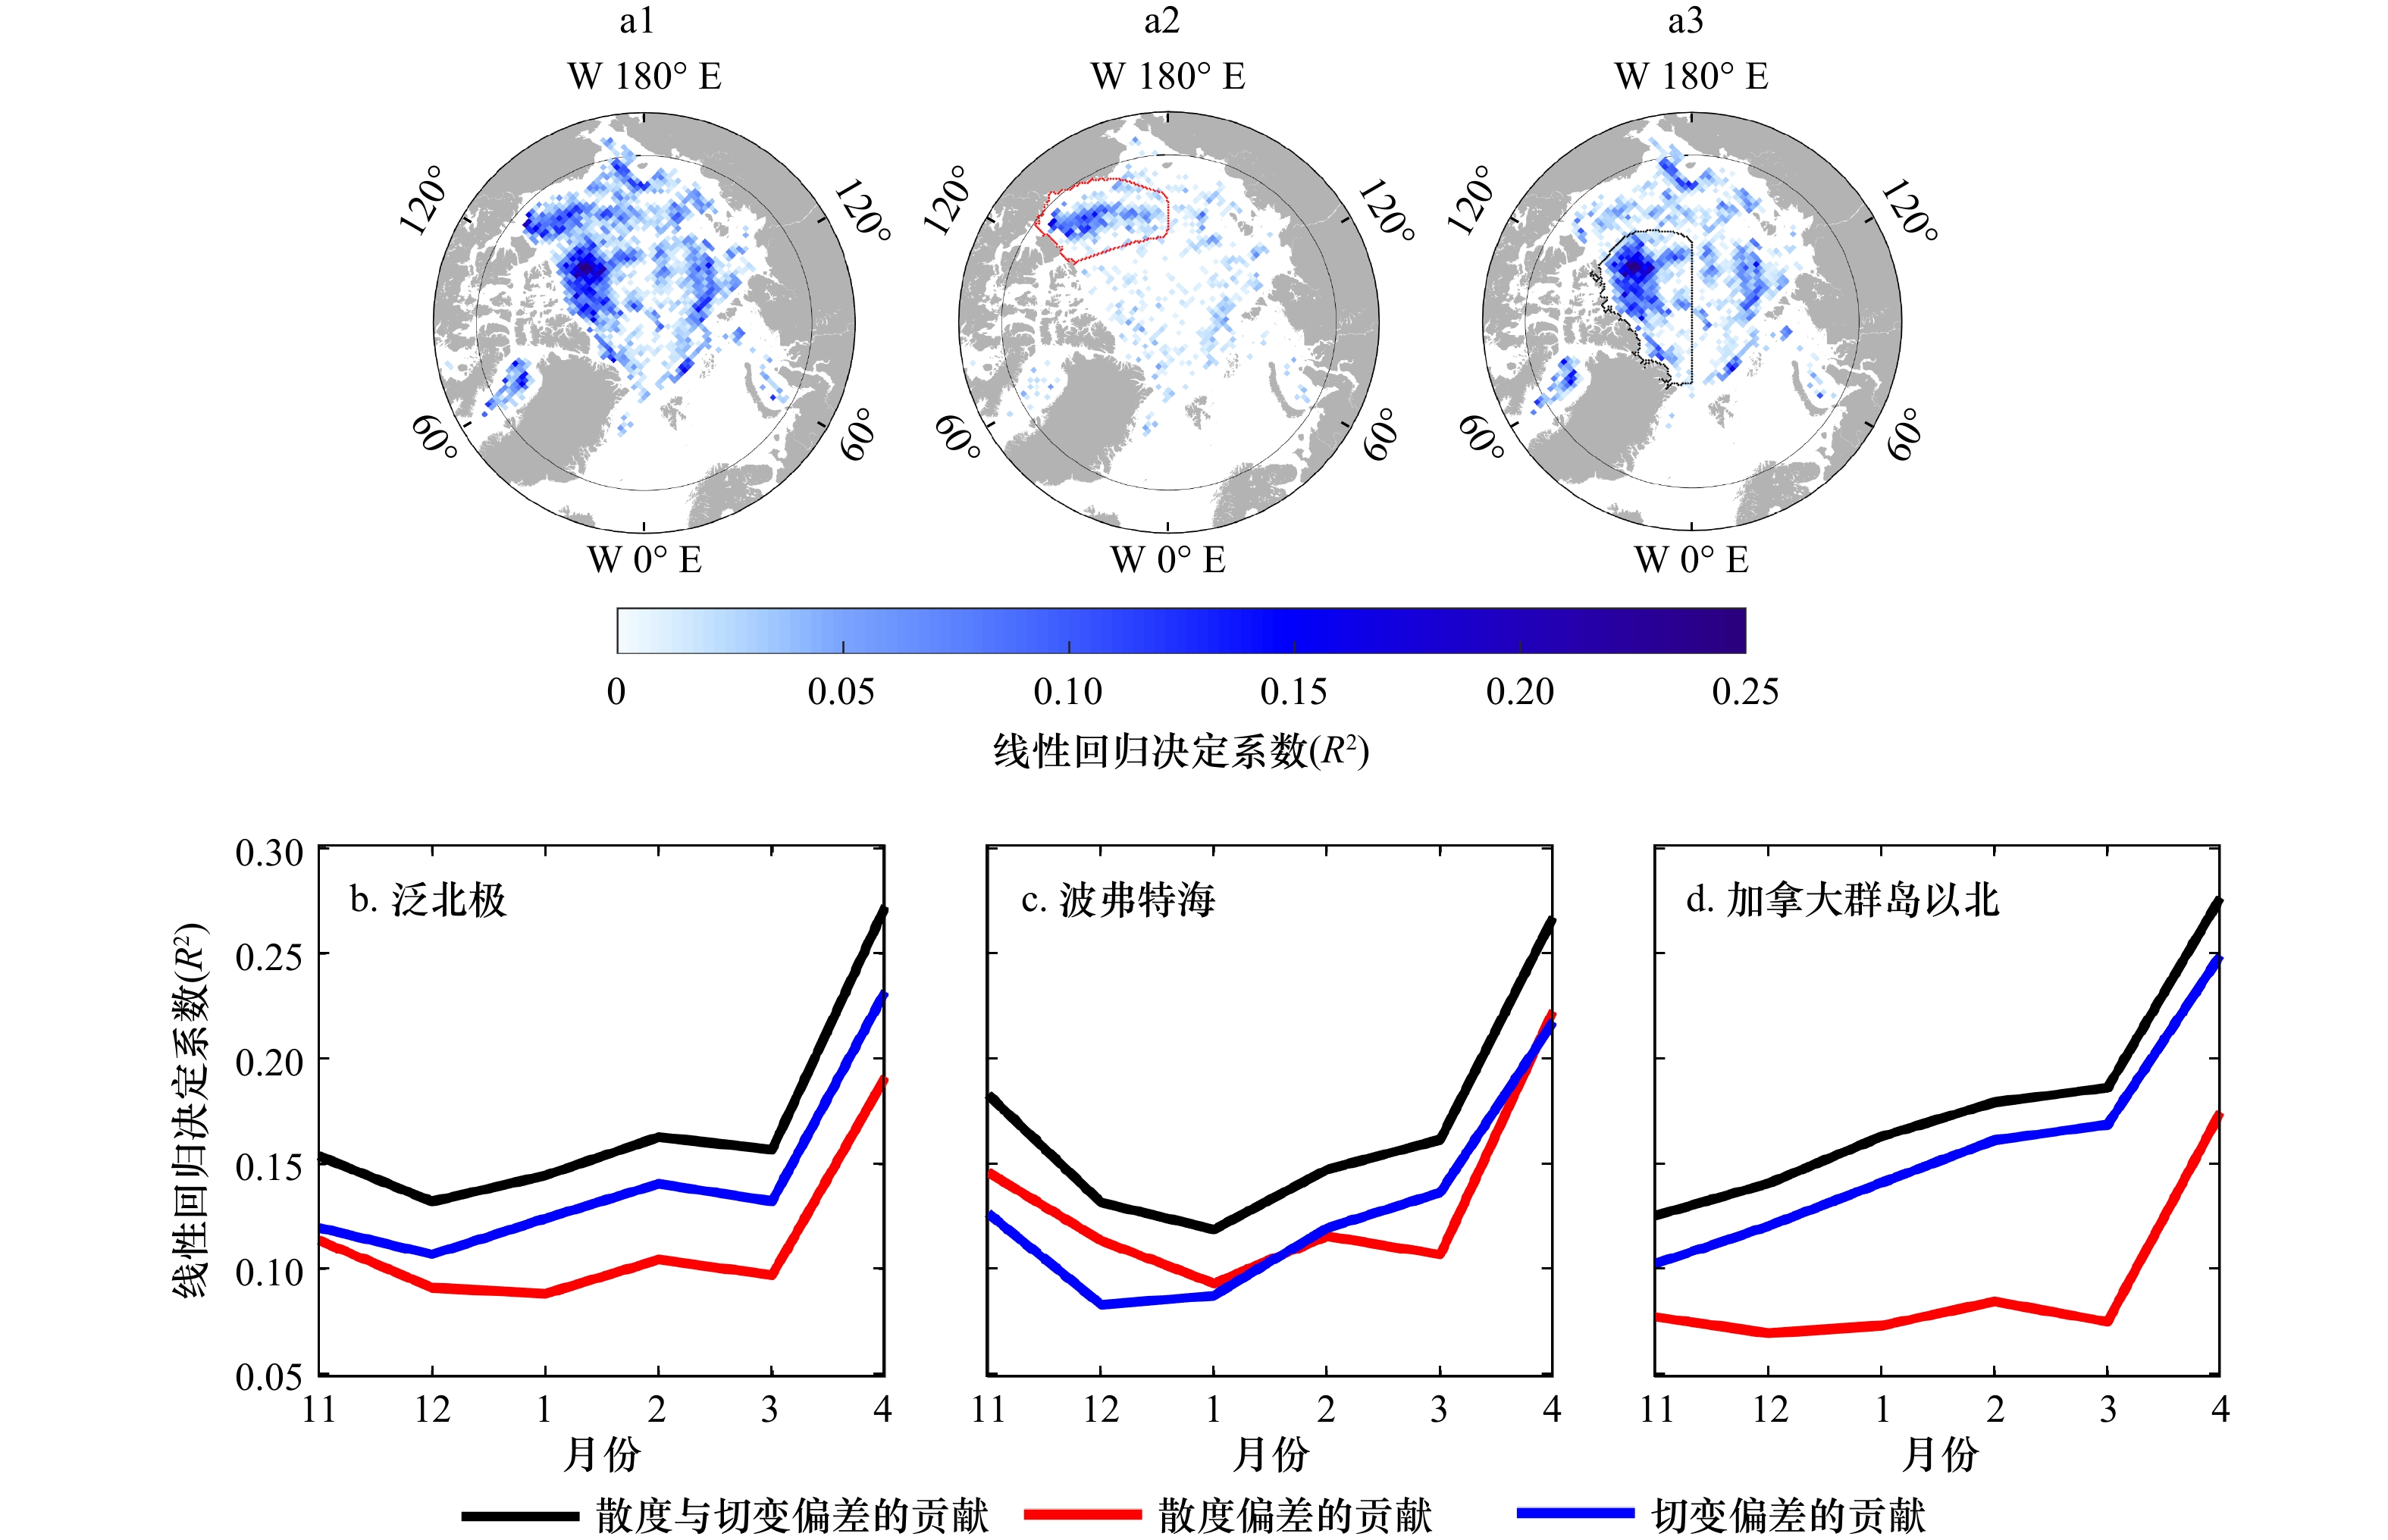
图 7 2010−2018年北极冬季(11月至翌年4月)平均冰速散度偏差和切变偏差对冰厚偏差(a1)、散度偏差对冰厚偏差(a2)、切变偏差对冰厚偏差(a3)的线性回归决定系数R2空间分布、11月至翌年4月泛北极区域的 R2时间序列(b)、a2中红线划定的波弗特海区域 R2时间序列(c)和a3中黑线划定的加拿大群岛以北海域 R2时间序列(d)
仅显示和统计通过99%显著性检验的数据
Fig. 7 Spatial distribution of the linear regression coefficients of determination (R2) of the mean ice velocity divergence bias and shear bias on ice thickness bias (a1), divergence bias on ice thickness bias (a2), shear bias on ice thickness bias (a3), R2 time series for the pan-Arctic region from November to April (b); R2 time series for the Beaufort Sea region delineated by the red line in a2 (c) and R2 time series of the sea north of the Canadian archipelago delineated by the black line in a3 (d) for the Arctic winter (from November to April of the following year) from 2010 to 2018
Only data that pass the 99% significance test are shown and counted
表 1 CICE模式主要参数化方案与参数设置
Tab. 1 Main parameterization schemes and parameter settings of CICE model
主要方案 方案设置 主要参数 参数设置 网格 gx1(320 × 384) 海冰厚度类别(ncat) 5 流变学方案 弹性–黏性–塑性流变学(EVP) 海冰垂直分层(nilyr) 7 海冰强度方案 Rothrock强度参数化 子周期数(ndte) 120 反照率参数化 Delta-Eddington辐射计算方案 成脊参数(μ) 3 热力学参数化 糊状层热力学方案 大气边界层迭代次数(natmiter) 5 融池参数化 地形学方案(Topographic scheme) 近红外海冰反照率(albicei) 0.36 海气拖曳参数化 组合拖曳方案 可见光海冰反照率(albicev) 0.78 注:gx1代表分辨率约为1°。  下载: 导出CSV
表 2 2010−2018年冬季(11月至翌年4月)70°N以北模拟海冰厚度相对CS2SMOS观测数据的月各项误差统计结果
Tab. 2 Monthly errors statistics of simulated sea ice thickness north of 70°N relative to CS2SMOS observations for winter (from November to April of the following year), 2010−2018
误差类型 11月 12月 1月 2月 3月 4月 总计 ME/m 0.24 0.19 0.17 0.13 0.10 0.15 0.16 MAE/m 0.48 0.46 0.47 0.47 0.47 0.48 0.47 RMSE/m 0.69 0.65 0.65 0.64 0.64 0.64 0.65 RE/% 49.98 38.00 33.93 30.64 30.52 40.03 37.07 注:ME:平均误差;MAE:平均绝对误差;RMSE:均方根误差;RE:相对误差。
下载: 导出CSV
表 3 2010−2018年70°N以北模拟海冰厚度相对CS2SMOS观测的冬季(11月至翌年4月)各项误差统计结果
Tab. 3 Average winter (from November to April of the following year) errors statistics of simulated sea ice thickness north of 70°N relative to CS2SMOS observations, 2010−2018
误差类型 2010−2011年 2011−2012年 2012−2013年 2013−2014年 2014−2015年 2015−2016年 2016−2017年 2017−2018年 ME/m 0.19 0.32 0.27 0.08 0.07 0.21 0.02 0.06 MAE/m 0.53 0.56 0.50 0.44 0.47 0.59 0.45 0.45 RMSE/m 0.73 0.80 0.71 0.57 0.66 0.79 0.58 0.62 RE/% 39.72 45.73 41.74 34.53 30.24 57.83 30.77 39.93 注:ME:平均误差;MAE:平均绝对误差;RMSE:均方根误差;RE:相对误差;2010−2011年代表2010年11月至2011年4月,以此类推。
下载: 导出CSV
表 4 2010−2018年冬季(11月至翌年4月)70°N以北模拟冰速相对OSISAF冰速的月各项误差统计结果
Tab. 4 Monthly errors statistics of simulated ice velocity north of 70°N relative to OSISAF ice velocity for each month of winter (from November to April of the following year) from 2010 to 2018
误差类型 11月 12月 1月 2月 3月 4月 总计 ME/(cm·s−1) −1.55 −1.26 −0.73 −0.45 −0.68 −0.52 −0.84 MAE/(cm·s−1) 2.96 2.99 3.23 2.93 2.95 2.58 2.94 RMSE/(cm·s−1) 4.18 4.17 4.43 4.24 4.20 3.50 4.13 RE/% 67.40 68.80 105.02 105.19 121.02 121.51 99.55 注:ME:平均误差;MAE:平均绝对误差;RMSE:均方根误差;RE:相对误差。
下载: 导出CSV
表 5 2010−2018年逐年70°N以北模拟冰速相对OSISAF观测冰速的冬季(11月至翌年4月)各项误差统计结果
Tab. 5 Winter (from November to April of the following year) errors statistics of simulated ice velocity north of 70°N relative to OSISAF observed ice velocity year by year from 2010 to 2018
误差类型 2010−2011年 2011−2012年 2012−2013年 2013−2014年 2014−2015年 2015−2016年 2016−2017年 2017−2018年 ME/(cm·s−1) −0.43 −1.04 −2.04 −0.58 −0.37 −0.91 −0.77 −0.72 MAE/(cm·s−1) 2.41 2.98 3.34 2.37 3.29 3.21 2.90 3.17 RMSE/(cm·s−1) 3.33 3.84 4.64 3.36 4.42 4.86 4.19 4.43 RE/% 86.63 107.90 94.17 82.87 133.20 123.65 77.61 91.91 注:ME:平均误差,MAE:平均绝对误差,RMSE:均方根误差,RE:相对误差;2010−2011年代表2010年11月至201年4月,以此类推。
下载: 导出CSV
-
[1] Walsh J E. The role of sea ice in climatic variability: theories and evidence[J]. Atmosphere-Ocean, 1983, 21(3): 229−242. doi: 10.1080/07055900.1983.9649166 [2] Stroeve J, Holland M M, Meier W, et al. Arctic sea ice decline: faster than forecast[J]. Geophysical Research Letters, 2007, 34(9): L09501. [3] Ding Qinghua, Schweiger A, L’Heureux M, et al. Influence of high-latitude atmospheric circulation changes on summertime Arctic sea ice[J]. Nature Climate Change, 2017, 7(4): 289−295. doi: 10.1038/nclimate3241 [4] Renner A H H, Gerland S, Haas C, et al. Evidence of Arctic sea ice thinning from direct observations[J]. Geophysical Research Letters, 2014, 41(14): 5029−5036. doi: 10.1002/2014GL060369 [5] Kacimi S, Kwok R. Arctic snow depth, ice thickness, and volume from ICESat-2 and CryoSat-2: 2018–2021[J]. Geophysical Research Letters, 2022, 49(5): e2021GL097448. [6] Rampal P, Weiss J, Marsan D. Positive trend in the mean speed and deformation rate of Arctic sea ice, 1979–2007[J]. Journal of Geophysical Research: Oceans, 2009, 114(C5): C05013. [7] Kwok R, Spreen G, Pang S. Arctic sea ice circulation and drift speed: Decadal trends and ocean currents[J]. Journal of Geophysical Research: Oceans, 2013, 118(5): 2408−2425. doi: 10.1002/jgrc.20191 [8] Rothrock D A, Zhang J, Yu Youran. The Arctic ice thickness anomaly of the 1990s: a consistent view from observations and models[J]. Journal of Geophysical Research: Oceans, 2003, 108(C3): 3083. doi: 10.1029/2001JC001208 [9] Kwok R. Arctic sea ice thickness, volume, and multiyear ice coverage: losses and coupled variability (1958–2018)[J]. Environmental Research Letters, 2018, 13(10): 105005. doi: 10.1088/1748-9326/aae3ec [10] Spreen G, Kwok R, Menemenlis D. Trends in Arctic sea ice drift and role of wind forcing: 1992−2009[J]. Geophysical Research Letters, 2011, 38(19): L19501. [11] Zhang Fanyi, Pang Xiaoping, Lei Ruibo, et al. Arctic sea ice motion change and response to atmospheric forcing between 1979 and 2019[J]. International Journal of Climatology, 2022, 42(3): 1854−1876. doi: 10.1002/joc.7340 [12] Docquier D, Massonnet F, Barthélemy A, et al. Relationships between Arctic sea ice drift and strength modelled by NEMO-LIM3.6[J]. The Cryosphere, 2017, 11(6): 2829−2846. doi: 10.5194/tc-11-2829-2017 [13] Chikhar K, Lemieux J F, Dupont F, et al. Sensitivity of ice drift to form drag and ice strength parameterization in a coupled ice–ocean model[J]. Atmosphere-Ocean, 2019, 57(5): 329−349. doi: 10.1080/07055900.2019.1694859 [14] Itkin P, Spreen G, Hvidegaard S M, et al. Contribution of deformation to sea ice mass balance: a case study from an N-ICE2015 storm[J]. Geophysical Research Letters, 2018, 45(2): 789−796. doi: 10.1002/2017GL076056 [15] Kwok R, Cunningham G F. Contributions of growth and deformation to monthly variability in sea ice thickness north of the coasts of Greenland and the Canadian Arctic archipelago[J]. Geophysical Research Letters, 2016, 43(15): 8097−8105. doi: 10.1002/2016GL069333 [16] von Albedyll L, Haas C, Dierking W. Linking sea ice deformation to ice thickness redistribution using high-resolution satellite and airborne observations[J]. The Cryosphere, 2021, 15(5): 2167−2186. doi: 10.5194/tc-15-2167-2021 [17] von Albedyll L, Hendricks S, Grodofzig R, et al. Thermodynamic and dynamic contributions to seasonal Arctic sea ice thickness distributions from airborne observations[J]. Elementa: Science of the Anthropocene, 2022, 10(1): 00074. doi: 10.1525/elementa.2021.00074 [18] Krumpen T, von Albedyll L, Goessling H F, et al. MOSAiC drift expedition from October 2019 to July 2020: sea ice conditions from space and comparison with previous years[J]. The Cryosphere, 2021, 15(8): 3897−3920. doi: 10.5194/tc-15-3897-2021 [19] Barnhart K R, Miller C R, Overeem I, et al. Mapping the future expansion of Arctic open water[J]. Nature Climate Change, 2016, 6(3): 280−285. doi: 10.1038/nclimate2848 [20] DuVivier A K, Holland M M, Kay J E, et al. Arctic and Antarctic sea ice mean state in the community earth system model version 2 and the influence of atmospheric chemistry[J]. Journal of Geophysical Research: Oceans, 2020, 125(8): e2019JC015934. [21] Shu Qi, Wang Qiang, Song Zhenya, et al. Assessment of sea ice extent in CMIP6 with comparison to observations and CMIP5[J]. Geophysical Research Letters, 2020, 47(9): e2020GL087965. [22] Wang Huazhao, Zhang Lijun, Chu Min, et al. Advantages of the latest Los Alamos sea-ice model (CICE): evaluation of the simulated spatiotemporal variation of Arctic sea ice[J]. Atmospheric and Oceanic Science Letters, 2020, 13(2): 113−120. doi: 10.1080/16742834.2020.1712186 [23] 王松, 苏洁, 储敏, 等. BCC_CSM对北极海冰的模拟: CMIP5和CMIP6历史试验比较[J]. 海洋学报, 2020, 42(5): 49−64.Wang Song, Su Jie, Chu Min, et al. Comparison of simulation results of the Arctic sea ice by BCC_CSM: CMIP5 and CMIP6 historical experiments[J]. Haiyang Xuebao, 2020, 42(5): 49−64. [24] Yu Xiaoyong, Rinke A, Dorn W, et al. Evaluation of Arctic sea ice drift and its dependency on near-surface wind and sea ice conditions in the coupled regional climate model HIRHAM–NAOSIM[J]. The Cryosphere, 2020, 14(5): 1727−1746. doi: 10.5194/tc-14-1727-2020 [25] 房永杰, 储敏, 吴统文, 等. CICE5.0与BCC_CSM2.0模式的耦合及对北极海冰的模拟评估[J]. 海洋学报, 2017, 39(5): 33−43.Fang Yongjie, Chu Min, Wu Tongwen, et al. Couping of CICE5.0 with BCC_CSM2.0 model and its performance evaluation on Arctic sea ice simulation[J]. Haiyang Xuebao, 2017, 39(5): 33−43. [26] Ricker R, Hendricks S, Kaleschke L, et al. A weekly Arctic sea-ice thickness data record from merged CryoSat-2 and SMOS satellite data[J]. The Cryosphere, 2017, 11(4): 1607−1623. doi: 10.5194/tc-11-1607-2017 [27] Zhang Jinlun, Rothrock D A. Modeling global sea ice with a thickness and enthalpy distribution model in generalized curvilinear coordinates[J]. Monthly Weather Review, 2003, 131(5): 845−861. doi: 10.1175/1520-0493(2003)131<0845:MGSIWA>2.0.CO;2 [28] Tschudi M A, Meier W N, Stewart J S. An enhancement to sea ice motion and age products at the National Snow and Ice Data Center (NSIDC)[J]. The Cryosphere, 2020, 14(5): 1519−1536. doi: 10.5194/tc-14-1519-2020 [29] Lavergne T, Eastwood S, Teffah Z, et al. Sea ice motion from low-resolution satellite sensors: an alternative method and its validation in the Arctic[J]. Journal of Geophysical Research: Oceans, 2010, 115(C10): C10032. [30] Cavalieri D J, Parkinson C L, Gloersen P, et al. Deriving long-term time series of sea ice cover from satellite passive-microwave multisensor data sets[J]. Journal of Geophysical Research: Oceans, 1999, 104(C7): 15803−15814. doi: 10.1029/1999JC900081 [31] Wu Shuqiang, Zeng Qingcun, Bi Xunqiang. Modeling of Arctic sea ice variability during 1948–2009: validation of two versions of the Los Alamos sea ice model (CICE)[J]. Atmospheric and Oceanic Science Letters, 2015, 8(4): 215−219. doi: 10.1080/16742834.2015.11447262 [32] Hersbach H, Bell B, Berrisford P, et al. The ERA5 global reanalysis[J]. Quarterly Journal of the Royal Meteorological Society, 2020, 146(730): 1999−2049. doi: 10.1002/qj.3803 [33] Kerbyson D J, Jones P W. A performance model of the parallel ocean program[J]. The International Journal of High Performance Computing Applications, 2005, 19(3): 261−276. doi: 10.1177/1094342005056114 [34] Steele M, Morley R, Ermold W. PHC: a global ocean hydrography with a high-quality Arctic Ocean[J]. Journal of Climate, 2001, 14(9): 2079−2087. doi: 10.1175/1520-0442(2001)014<2079:PAGOHW>2.0.CO;2 [35] Kwok R, Hunke E C, Maslowski W, et al. Variability of sea ice simulations assessed with RGPS kinematics[J]. Journal of Geophysical Research: Oceans, 2008, 113(C11): C11012. doi: 10.1029/2008JC004783 [36] Kumar R, Li Junde, Hedstrom K, et al. Intercomparison of Arctic sea ice simulation in ROMS-CICE and ROMS-Budgell[J]. Polar Science, 2021, 29: 100716. doi: 10.1016/j.polar.2021.100716 [37] Sumata H, Lavergne T, Girard-Ardhuin F, et al. An intercomparison of Arctic ice drift products to deduce uncertainty estimates[J]. Journal of Geophysical Research: Oceans, 2014, 119(8): 4887−4921. doi: 10.1002/2013JC009724 [38] 施骞, 苏洁. 三种国际主流的北极卫星遥感冰速产品评估和分析[J]. 遥感学报, 2020, 24(7): 867−882.Shi Qian, Su Jie. Assessment of Arctic remote sensing ice motion products based on ice drift buoys[J]. Journal of Remote Sensing, 2020, 24(7): 867−882. [39] Hansen E, Gerland S, Granskog M A, et al. Thinning of Arctic sea ice observed in Fram Strait: 1990–2011[J]. Journal of Geophysical Research Oceans, 2013, 118: 5202−5221. [40] Rothrock D A. The energetics of the plastic deformation of pack ice by ridging[J]. Journal of Geophysical Research, 1975, 80(33): 4514−4519. doi: 10.1029/JC080i033p04514 [41] Thorndike A S, Rothrock D A, Maykut G A, et al. The thickness distribution of sea ice[J]. Journal of Geophysical Research, 1975, 80(33): 4501−4513. doi: 10.1029/JC080i033p04501 [42] Martin T, Tsamados M, Schroeder D, et al. The impact of variable sea ice roughness on changes in Arctic Ocean surface stress: a model study[J]. Journal of Geophysical Research: Oceans, 2016, 121(3): 1931−1952. doi: 10.1002/2015JC011186 [43] Hoffman J P, Ackerman S A, Liu Yinghui, et al. A 20-year climatology of sea ice leads detected in infrared satellite imagery using a convolutional neural network[J]. Remote Sensing, 2022, 14(22): 5763. doi: 10.3390/rs14225763 -


计量
- 文章访问数: 429
- HTML全文浏览量: 252
- PDF下载量: 56
- 被引次数: 0
