

Analysis of the temporal and spatial distribution of suspended sediment concentration and its influencing factors in the Huanghe River Estuary based on GEE
-
摘要: 黄河三角洲作为我国重要的生态功能区,探究入海口处表层悬浮泥沙浓度(Suspended Sediment Concentration, SSC)分布及其影响因素对沉积物侵蚀再悬浮、河口海岸带生态过程等具有指导意义。本文基于色度角与SSC之间的关系建立了适于黄河口及邻近海域的SSC反演模型(R2 = 0.80,MRE = 11.0%,RMSE = 1.35 mg/L)。借助GEE平台,研究得到2000−2021年黄河口及邻近海域SSC的时空分布特征和变化规律,并从自然和人类活动两方面进行影响因素分析。研究区年均SSC呈波动下降的趋势(−1.83 mg/(L·a));空间分布表现为由近岸向远岸逐渐降低的趋势;扩散区间(年均SSC > 20 mg/L)仅在距离河口4.8~14.6 km之间,黄河入海泥沙对现行黄河口处泥沙扩散影响有限。波浪与悬浮泥沙浓度存在相同的季节特征,非调水调沙期间,有效波高与SSC年代际月均值呈现正相关关系(r = 0.66,p < 0.01);调水调沙期间,现行黄河口门以及莱州湾处SSC受风速、有效波高影响有限,调水调沙占主导地位。调水调沙期间的来沙系数与高浓度区面积变化率呈正相关的关系,调水调沙结束后(16 d内),高浓度区(SSC > 200 mg/L)边界由距沿岸约1.3 km扩大至约2.5 km。
-
关键词:
- GEE (Google Earth Engine)平台 /
- 色度角 /
- 黄河口及邻近海域 /
- 悬浮泥沙浓度 /
- 调水调沙
Abstract: The Huanghe River Delta is an important ecological function area in China. It is of guiding significance to explore the distribution of suspended sediment concentration (SSC) at the estuary and its influencing factors for sediment erosion and re-suspension, and the ecological process in the estuary and coastal zone. Based on the relationship between chromaticity angle and SSC, an SSC inversion model (R2 = 0.80, MRE = 11.0%, RMSE = 1.35 mg/L) suitable for the Huanghe River Estuary and its adjacent sea areas is established in this paper. With the help of the GEE (Google Earth Engine) platform, the spatial and temporal distribution characteristics and changing rules of SSC in the Huanghe River Estuary and its adjacent sea area during the 22 years from 2000 to 2021 were studied, and the influencing factors were analyzed from two aspects of nature and human activities. The annual average value of SSC in the study area showed a downward trend (−1.83 mg/(L·a)). The spatial distribution shows that SSC gradually decreases from near shore to far shore; the diffusion interval (SSC > 20 mg/(L·a)) is only 4.8−14.6 km away from the estuary, and the influence of sediment from the Yellow River on the current sediment diffusion at the estuary is limited. The wave and suspended sediment concentration have the same seasonal characteristics. During the non-water and sediment regulation period, there is a positive correlation between the effective wave height and the SSC interdecadal monthly average (r = 0.66, p < 0.01). During the period of water and sediment regulation, the current SSC at the mouth of the Huanghe River and Laizhou Bay is limited by wind speed and effective wave height, and water and sediment regulation is dominant. During the period of water and sediment regulation, there is a positive correlation between the incoming sediment coefficient and the area change rate of high-concentration areas. After the water and sediment regulation (within 16 days), the boundary of the high concentration area (SSC > 200 mg/L) is expanded from about 1.3 km to about 2.5 km from the coast. -
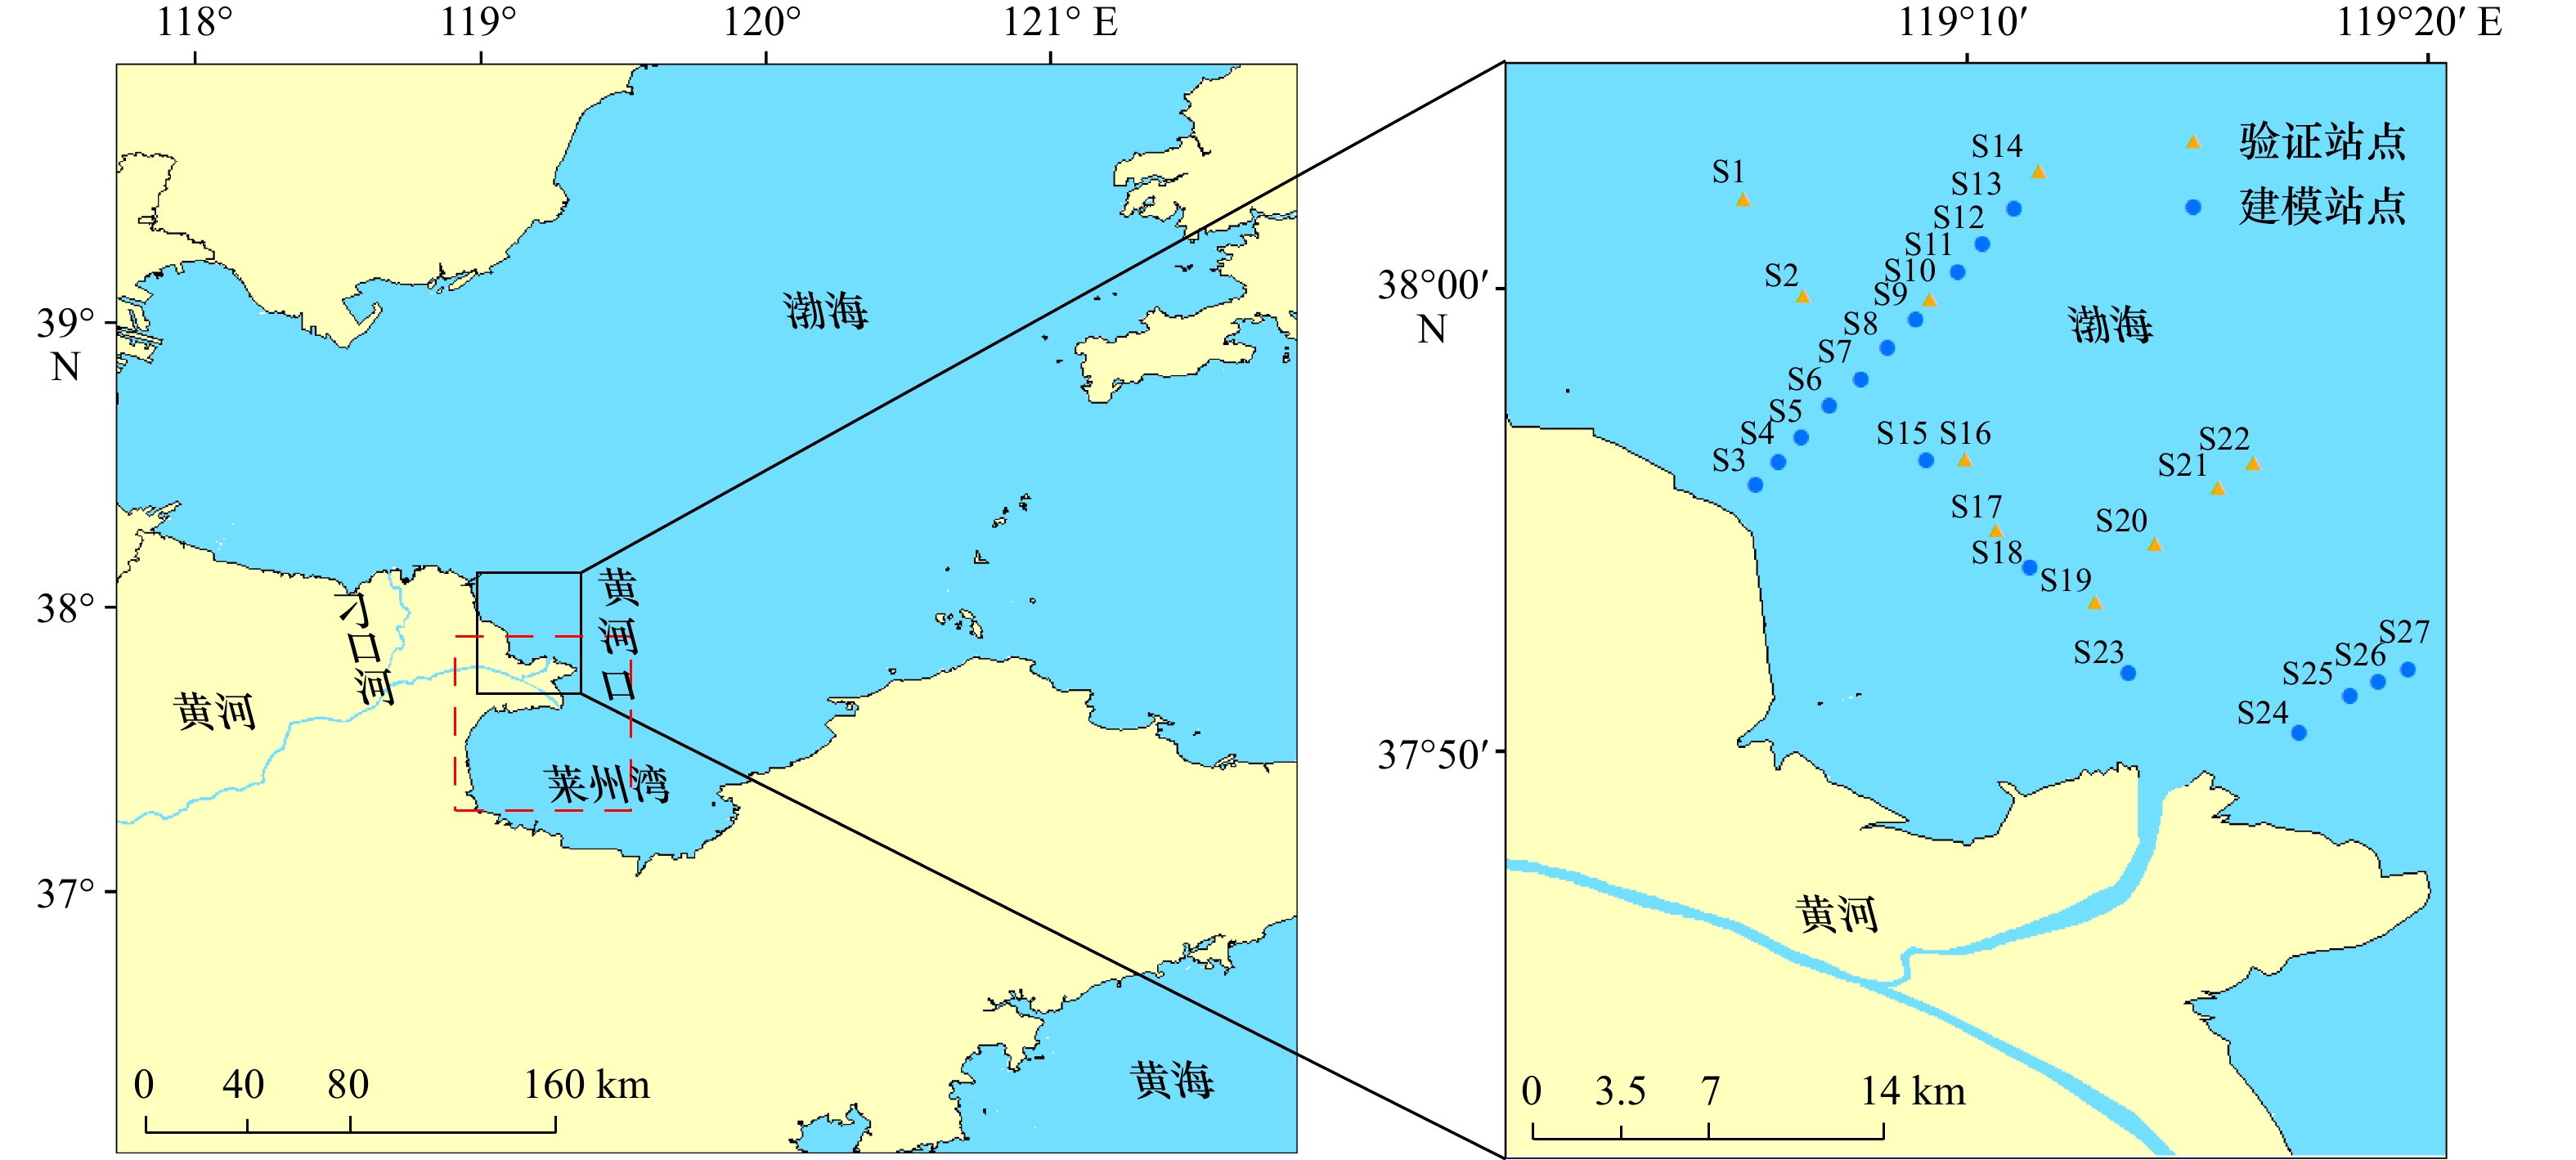
图 1 黄河口及邻近海域采样站点示意图
图中红框为5.3.2节中的研究范围
Fig. 1 Schematic diagram of sampling stations in Huanghe River Estuary and adjacent sea areas
Red box is the research scope in Section 5.3.2
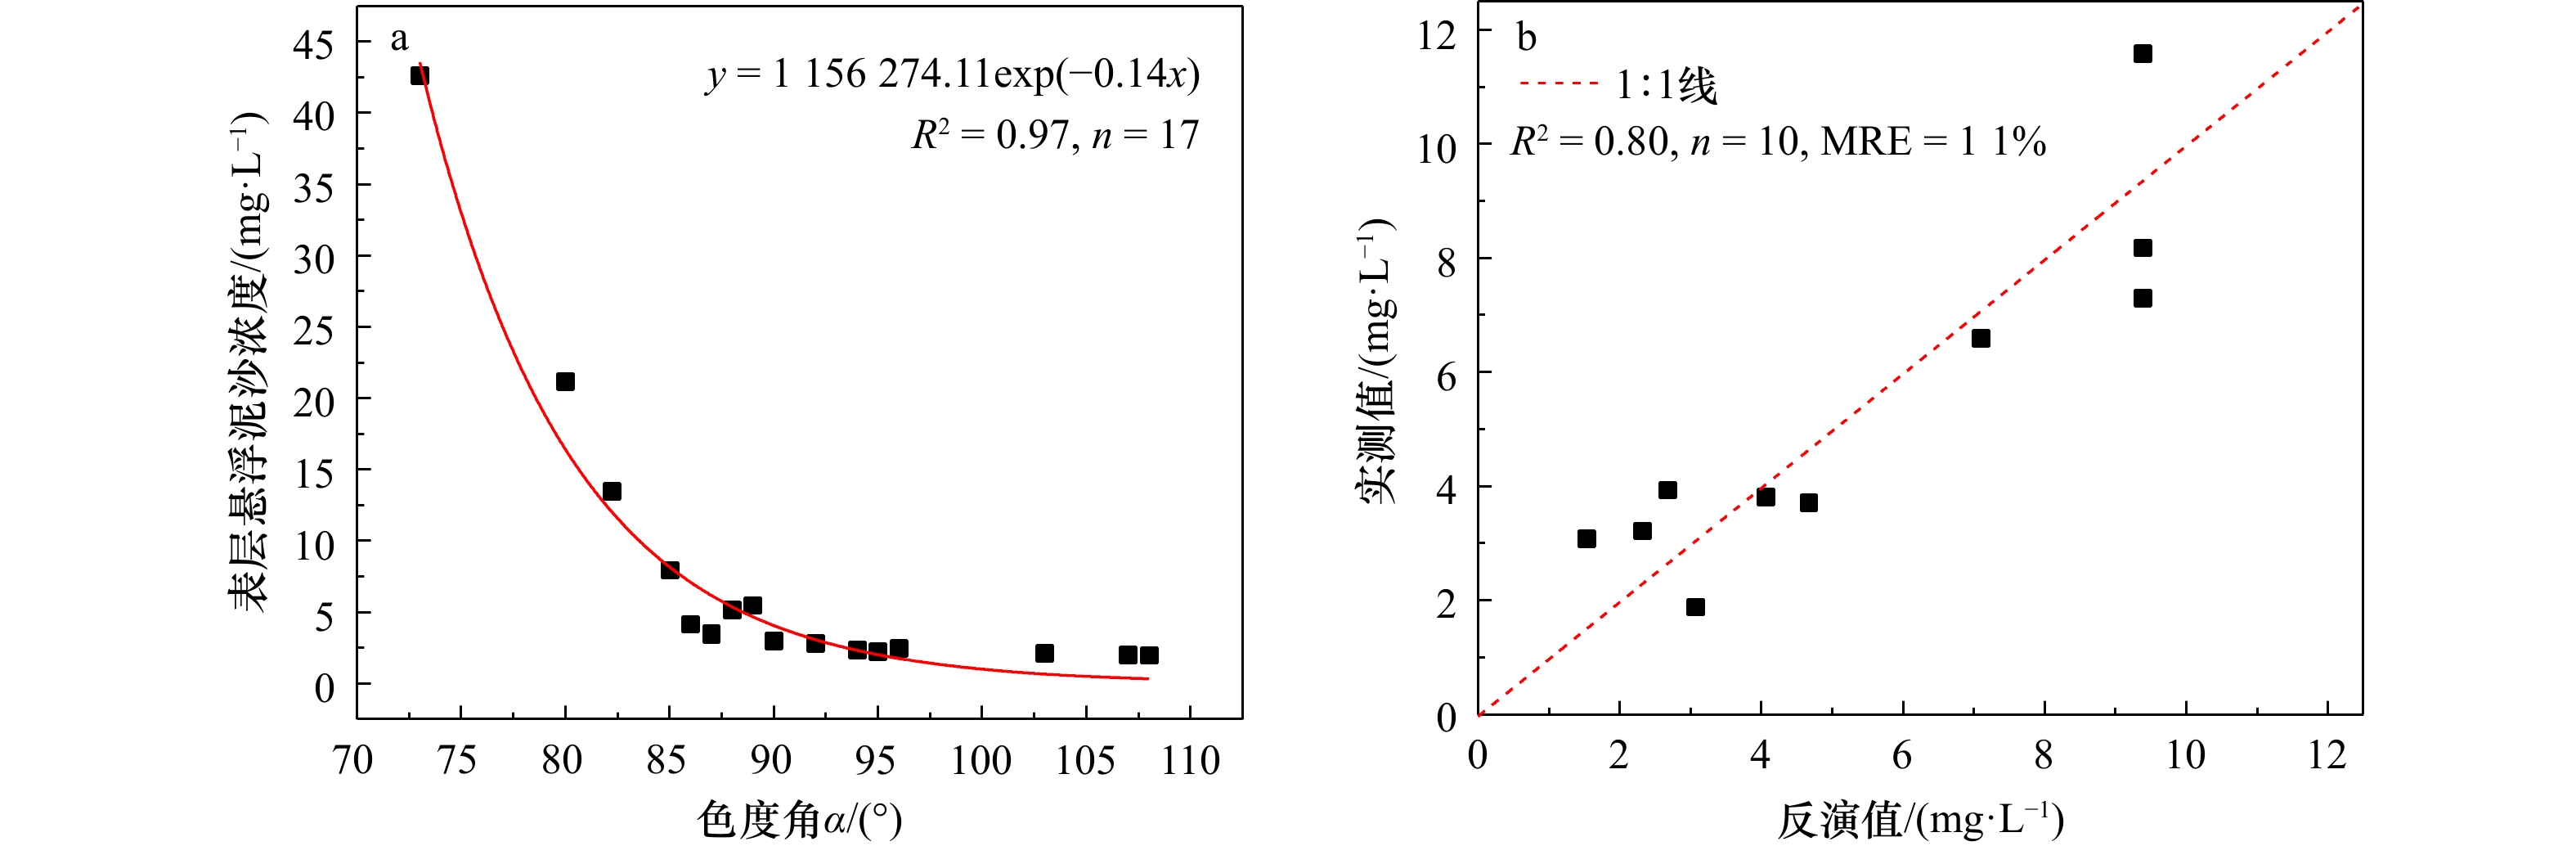
图 2 SSC反演模型的校准(a)与验证(b)
Fig. 2 Calibration (a) and verification (b) of the SSC inversion model

图 3 2000−2021年黄河口及邻近海域SSC逐年均值分布
Fig. 3 Annual mean distribution of SSC in the Huanghe River Estuary and its adjacent sea areas from 2000 to 2021

图 4 2000−2021年黄河口及邻近海域SSC年均值变化
Fig. 4 Annual mean change of SSC in the Huanghe River Estuary and its adjacent sea areas from 2000 to 2021

图 5 2000−2021年黄河口及邻近海域SSC月均值分布
Fig. 5 Monthly mean distribution of SSC in the Huanghe River Estuary and its adjacent sea areas from 2000 to 2021

图 6 2000–2021年黄河口及邻近海域SSC季均值变化
Fig. 6 Seasonal mean change of SSC in the Huanghe River Estuary and its adjacent sea areas from 2000 to 2021

图 7 黄河口及邻近海域SSC季均值(a、b、c、d)和年均值(e)分布
Fig. 7 Seasonal mean (a, b, c, d) and annual mean (e) distribution of SSC in the Huanghe River Estuary and its adjacent sea areas

图 8 2000−2021年利津站年均含沙量与SSC的关系
Fig. 8 Relationship between incoming sediment coefficient and SSC in Lijin Station from 2000 to 2021

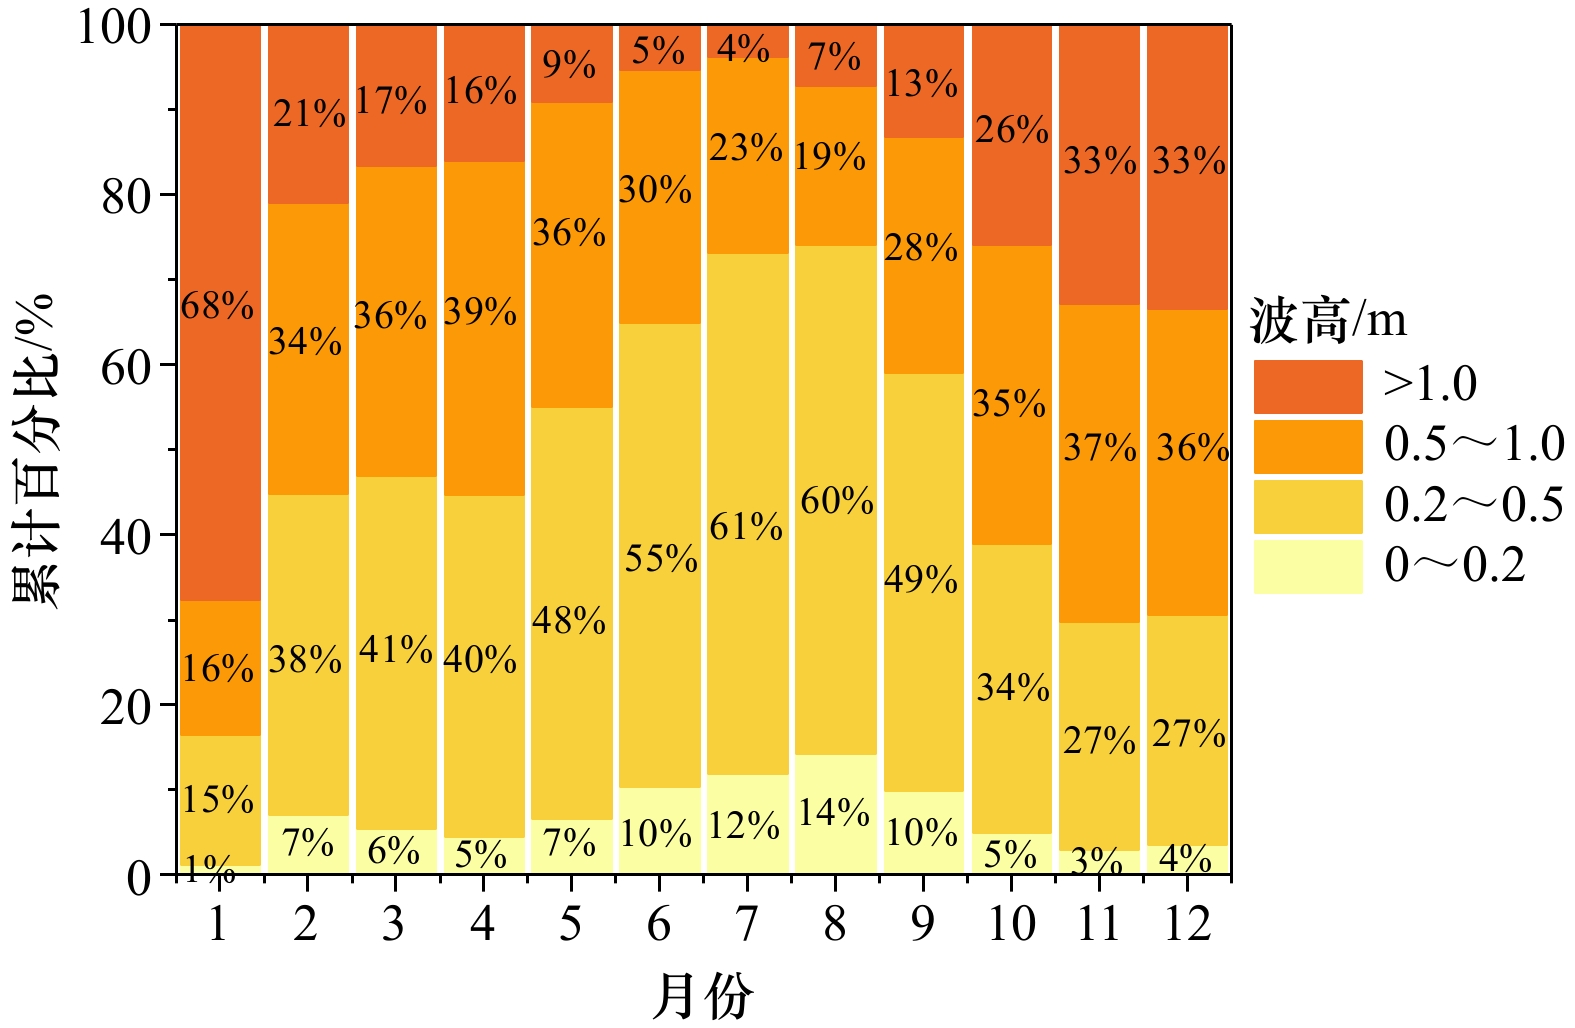
图 10 研究区各时段有效波高与SSC年代际月均值关系图
Fig. 10 Relationship between effective wave height and SSC interdecadal monthly mean value in the study area
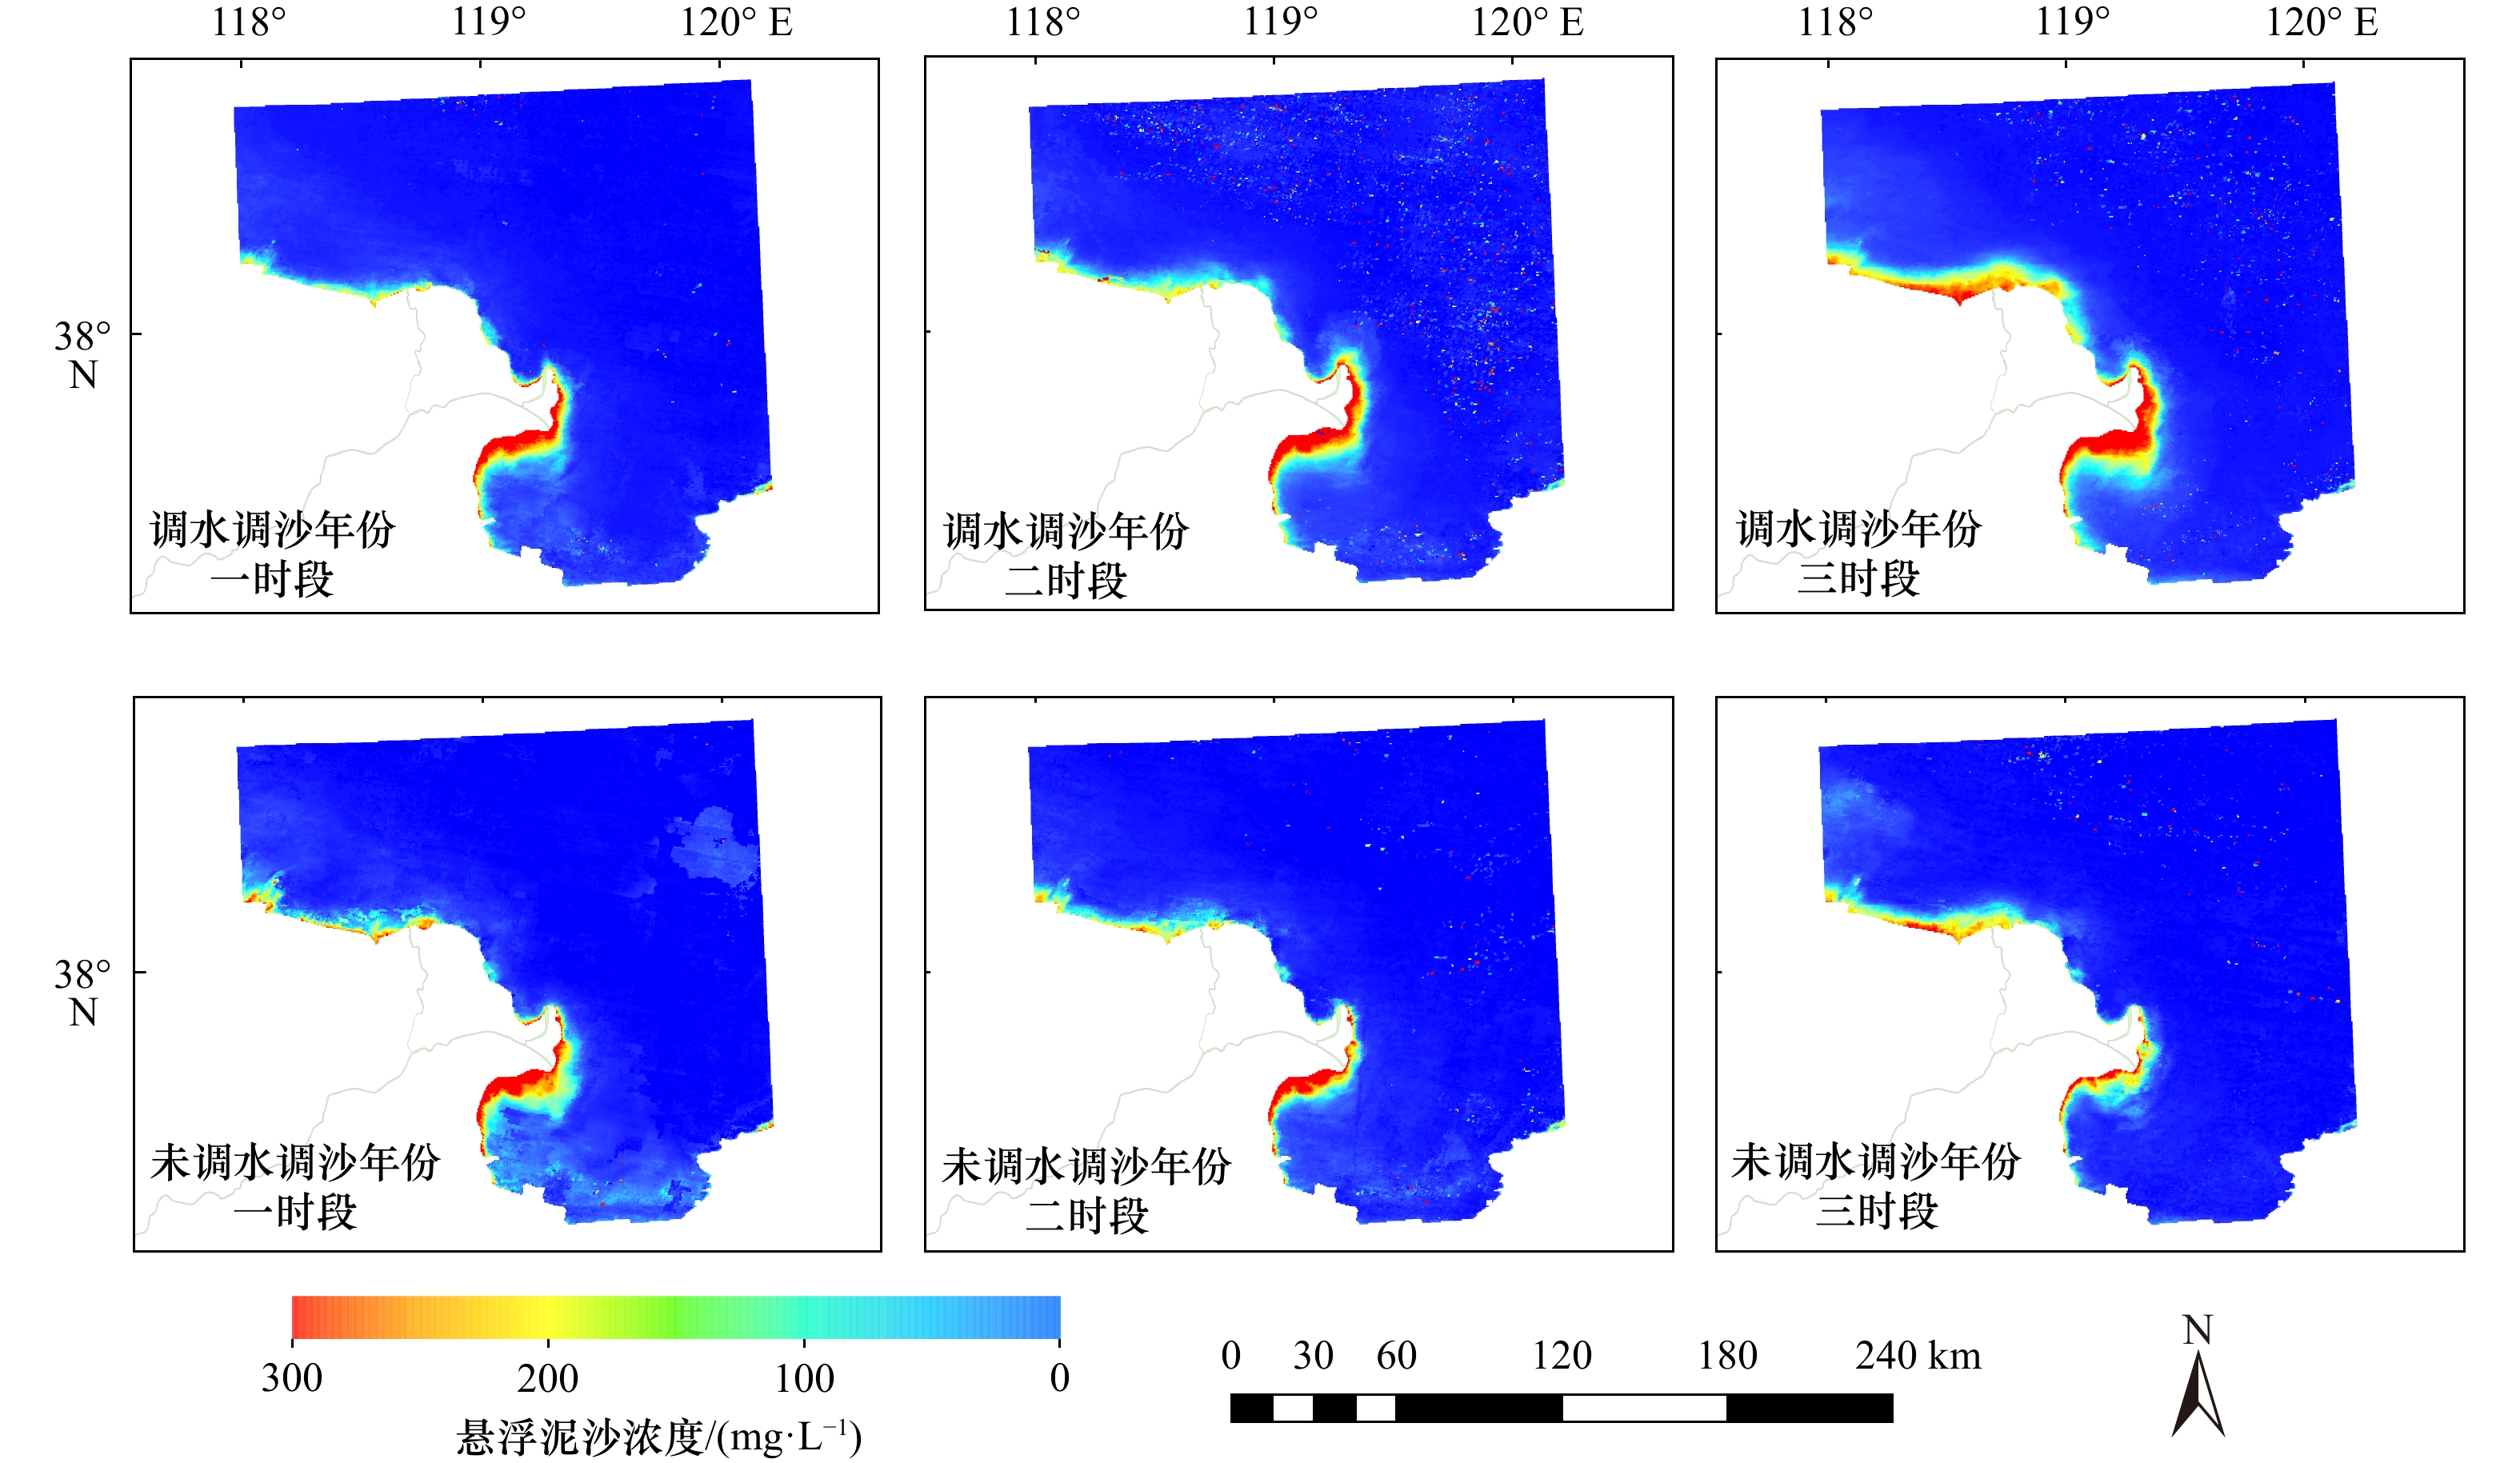
图 11 小浪底水文站调水调沙年份与未调水调沙年份SSC反演结果对比
Fig. 11 Comparison of SSC inversion results between the year of water and sediment regulation and the year of no water and sediment regulation at Xiaolangdi Hydrological Station

图 12 2006–2017年各年6−9月的平均风速及其变化率
Fig. 12 Average wind speed and its change rate from June to September in 2006 to 2017

图 13 调水调沙期间来沙系数与调水调沙前后高浓度区面积变化率关系图
Fig. 13 Relationship between incoming sediment coefficient during water and sediment regulation and area change rate of high concentration area before and after water and sediment regulation
表 1 实测数据信息
Tab. 1 Measured data information
采样时间/影像时间 建模数据站点 验证数据站点 2012年9月10日 S3、S4、S5、S6、S7、S8、
S9、S10、S11、S12、S13S10、S14 2012年9月14日 S24、S25、S26、S27 2012年9月19日 S15、S18、S23 S1、S2、S16、S17 2012年9月20日 S19、S20、S21、S22  下载: 导出CSV
表 2 悬浮泥沙浓度遥感反演模型比较
Tab. 2 Comparison of remote sensing inversion models of suspended sediment concentration
下载: 导出CSV
-
[1] 梁丙臣. 海岸、河口区波–流联合作用下三维悬沙数值模拟及其在黄河三角洲的应用[D]. 青岛: 中国海洋大学, 2005.Liang Bingchen. Numerical simulations of three dimensional suspended sediment transport with wave-current co-existing and its applications in Huanghe Delta[D]. Qingdao: Ocean University of China, 2005. [2] 贾淇文, 章桂芳, 唐世林, 等. 2013−2018年珠江河口伶仃洋水域悬浮泥沙季节性变化分析[J]. 中山大学学报(自然科学版), 2021, 60(5): 59−71. doi: 10.13471/j.cnki.acta.snus.2020d001Jia Qiwen, Zhang Guifang, Tang Shilin, et al. Seasonal variation of suspended sediments in the Lingdingyang waters of the Pearl River Estuary from 2013 to 2018[J]. Acta Scientiarum Naturalium Universitatis Sunyatseni, 2021, 60(5): 59−71. doi: 10.13471/j.cnki.acta.snus.2020d001 [3] 朱超祁, 单红仙, 刘晓磊, 等. 基于原位观测的黄河水下三角洲悬浮物浓度叠加锯齿模型[J]. 海洋地质与第四纪地质, 2018, 38(1): 195−201.Zhu Chaoqi, Shan Hongxian, Liu Xiaolei, et al. The superposed sawtooth model of suspended sediment concentration in the Yellow River subaqueous delta based on in-situ observation[J]. Marine Geology & Quaternary Geology, 2018, 38(1): 195−201. [4] 伊兆晗, 胡日军, 李毅, 等. 福宁湾海域夏季大潮期悬浮泥沙输运特征及控制因素[J]. 海洋地质与第四纪地质, 2021, 41(6): 53−66.Yi Zhaohan, Hu Rijun, Li Yi, et al. Characteristics and controlling factors of suspended sediment transportation in summer spring tide in Funing Bay[J]. Marine Geology & Quaternary Geology, 2021, 41(6): 53−66. [5] 宋子豪. 基于遥感反射率分类的鄱阳湖悬浮泥沙浓度反演研究[J]. 河南科技, 2021, 40(10): 121−124.Song Zihao. Research on retrieval of suspended sediment concentration in Poyang Lake based on remote sensing reflectance classification[J]. Journal of Henan Science and Technology, 2021, 40(10): 121−124. [6] 邵宇杰, 胡越凯, 周斌, 等. 基于GF-4卫星的杭州湾悬浮泥沙浓度遥感监测研究[J]. 海洋学报, 2020, 42(9): 134−142.Shao Yujie, Hu Yuekai, Zhou Bin, et al. Remote sensing monitoring of suspended sediment concentration based on GF-4 satellite in the Hangzhou Bay[J]. Haiyang Xuebao, 2020, 42(9): 134−142. [7] 侯雪姣. 基于遥感的长江中下游大型湖库悬浮泥沙浓度时空动态及其与湿地植被覆盖的关系研究[D]. 武汉: 武汉大学, 2020.Hou Xuejiao. Remote sensing-based spatial-temporal dynamics of sediment concentrations and its relationship with wetland vegetation coverage in large lakes and reservoirs of the middle and lower reaches of the Yangtze River[D]. Wuhan: Wuhan University, 2020. [8] Yunus A P, Masago Y, Hijioka Y. Analysis of long-term (2002–2020) trends and peak events in total suspended solids concentrations in the Chesapeake Bay using MODIS imagery[J]. Journal of Environmental Management, 2021, 299: 113550. doi: 10.1016/j.jenvman.2021.113550 [9] Zhao Gaibo, Jiang Wensheng, Wang Tao, et al. Decadal variation and regulation mechanisms of the suspended sediment concentration in the Bohai Sea, China[J]. Journal of Geophysical Research: Oceans, 2022, 127(3): e2021JC017699. doi: 10.1029/2021JC017699 [10] Li Peng, Chen Shenliang, Ke Yinghai, et al. Spatiotemporal dynamics of suspended particulate matter in the Bohai Sea, China over the past decade from the space perspective[J]. Science of the Total Environment, 2022, 851: 158210. doi: 10.1016/j.scitotenv.2022.158210 [11] 周媛, 郝艳玲, 刘东伟, 等. 基于Landsat 8影像的黄河口悬浮物质量浓度遥感反演[J]. 海洋学研究, 2018, 36(1): 35−45. doi: 10.3969/j.issn.1001-909X.2018.01.004Zhou Yuan, Hao Yanling, Liu Dongwei, et al. Estimation of suspended particulate matter concentration based on Landsat 8 data in the Yellow River Estuary[J]. Journal of Marine Sciences, 2018, 36(1): 35−45. doi: 10.3969/j.issn.1001-909X.2018.01.004 [12] 吴文娟, 付慧薇. 基于高分一号遥感卫星的黄河口海域悬沙时空分布研究[C]//2021(第九届)中国水利信息化技术论坛论文集. 北京: 北京沃特咨询有限公司, 2021: 582−590.Wu Wenjuan, Fu Huiwei. Spatial-temporal distribution of suspended sediment in the Yellow River estuary based on GF-1 remote sensing satellite[C]//2021 (9th) Proceedings of China Water Conservancy Informatization Technology BBS. Beijing: Beijing Wote Consulting Co, Ltd, 2021: 582−590. [13] 樊彦国, 孟志河, 张磊, 等. 基于遥感光谱反射率反演黄河口海域Ⅱ类水体悬浮泥沙浓度模型[J]. 海洋科学, 2010, 34(9): 60−63.Fan Yanguo, Meng Zhihe, Zhang Lei, et al. Based on remote sensing spectral reflectance inversion of suspended sediment concentration model of surface water at the Yellow River Estuary[J]. Marine Sciences, 2010, 34(9): 60−63. [14] 姜丽君, 王庆, 徐洋, 等. 基于遥感反演的莱州湾水色变化的多时相分析[J]. 海洋与湖沼, 2018, 49(3): 551−559.Jiang Lijun, Wang Qing, Xu Yang, et al. Multi-temporal analysis of water color variation in Laizhou Bay based on remote sensing images[J]. Oceanologia et Limnologia Sinica, 2018, 49(3): 551−559. [15] 潘彬. 黄河水沙变化及其对气候变化和人类活动的响应[D]. 济南: 山东师范大学, 2021.Pan Bin. Variations of runoff and sediment and their responses to climate change and human activities in the Yellow River[D]. Ji’nan: Shandong Normal University, 2021. [16] 刘晓, 黄海军, 刘艳霞, 等. 黄河三角洲附近海域悬浮泥沙浓度估算[J]. 人民黄河, 2013, 35(2): 10−12.Liu Xiao, Huang Haijun, Liu Yanxia, et al. Estimation of suspended sediment concentration in the sea water near the Yellow River Delta[J]. Yellow River, 2013, 35(2): 10−12. [17] 殷子瑶, 江涛, 杨广普, 等. 1986–2017年胶州湾水体透明度时空变化及影响因素研究[J]. 海洋科学, 2020, 44(4): 21−32. doi: 10.11759/hykx20190909001Yin Ziyao, Jiang Tao, Yang Guangpu, et al. The spatial-temporal variation of water clarity and its influencing factors in Jiaozhou Bay from 1986 to 2017[J]. Marine Sciences, 2020, 44(4): 21−32. doi: 10.11759/hykx20190909001 [18] 王芳, 青松, 刘楠, 等. 基于色度角的岱海水体营养状态遥感评估[J]. 湖泊科学, 2022, 34(4): 1150−1163. doi: 10.18307/2022.0409Wang Fang, Qing Song, Liu Nan, et al. Remote sensing assessment of trophic status based on chromaticity angle in Lake Daihai[J]. Journal of Lake Sciences, 2022, 34(4): 1150−1163. doi: 10.18307/2022.0409 [19] 王一飞, 宫兆宁, 张园, 等. 基于多源传感器的FUI水色指数提取与应用[J]. 自然资源遥感, 2021, 33(3): 262−271.Wang Yifei, Gong Zhaoning, Zhang Yuan, et al. Extraction and application of Forel-Ule index based on images from multiple sensors[J]. Remote Sensing for Natural Resources, 2021, 33(3): 262−271. [20] 蒋超. 黄河口动力地貌过程及其对河流输入变化的响应[D]. 上海: 华东师范大学, 2020.Jiang Chao. Morphodynamic processed in the Yellow River estuary and their responses to variation of riverine supply[D]. Shanghai: East China Normal University, 2020. [21] Wang Shenglei, Li Junsheng, Zhang Bing, et al. A simple correction method for the MODIS surface reflectance product over typical inland waters in China[J]. International Journal of Remote Sensing, 2016, 37(24): 6076−6096. [22] Yin Ziyao, Li Junsheng, Huang Jue, et al. Steady increase in water clarity in Jiaozhou Bay in the Yellow Sea from 2000 to 2018: observations from MODIS[J]. Journal of Oceanology and Limnology, 2021, 39(3): 800−813. doi: 10.1007/s00343-020-0124-4 [23] Tamiminia H, Salehi B, Mahdianpari M, et al. Google Earth Engine for geo-big data applications: a meta-analysis and systematic review[J]. ISPRS Journal of Photogrammetry and Remote Sensing, 2020, 164: 152−170. doi: 10.1016/j.isprsjprs.2020.04.001 [24] CIE. Commission Internationale de l’Éclairage Proceedings, 1931[M]. Cambridge: Cambridge University Press, 1932. [25] Wang Shenglei, Li Junsheng, Shen Qian, et al. MODIS-based radiometric color extraction and classification of inland water with the Forel-Ule scale: a case study of Lake Taihu[J]. IEEE Journal of Selected Topics in Applied Earth Observations and Remote Sensing, 2015, 8(2): 907−918. doi: 10.1109/JSTARS.2014.2360564 [26] Van der Woerd H J, Wernand M R. True colour classification of natural waters with medium-spectral resolution satellites: SeaWiFS, MODIS, MERIS and OLCI[J]. Sensors, 2015, 15(10): 25663−25680. doi: 10.3390/s151025663 [27] Shi Kun, Zhang Yunlin, Zhu Guangwei, et al. Deteriorating water clarity in shallow waters: evidence from long term MODIS and in-situ observations[J]. International Journal of Applied Earth Observation and Geoinformation, 2018, 68: 287−297. doi: 10.1016/j.jag.2017.12.015 [28] 乔晓景, 何报寅, 张文, 等. 基于MODIS的长江中游河段悬浮泥沙浓度反演[J]. 长江流域资源与环境, 2013, 22(8): 1090−1095.Qiao Xiaojing, He Baoyin, Zhang Wen, et al. Modis-based retrieval and change analysis of suspended sediment concentration in middle Yangtze River[J]. Resources and Environment in the Yangtze Basin, 2013, 22(8): 1090−1095. [29] Cui Lijuan, Qiu Yue, Fei Teng, et al. Using remotely sensed suspended sediment concentration variation to improve management of Poyang Lake, China[J]. Lake and Reservoir Management, 2013, 29(1): 47−60. doi: 10.1080/10402381.2013.768733 [30] 王林, 杨建洪, 李冠男, 等. 江苏近岸海域HJ CCD影像悬浮泥沙遥感反演[J]. 海洋科学, 2016, 40(2): 77−83. doi: 10.11759/hykx20141028001Wang Lin, Yang Jianhong, Li Guannan, et al. Retrieval of suspended sediment concentration from HJ-CCD imagery in Jiangsu coastal sea[J]. Marine Sciences, 2016, 40(2): 77−83. doi: 10.11759/hykx20141028001 [31] Zhan Weikang, Wu Jie, Wei Xing, et al. Spatio-temporal variation of the suspended sediment concentration in the Pearl River Estuary observed by MODIS during 2003–2015[J]. Continental Shelf Research, 2019, 172: 22−32. doi: 10.1016/j.csr.2018.11.007 [32] Binding C E, Greenberg T A, Watson S B, et al. Long term water clarity changes in North America’s Great Lakes from multi-sensor satellite observations[J]. Limnology and Oceanography, 2015, 60(6): 1976−1995. doi: 10.1002/lno.10146 [33] Kratzer S, Håkansson B, Sahlin C. Assessing Secchi and photic zone depth in the Baltic Sea from satellite data[J]. Ambio, 2003, 32(8): 577−585. doi: 10.1579/0044-7447-32.8.577 [34] Olmanson L G, Bauer M E, Brezonik P L. A 20-year Landsat water clarity census of Minnesota’s 10, 000 lakes[J]. Remote Sensing of Environment, 2008, 112(11): 4086−4097. doi: 10.1016/j.rse.2007.12.013 [35] Duan Hongtao, Ma Ronghua, Zhang Yuanzhi, et al. Remote-sensing assessment of regional inland lake water clarity in Northeast China[J]. Limnology, 2009, 10(2): 135−141. doi: 10.1007/s10201-009-0263-y [36] Ren Jingli, Zheng Zhubin, Li Yunmei, et al. Remote observation of water clarity patterns in Three Gorges Reservoir and Dongting Lake of China and their probable linkage to the Three Gorges Dam based on Landsat 8 imagery[J]. Science of the Total Environment, 2018, 625: 1554−1566. doi: 10.1016/j.scitotenv.2018.01.036 [37] 姚前前. 小浪底调水调沙对黄河口来水来沙条件和海岸线演变规律的影响研究[D]. 泰安: 山东农业大学, 2014.Yao Qianqian. Influence of flow/sediment regulation in Xiaolangdi on incoming flow/sediment condition and coastline evolution of the Yellow River Estuary[D]. Taian: Shandong Agricultural University, 2014. [38] 林聪泳, 陈沈良, 李鹏, 等. 黄河三角洲北部近岸悬浮物季节性分布及驱动因素[J]. 海洋学报, 2021, 43(12): 152−160.Lin Congyong, Chen Shenliang, Li Peng, et al. Seasonal distribution and driving forces of suspended particulate matter in the northern Yellow River Delta[J]. Haiyang Xuebao, 2021, 43(12): 152−160. [39] 李平, 丰爱平, 陈义中, 等. 2005年黄河调水调沙期间入海泥沙扩散研究[J]. 海洋湖沼通报, 2010(4): 72−78.Li Ping, Feng Aiping, Chen Yizhong, et al. The diffusion studies of sediment into sea during the period of Yellow River water and sediment regulation, 2005[J]. Transactions of Oceanology and Limnology, 2010(4): 72−78. [40] 陈琼, 唐世林, 吴颉. 基于GF-4卫星反演的珠江口水体表层悬浮泥沙时空变化特征[J]. 热带海洋学报, 2022, 41(2): 65−76. doi: 10.11978/2021034Chen Qiong, Tang Shilin, Wujie. Spatial-temporal variation of suspended sediment in the Pearl River Estuary retrieved from GF-4 satellite data[J]. Journal of Tropical Oceanography, 2022, 41(2): 65−76. doi: 10.11978/2021034 [41] 孟令鹏, 胡日军, 李毅, 等. 福宁湾海域冬季大潮期悬浮泥沙输运特征[J]. 海洋地质与第四纪地质, 2020, 40(3): 61−73.Meng Lingpeng, Hu Rijun, Li Yi, et al. Transport characteristics of suspended sediment in Funing Bay during spring tide in winter[J]. Marine Geology & Quaternary Geology, 2020, 40(3): 61−73. [42] 陆建忠. 遥感反演与数值模拟耦合的渤海悬浮泥沙输移研究[D]. 武汉: 武汉大学, 2010.Lu Jianzhong. Study on suspended sediment transport coupling remote sensing retrieval and numerical simulation in the Bohai Sea, China[J]. Wuhan: Wuhan University, 2010. -

计量
- 文章访问数: 670
- HTML全文浏览量: 285
- PDF下载量: 120
- 被引次数: 0
