

Analysis of spatiotemporal changes in Arctic sea ice motion characteristics in 2018−2019 using ice-based buoy data
-
摘要: 海冰运动是影响北极海冰平流输运和物质平衡空间重新分布的重要因素。本研究基于2018年9月至2019年8月期间北冰洋66个冰基浮标位置记录数据,结合大气再分析数据,计算得到了海冰运动速度、冰速与风速的比值和海冰运动惯性强度,以刻画北极海冰运动学特征参数在一个冰季的时空变化,并讨论了不同区域冰速与风速比与海冰密集度的关联性。海冰漂移速度在波弗特–楚科奇海、东北极中央区和西北极中央区呈秋冬降低春夏升高的季节变化特征。格陵兰海月均海冰漂移速度((0.32 ± 0.06)m/s)最大,其次是弗拉姆海峡((0.17 ± 0.07)m/s)和波弗特–楚科奇海((0.14 ±0.05)m/s),而东北极中央区((0.09 ± 0.02)m/s)和西北极中央区((0.07 ± 0.03)m/s)较低。在月尺度上,冰漂移速度与风速的比值主要受海冰漂移速度支配。弗拉姆海峡和格陵兰海受较强的表层海流影响,冰速与风速比值较大,西北极中央区、东北极中央区和波弗特–楚科奇海的冰速与风速比值随着海冰密集度的增加趋近,并分布在0~0.02之间。所有浮标的月平均惯性运动指数为0.158 ±0.144,秋冬季过渡期间,海冰对风的响应以及海冰运动的惯性信号逐渐减弱,春–夏季随着海冰融化又开始增强,因此上述两个参数都可以作为指示海冰冰场固结程度的重要指标。Abstract: Sea ice motion is an important factor affecting Arctic sea ice advection and spatial redistribution of mass balance. Based on the data collected by 66 ice-based drifting buoys deployed in the Arctic Ocean from September 2018 to August 2019, combined with atmospheric reanalysis data and passive microwave sea ice concentration product, we calculated the sea ice drifting speed, the ice-wind speed ratio and the inertial intensity of sea ice motion, so as to characterize the temporal and spatial changes of Arctic sea ice kinematic parameters over a full ice season, and analyse the correlation between ice-wind speed ratio and sea ice concentration. Seasonally, the sea ice drift speed in the Beaufort-Chukchi Sea, the central eastern Arctic Ocean and the central western Arctic Ocean showed a decreasing trend in autumn and winter and an increasing trend in spring and summer. Spatially, the Greenland Sea ((0.32 ± 0.06) m/s) had the highest sea ice drift speed, followed by the Fram Strait ((0.17 ± 0.07) m/s), and those in the Beaufort-Chukchi Sea ((0.14 ± 0.05) m/s), the central eastern Arctic Ocean ((0.09 ± 0.02) m/s) and the central western Arctic Ocean ((0.07 ± 0.03) m/s) were relatively low. On the monthly scale, the ice-wind speed ratio was mainly dominated by sea ice drift speed. The ice-wind speed ratio in the Fram Strait and the Greenland Sea was relatively larger, due to the strong ocean surface current. While the ice-wind speed ratio in the central western Arctic Ocean, the central eastern Arctic Ocean, and the Beaufort-Chukchi Sea was relative low and tended to be distributed between 0−0.02 with the increase in sea ice concentration. The monthly averaged IMI for all buoys was 0.158 ± 0.144, and the response of ice to wind and the inertial signal of ice motion gradually weakened during the autumn-winter transition and started to strengthen again in spring and summer. Therefore, both of the above parameters can be used as important indicators to indicate the consolidation of ice field.
-
Key words:
- Arctic Ocean /
- sea ice motion /
- sea ice concentration /
- wind /
- spatiotemporal variation
-

图 1 本研究中使用的各种类浮标的观测周期
三角形点表示在T-ICE 航次布放的浮标;圆点表示2018年9月中国第9次北极科学考察期间布放的浮标;实线表示浮标数据来自IABP数据库;虚线表示浮标数据来自Meereisportal数据库
Fig. 1 Operational periods of each kind of buoys used in this study
Triangular scatters buoys deployed during the T-ICE cruise; circular scatters denote buoys deployed during the CHINARE-2018; solid lines represent the data collected from the IABP datebase; dashed lines indicate the data collected from the Meereisportal database

图 2 研究区域划分
a. 西北极中央区;b. 波弗特–楚科奇海;c. 东北极中央区;d. 弗拉姆海峡;e. 格陵兰海;黑色圆点、红色圆点、红色三角形、黑色三角形分别表示IABP、Meereisportal、CHINARE和T-ICE浮标最初布放位置
Fig. 2 Division of the study area
a. The central western Arctic Ocean; b. the Beaufort-Chukchi Sea; c. the central eastern Arctic Ocean; d. the Fram Strait; e. the Greenland Sea; the black dots, red dots, red triangles, and black triangles show the initial deployment positions of IABP, Meereispotal, CHINARE, and T-ICE buoys, respectively

图 3 北极地区2018年秋季至2019年夏季的海表面气压距平和风速矢量平均值(黑色箭头)
红色曲线为浮标运动轨迹
Fig. 3 Anomaly of SLP and average wind vectors in the Arctic from autumn 2018 to summer 2019 (black arrow)
Red line denoting the trajectory of buoys

图 4 各区域浮标位置的平均风速(a)及其距平值(b)
Fig. 4 Averaged wind speed (a) and its anomaly (b) at buoy positions in each defined region

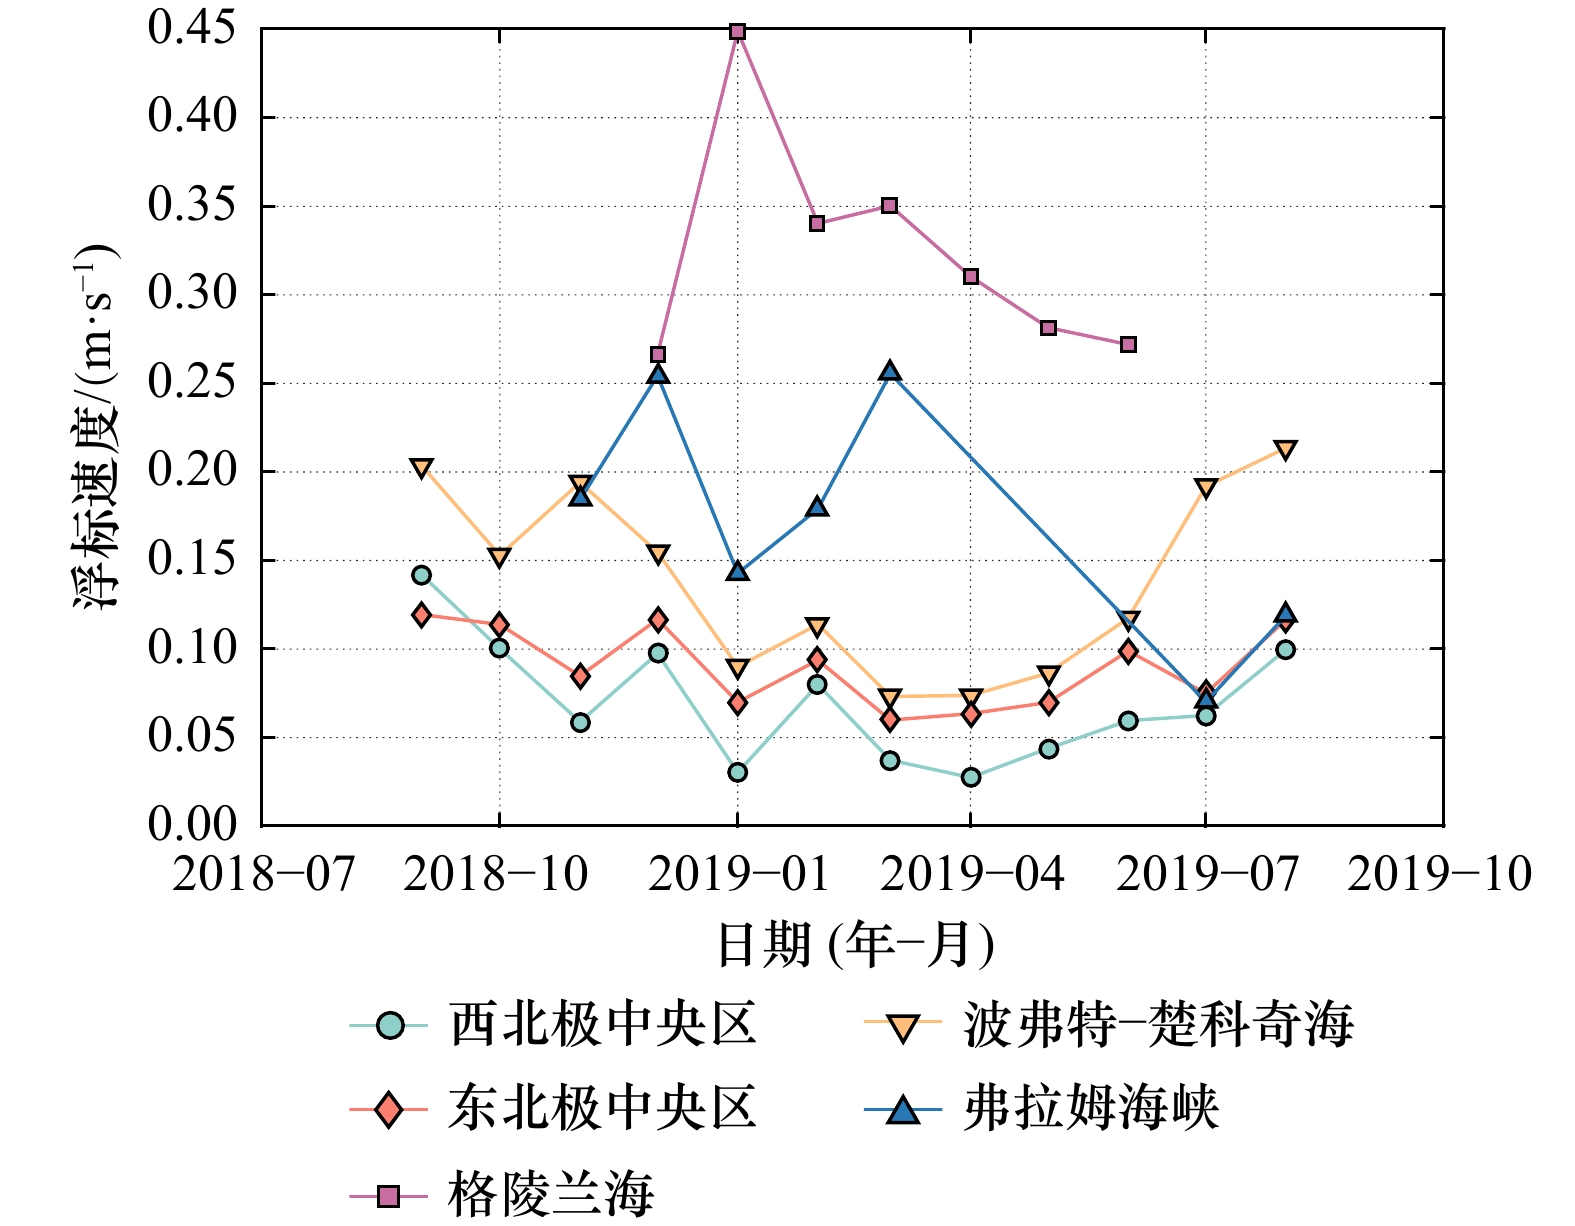
图 5 浮标时均速度的空间分布
星号表示浮标结束观测的位置
Fig. 5 Spatial distribution of hourly buoy drifting speed
Stars denoting the ending position of buoys
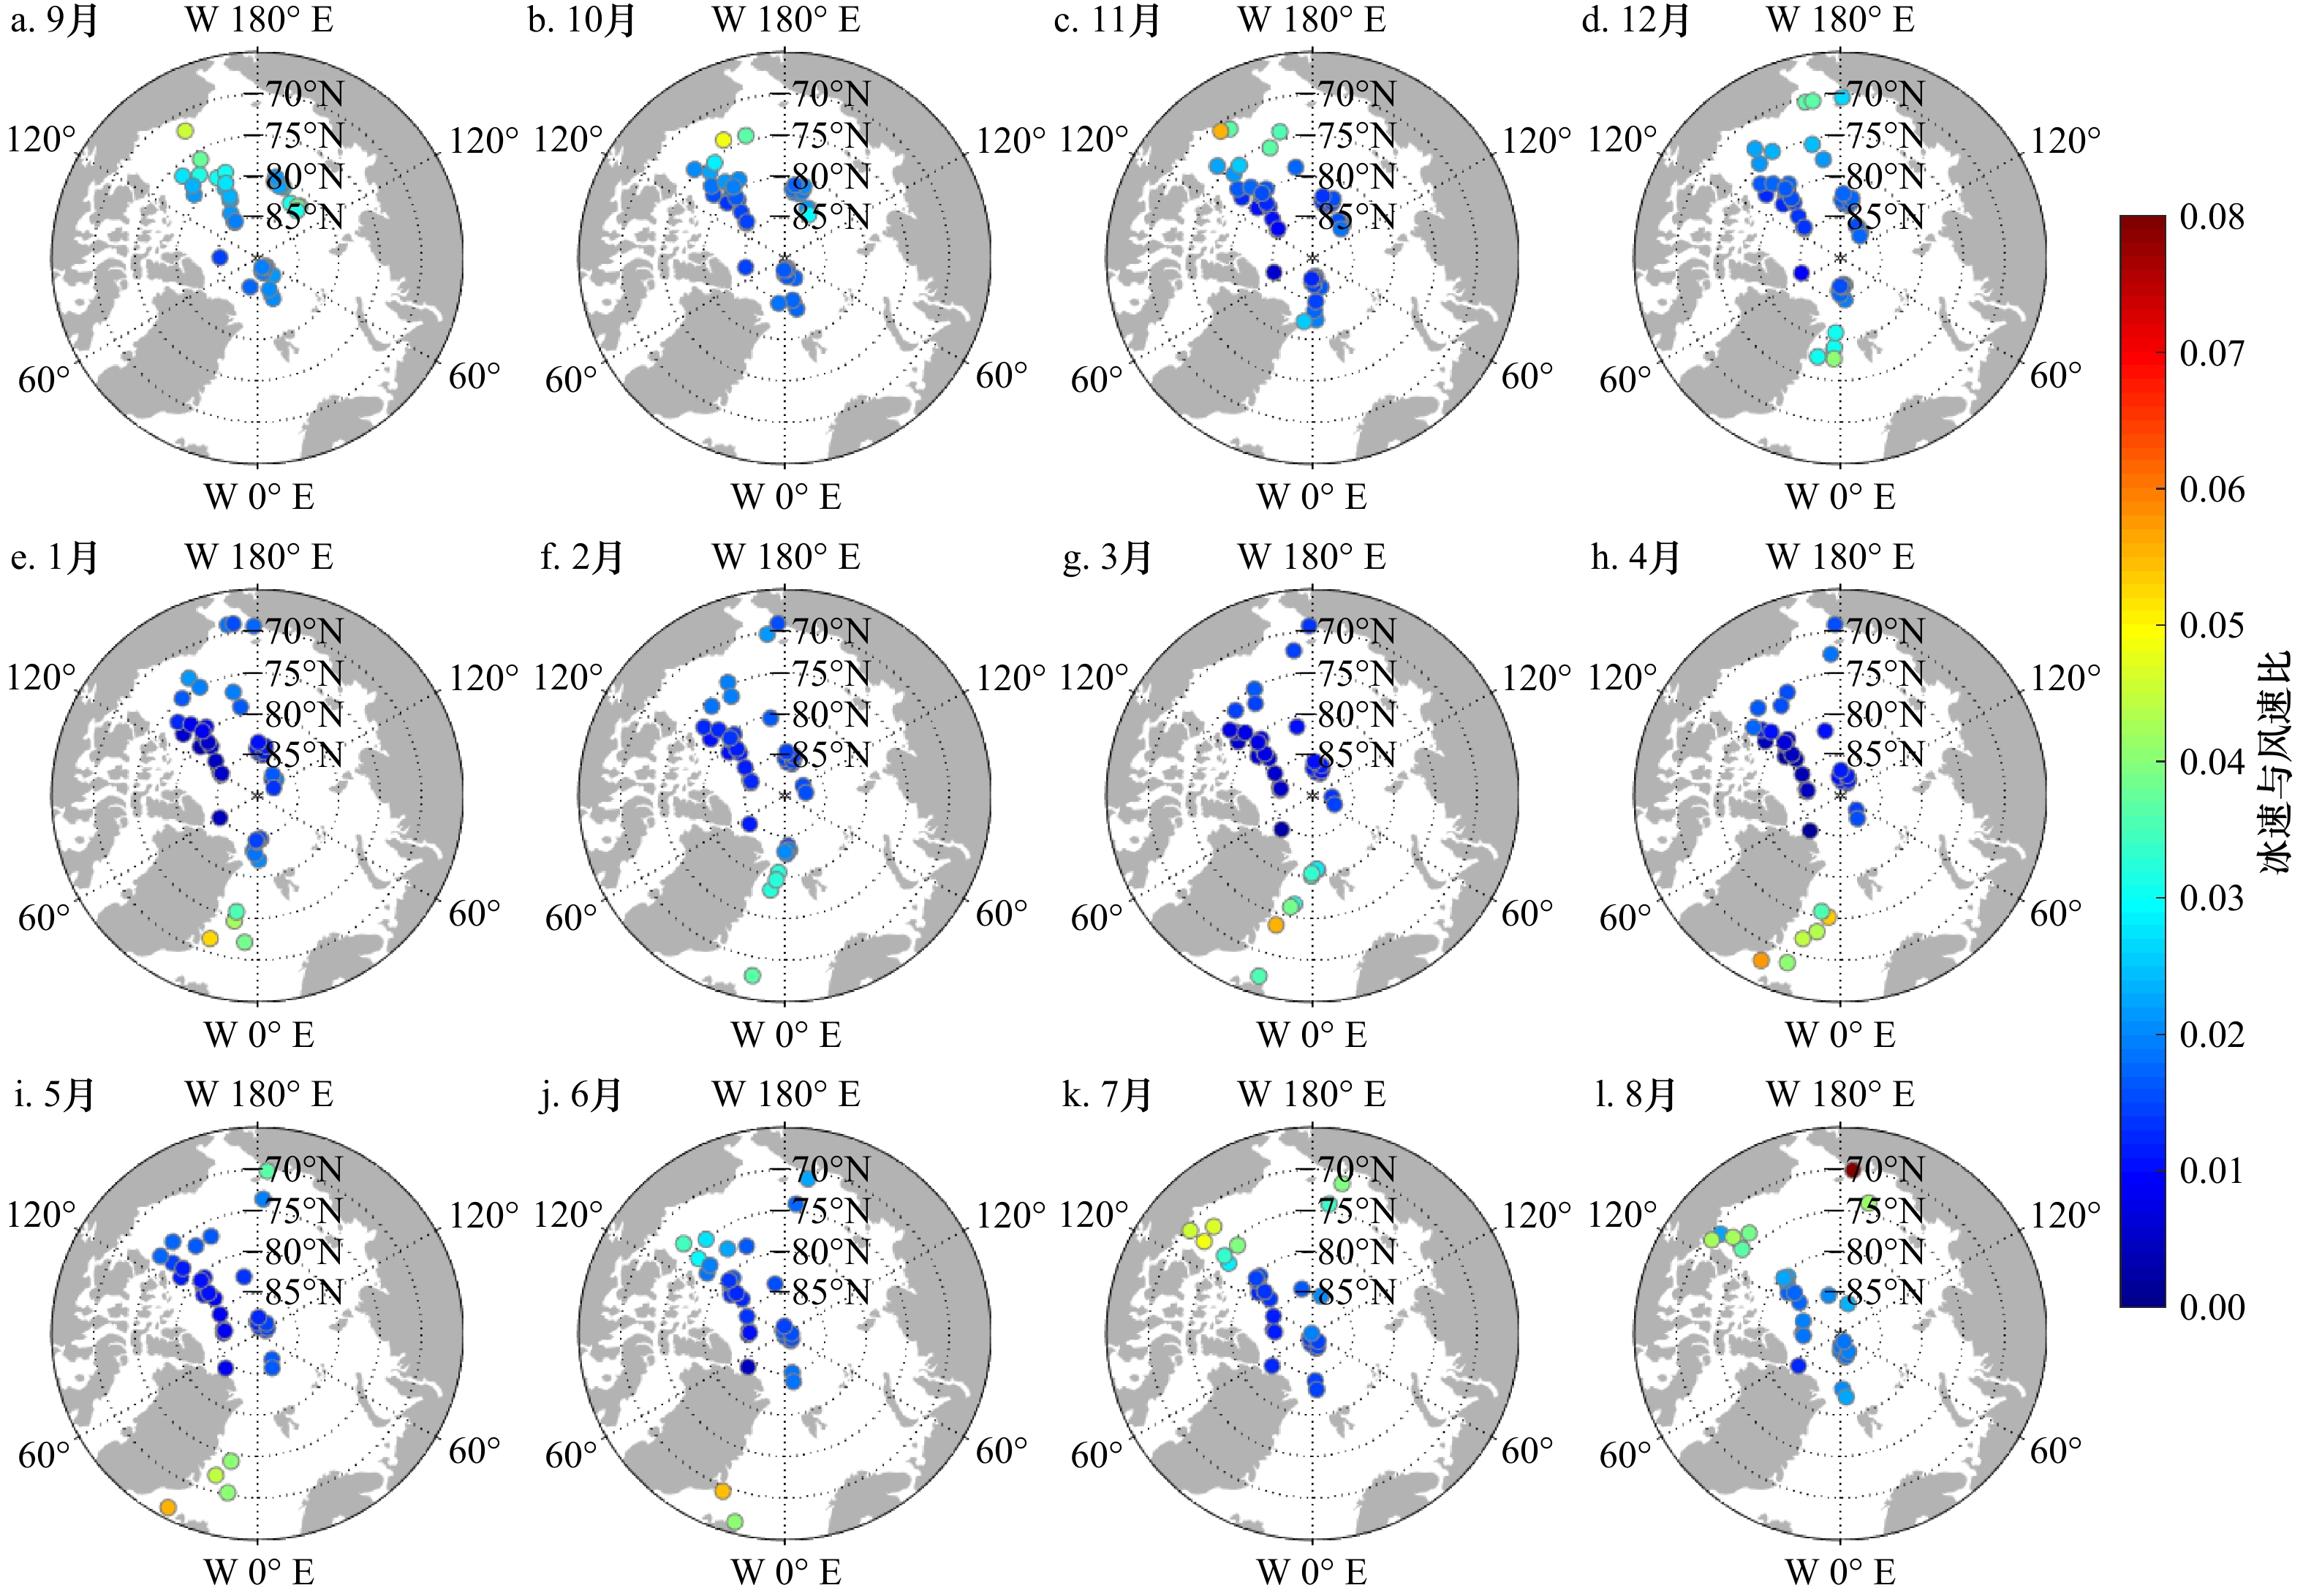
图 7 2018年9月至2019年8月冰速与风速比的空间分布
Fig. 7 Spatial distribution of ice-wind speed ratio from September 2018 to August 2019

图 8 各区域内的月均冰速与风速比
Fig. 8 Monthly ice-wind speed ratio at buoy positions in each defined region
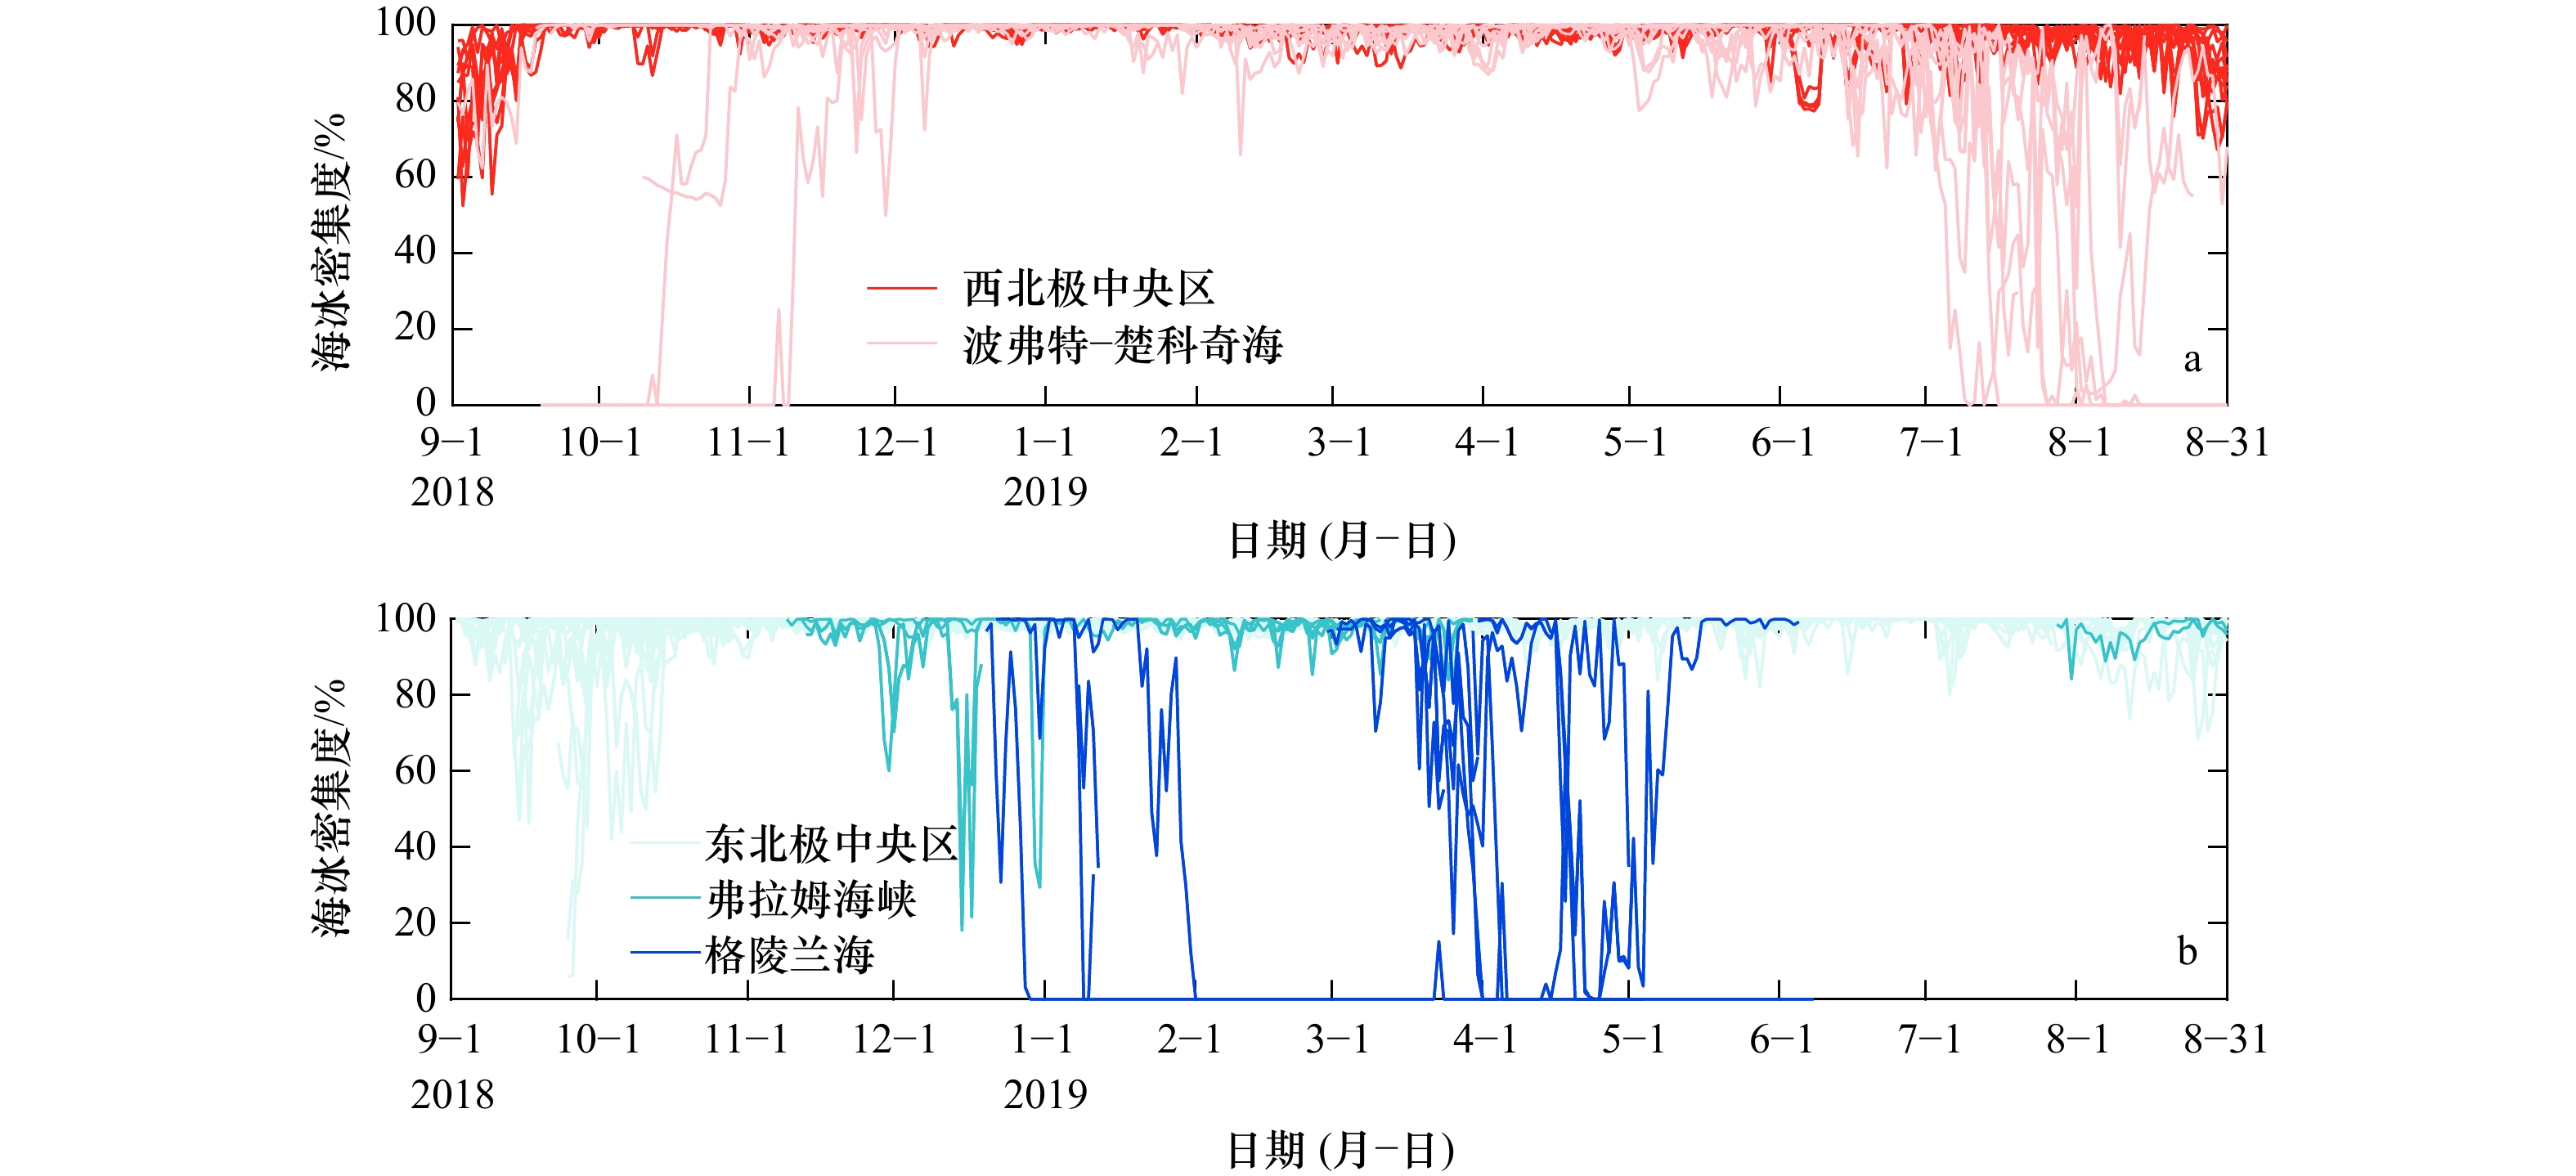
图 9 各区域冰基浮标附近海冰密集度的季节变化
Fig. 9 Seasonal changes of sea ice concentration near the buoys in each region

图 10 2018年9月至2019年8月归一化冰速经傅里叶变换后对应负位相惯性频率下的月均振幅(IMI)
Fig. 10 Monthly amplitudes (IMI) after Fourier transformation of normalized ice speed at the negative-phase inertial frequency from September 2018 to August 2019

图 11 2018年9月至2019年8月归一化冰速经傅里叶变换后对应正位相半日频率下的月均振幅(PHA)
Fig. 11 Monthly amplitudes (PHA) after Fourier transformation of normalized ice speed at the positive-phase semidiurnal frequency from September 2018 to August 2019
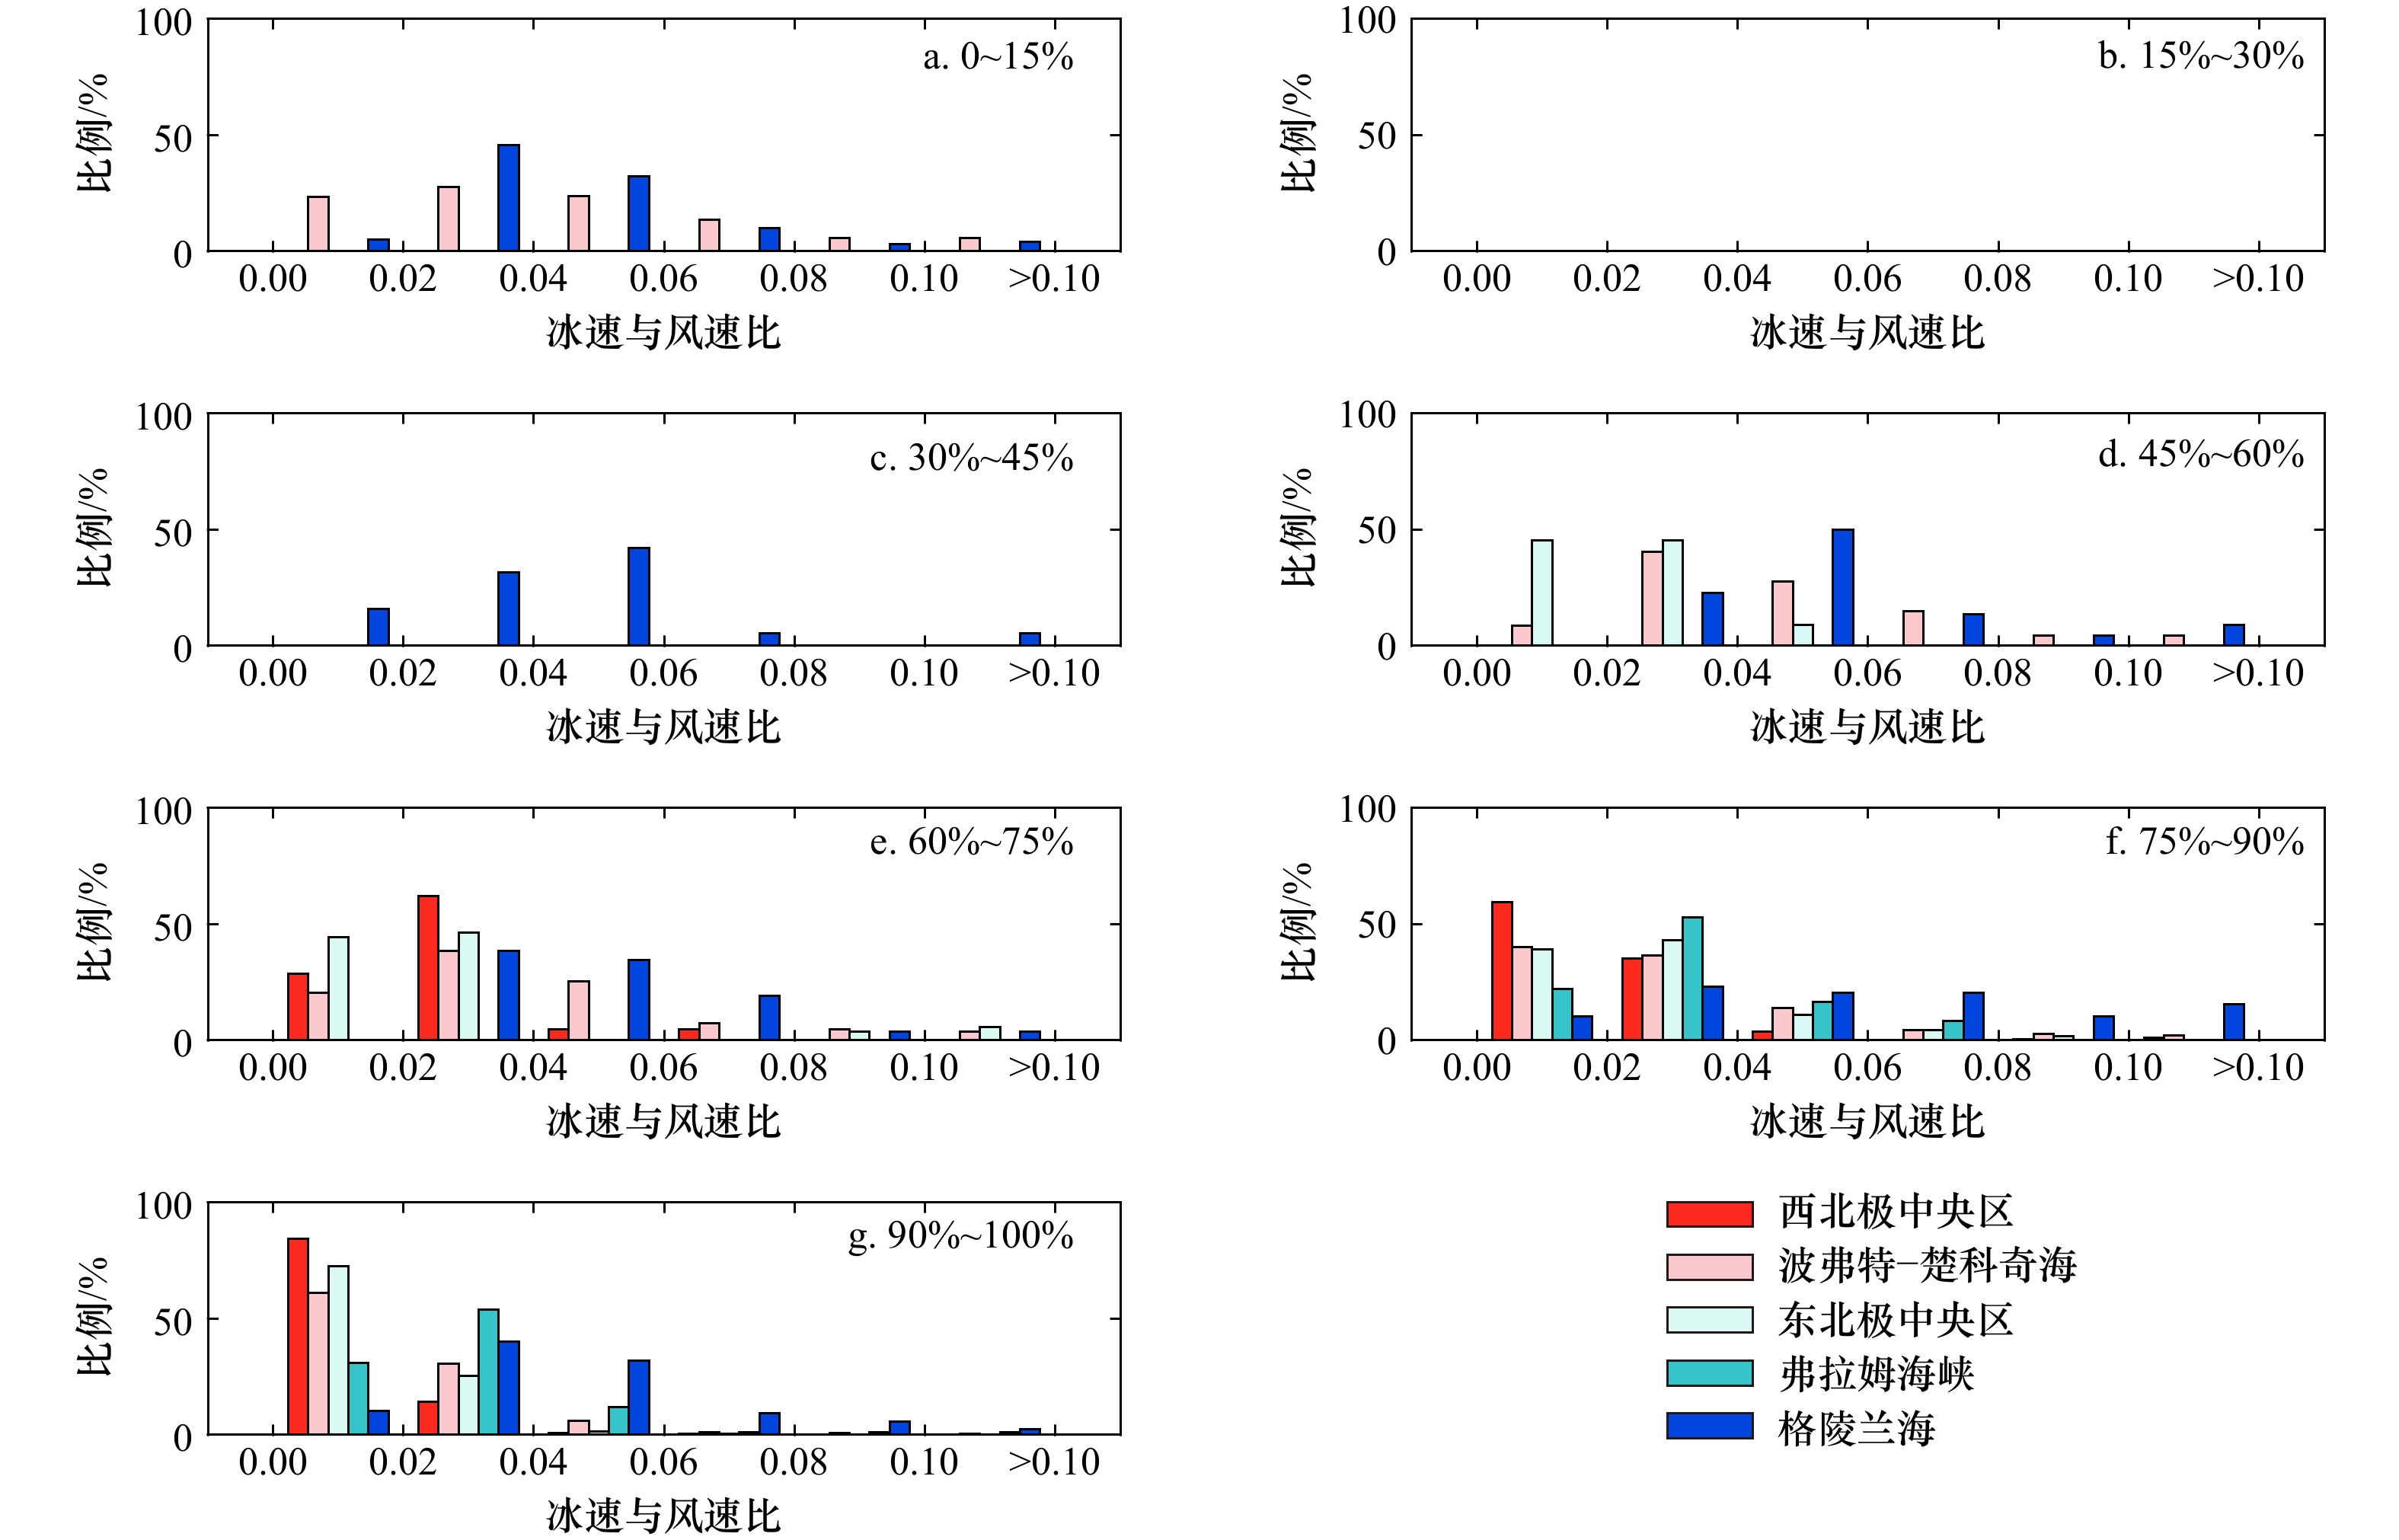
图 12 不同海冰密集度情况下冰速与风速比值的分布
Fig. 12 Distribution of ice speed-wind speed ratio under different sea ice concentration
表 1 2018–2019年北极冰基浮标基本信息
Tab. 1 Arctic ice-based buoy information in 2018–2019
浮标类型 来源 采样时间间隔/h 浮标个数 Snow and Ice Mass Balance Array (SIMBA) CHINARE/AWI 1/2 12 Snow Buoy (SB) AWI-USIABP 1 13 Ice Surface Velocity Program (ISVP) USIABP/AARI 1 8 Ice Tethered Profiler (ITP) WHOI 1 5 Ice Mass Balance Buoy (IMB) BAS 1 9 No Drogue Ice Tracker (ICEBA) USIABP-AOML 1 3 Upper Temperature of the Polar Oceans (UTPO) PSC-UPTEMPO 1/6 1 Barometer GPS Iridium SVP (BD2GI) AOML 1 1 Air-Deployable Expendable Ice Buoy (AXIB) USIABP 1 3 Thermistor Buoy (TB) AWI/FMI 2 7 Ice Beacon (ICEB) AWI-USIABP 1 2 Compact Air Launched Ice Beacon (CALIB) AWI-USIABP 1 2  下载: 导出CSV
表 2 各区域浮标周边海冰密集度不同区间所占的比例
Tab. 2 Proportion of different sea ice concentration intervals in each defined region
比例 0~15% 15%~30% 30%~45% 45%~60% 60%~75% 75%~90% 90%~100% 西北极中央区 0 0 0 0.08% 0.42% 3.88% 95.62% 波弗特−楚科奇海 7.69% 0.57% 0.70% 1.57% 2.76% 6.23% 80.48% 东北极中央区 0.02% 0.02% 0.05% 0.25% 0.61% 1.85% 97.20% 弗拉姆海峡 0 0.45% 0.30% 0.30% 0.60% 5.37% 93.00% 格陵兰海 41.98% 1.49% 3.54% 4.10% 4.85% 7.28% 36.75%
下载: 导出CSV
-
[1] Kwok R, Spreen G, Pang S. Arctic sea ice circulation and drift speed: Decadal trends and ocean currents[J]. Journal of Geophysical Research: Oceans, 2013, 118(5): 2408−2425. doi: 10.1002/jgrc.20191 [2] Cohen J, Screen J A, Furtado J C, et al. Recent Arctic amplification and extreme mid-latitude weather[J]. Nature Geoscience, 2014, 7(9): 627−637. doi: 10.1038/ngeo2234 [3] Bi Haibo, Yang Qinghua, Liang Xi, et al. Contributions of advection and melting processes to the decline in sea ice in the Pacific sector of the Arctic Ocean[J]. The Cryosphere, 2019, 13(5): 1423−1439. doi: 10.5194/tc-13-1423-2019 [4] Rudels B. Arctic Ocean circulation, processes and water masses: a description of observations and ideas with focus on the period prior to the international polar year 2007–2009[J]. Progress in Oceanography, 2015, 132: 22−67. doi: 10.1016/j.pocean.2013.11.006 [5] Li Mengmeng, Ke Changqing, Shen Xiaoyi, et al. Investigation of the Arctic Sea ice volume from 2002 to 2018 using multi-source data[J]. International Journal of Climatology, 2021, 41(4): 2509−2527. doi: 10.1002/joc.6972 [6] Onarheim I H, Eldevik T, Smedsrud L H, et al. Seasonal and regional manifestation of Arctic sea ice loss[J]. Journal of Climate, 2018, 31(12): 4917−4932. doi: 10.1175/JCLI-D-17-0427.1 [7] Kumar A, Yadav J, Mohan R. Spatio-temporal change and variability of Barents-Kara sea ice, in the Arctic: Ocean and atmospheric implications[J]. Science of the Total Environment, 2021, 753: 142046. doi: 10.1016/j.scitotenv.2020.142046 [8] Vihma T, Launiainen J, Uotila J. Weddell Sea ice drift: Kinematics and wind forcing[J]. Journal of Geophysical Research: Oceans, 1996, 101(C8): 18279−18296. doi: 10.1029/96JC01441 [9] Wassermann S, Schmitt C, Kottmeier C, et al. Coincident vortices in Antarctic wind fields and sea ice motion[J]. Geophysical Research Letters, 2006, 33(15): L15810. doi: 10.1029/2006GL026005 [10] Nakayama Y, Ohshima K I, Fukamachi Y. Enhancement of sea ice drift due to the dynamical interaction between sea ice and a coastal ocean[J]. Journal of Physical Oceanography, 2012, 42(1): 179−192. doi: 10.1175/JPO-D-11-018.1 [11] Leppäranta M. The Drift of Sea Ice[M]. 2nd ed. Berlin: Springer, 2011. [12] Lund B, Graber H C, Persson P O G, et al. Arctic sea ice drift measured by shipboard marine radar[J]. Journal of Geophysical Research: Oceans, 2018, 123(6): 4298−4321. doi: 10.1029/2018JC013769 [13] Olason E, Notz D. Drivers of variability in Arctic sea-ice drift speed[J]. Journal of Geophysical Research: Oceans, 2014, 119(9): 5755−5775. doi: 10.1002/2014JC009897 [14] Gimbert F, Marsan D, Weiss J, et al. Sea ice inertial oscillations in the Arctic Basin[J]. The Cryosphere, 2012, 6(5): 1187−1201. doi: 10.5194/tc-6-1187-2012 [15] Lammert A, Brümmer B, Kaleschke L. Observation of cyclone-induced inertial sea-ice oscillation in Fram Strait[J]. Geophysical Research Letters, 2009, 36(10): L10503. doi: 10.1029/2009GL037197 [16] Zhang Jinlun, Lindsay R, Schweiger A, et al. Recent changes in the dynamic properties of declining Arctic sea ice: a model study[J]. Geophysical Research Letters, 2012, 39(20): L20503. [17] Proshutinsky A Y, Johnson M. Two regimes of the Arctic’s circulation from ocean models with ice and contaminants[J]. Marine Pollution Bulletin, 2001, 43(1/6): 61−70. [18] 曹勇, 赵进平. 2011−2014年中国北极物理海洋学的研究进展[J]. 海洋学报, 2015, 37(11): 1−10.Cao Yong, Zhao Jinping. Progress in Arctic physical oceanography in China during 2011−2014[J]. Haiyang Xuebao, 2015, 37(11): 1−10. [19] Lei Ruibo, Gui Dawei, Hutchings J K, et al. Backward and forward drift trajectories of sea ice in the northwestern Arctic Ocean in response to changing atmospheric circulation[J]. International Journal of Climatology, 2019, 39(11): 4372−4391. doi: 10.1002/joc.6080 [20] Krumpen T, Birrien F, Kauker F, et al. The MOSAiC ice floe: sediment-laden survivor from the Siberian shelf[J]. The Cryosphere, 2020, 14(7): 2173−2187. doi: 10.5194/tc-14-2173-2020 [21] Spreen G, Kaleschke L, Heygster G. Sea ice remote sensing using AMSR-E 89-GHz channels[J]. Journal of Geophysical Research: Oceans, 2008, 113(C2): C02S03. [22] Chang X, Ye L, Zuo G, et al. Characteristics of sea ice kinematics from the marginal ice zone to the packed ice zone observed by buoys deployed during the 9th Chinese Arctic Expedition[J]. Acta Oceanologica Sinica, 2022, 41(7): 113−127. [23] Hersbach H, Bell B, Berrisford P, et al. Global reanalysis: goodbye ERA-Interim, hello ERA5[J]. ECMWF Newsletter, 2019, 159: 17−24. [24] Lei Ruibo, Hoppmann M, Cheng B, et al. Seasonal changes in sea ice kinematics and deformation in the Pacific sector of the Arctic Ocean in 2018/19[J]. The Cryosphere, 2021, 15(3): 1321−1341. doi: 10.5194/tc-15-1321-2021 [25] Womack A, Vichi M, Alberello A, et al. Atmospheric drivers of a winter-to-spring Lagrangian sea-ice drift in the eastern Antarctic marginal ice zone[J]. Journal of Glaciology, 2022, 68(271): 999−1013. [26] Li Zhe, Ding Qinghua, Steele M, et al. Recent upper Arctic Ocean warming expedited by summertime atmospheric processes[J]. Nature Communications, 2022, 13(1): 362. doi: 10.1038/s41467-022-28047-8 [27] Spreen G, Kwok R, Menemenlis D. Trends in Arctic sea ice drift and role of wind forcing: 1992–2009[J]. Geophysical Research Letters, 2011, 38(19): L19501. [28] Gui Dawei, Pang Xiaoping, Lei Ruibo, et al. Changes in sea ice kinematics in the Arctic outflow region and their associations with Arctic Northeast Passage accessibility[J]. Acta Oceanologica Sinica, 2019, 38(8): 101−110. doi: 10.1007/s13131-019-1451-1 [29] Li Linghan, Miller A J, McClean J L, et al. Processes driving sea ice variability in the Bering Sea in an eddying ocean/sea ice model: anomalies from the mean seasonal cycle[J]. Ocean Dynamics, 2014, 64(12): 1693−1717. doi: 10.1007/s10236-014-0769-7 [30] Lei Ruibo, Gui Dawei, Hutchings J K, et al. Annual cycles of sea ice motion and deformation derived from buoy measurements in the western Arctic Ocean over two ice seasons[J]. Journal of Geophysical Research: Oceans, 2020, 125(6): e2019JC015310. [31] Kwok R. Arctic sea ice thickness, volume, and multiyear ice coverage: losses and coupled variability (1958–2018)[J]. Environmental Research Letters, 2018, 13(10): 105005. doi: 10.1088/1748-9326/aae3ec [32] Rampal P, Weiss J, Marsan D. Positive trend in the mean speed and deformation rate of Arctic sea ice, 1979–2007[J]. Journal of Geophysical Research: Oceans, 2009, 114(C5): C05013. [33] Vihma T, Tisler P, Uotila P. Atmospheric forcing on the drift of Arctic sea ice in 1989–2009[J]. Geophysical Research Letters, 2012, 39(2): L02501. [34] Docquier D, Massonnet F, Barthélemy A, et al. Relationships between Arctic sea ice drift and strength modelled by NEMO-LIM3.6[J]. The Cryosphere, 2017, 11(6): 2829−2846. doi: 10.5194/tc-11-2829-2017 [35] Haller M, Brümmer B, Müller G. Atmosphere–ice forcing in the transpolar drift stream: results from the DAMOCLES ice-buoy campaigns 2007–2009[J]. The Cryosphere, 2014, 8(1): 275−288. doi: 10.5194/tc-8-275-2014 [36] Kwok R, Rothrock D A. Decline in Arctic sea ice thickness from submarine and ICESat records: 1958–2008[J]. Geophysical Research Letters, 2009, 36(15): L15501. [37] Martin T, Steele M, Zhang J L. Seasonality and long-term trend of Arctic Ocean surface stress in a model[J]. Journal of Geophysical Research: Oceans, 2014, 119(3): 1723−1738. doi: 10.1002/2013JC009425 -

计量
- 文章访问数: 918
- HTML全文浏览量: 410
- PDF下载量: 130
- 被引次数: 0
