

Reconstruction of sea surface pCO2 with high resolution: A case study of the Atlantic Ocean
-
摘要: 海洋是自然界中重要的碳汇,海−气二氧化碳通量通常利用大气和海水表层的二氧化碳分压(pCO2)差进行估算。受制于时空分布不均匀的观测样本和预测数据,目前已有海水表层二氧化碳分压的重构结果在空间分辨率上仍有较大可提升空间。为在高空间分辨率下更好地拟合时空变化,基于表层大洋二氧化碳地图(SOCAT)的海水表层二氧化碳逸度(f CO2)数据集和遥感卫星等多源数据,利用XGBoost模型建立了海水表层二氧化碳分压值与海洋物理、生物、光学等要素的非线性关系,并根据样本时空频率构建权重模型,最终重构了2000−2018年大西洋0.041 7°×0.041 7°下月度海水表层二氧化碳分压分布。预测结果的相关系数为0.966,均方根误差为8.087 μatm,平均偏差为4.012 μatm,与同类重构结果相比,海水表层二氧化碳分压的时空变化趋势一致性强,且在空间分辨率上具有优势。
-
关键词:
- 海水表层二氧化碳分压 /
- 遥感卫星 /
- 高空间分辨率
Abstract: Ocean is an important carbon sink in nature. The sea-air carbon dioxide flux is usually estimated by the difference of partial pressure of carbon dioxide (pCO2) between the atmosphere and the sea surface. Due to the imbalance of observation data on temporal and spatial distribution and datasets used for prediction, there is still large room for improvement in spatial resolution for present reconstruction of pCO2 on sea surface. In order to fit the temporal and spatial variability under high spatial resolution better, based on the sea surface fugacity of carbon dioxide (fCO2) observations of the Surface Ocean CO2 Atlas (SOCAT) and other multi-source data including remote sensing data, the nonlinear relationship between sea surface pCO2 and physical, biological, optical factors was established by a XGBoost model and a weight model was built based on spatiotemporal frequency of samples. A 0.041 7°×0.041 7° monthly sea surface pCO2 dataset in Atlantic from 2000 to 2018 was finally constructed with correlation coefficient of 0.966, mean squared error of 8.087 μatm and mean error of 4.012 μatm on prediction dataset. The reconstruction is highly consistent to other similar reconstruction results on temporal and spatial trend and also gains advantage in spatial resolution. -

图 11 大西洋海水表层二氧化碳分压观测数据及重构结果(红色点表示观测样本)
Fig. 11 Obeservations and reconstruction result of sea surface pCO2 in Atlantic (red points present for obeservation samples)

图 12 巴哈马海域海水表层二氧化碳分压重构结果(点数据表示绝对偏差)
Fig. 12 Reconstruction result of sea surface pCO2 in Bahamas sea area (points present the Bias)
表 1 ESA OC-CCI使用波段说明
Tab. 1 Introduction of bands used in ESA OC-CCI
遥感产品 波长/
nm遥感产品 波长/
nm遥感产品 波长/
nm黄色物质和碎屑吸收系数(adg) 412 总吸收系数(atot) 412 遥感反射率(Rrs) 412 443 443 443 490 490 490 510 510 510 560 560 560 665 665 665 浮游植物吸收
系数(aph)412 粒子后向散射
系数(bbp)412 向下漫射衰减
系数(Kd)490 443 443 490 490 叶绿素a(Chl a)浓度 − 510 510 560 560 665 665 注:“−”代表空值。  下载: 导出CSV
表 2 辅助数据来源
Tab. 2 Source of ancillary data
数据类型 数据来源 数据集 空间分辨率 遥感数据 MODIS Terra传感器 SST 0.041 7°×0.041 7° 模式数据 ECCO2 Cube92 SSS 0.25°×0.25° MLD GML CarbonTracker CT2019B xCO2 3°×2° 再分析数据 ERA5 单层月均数据集 SST 0.25°×0.25° u10
下载: 导出CSV
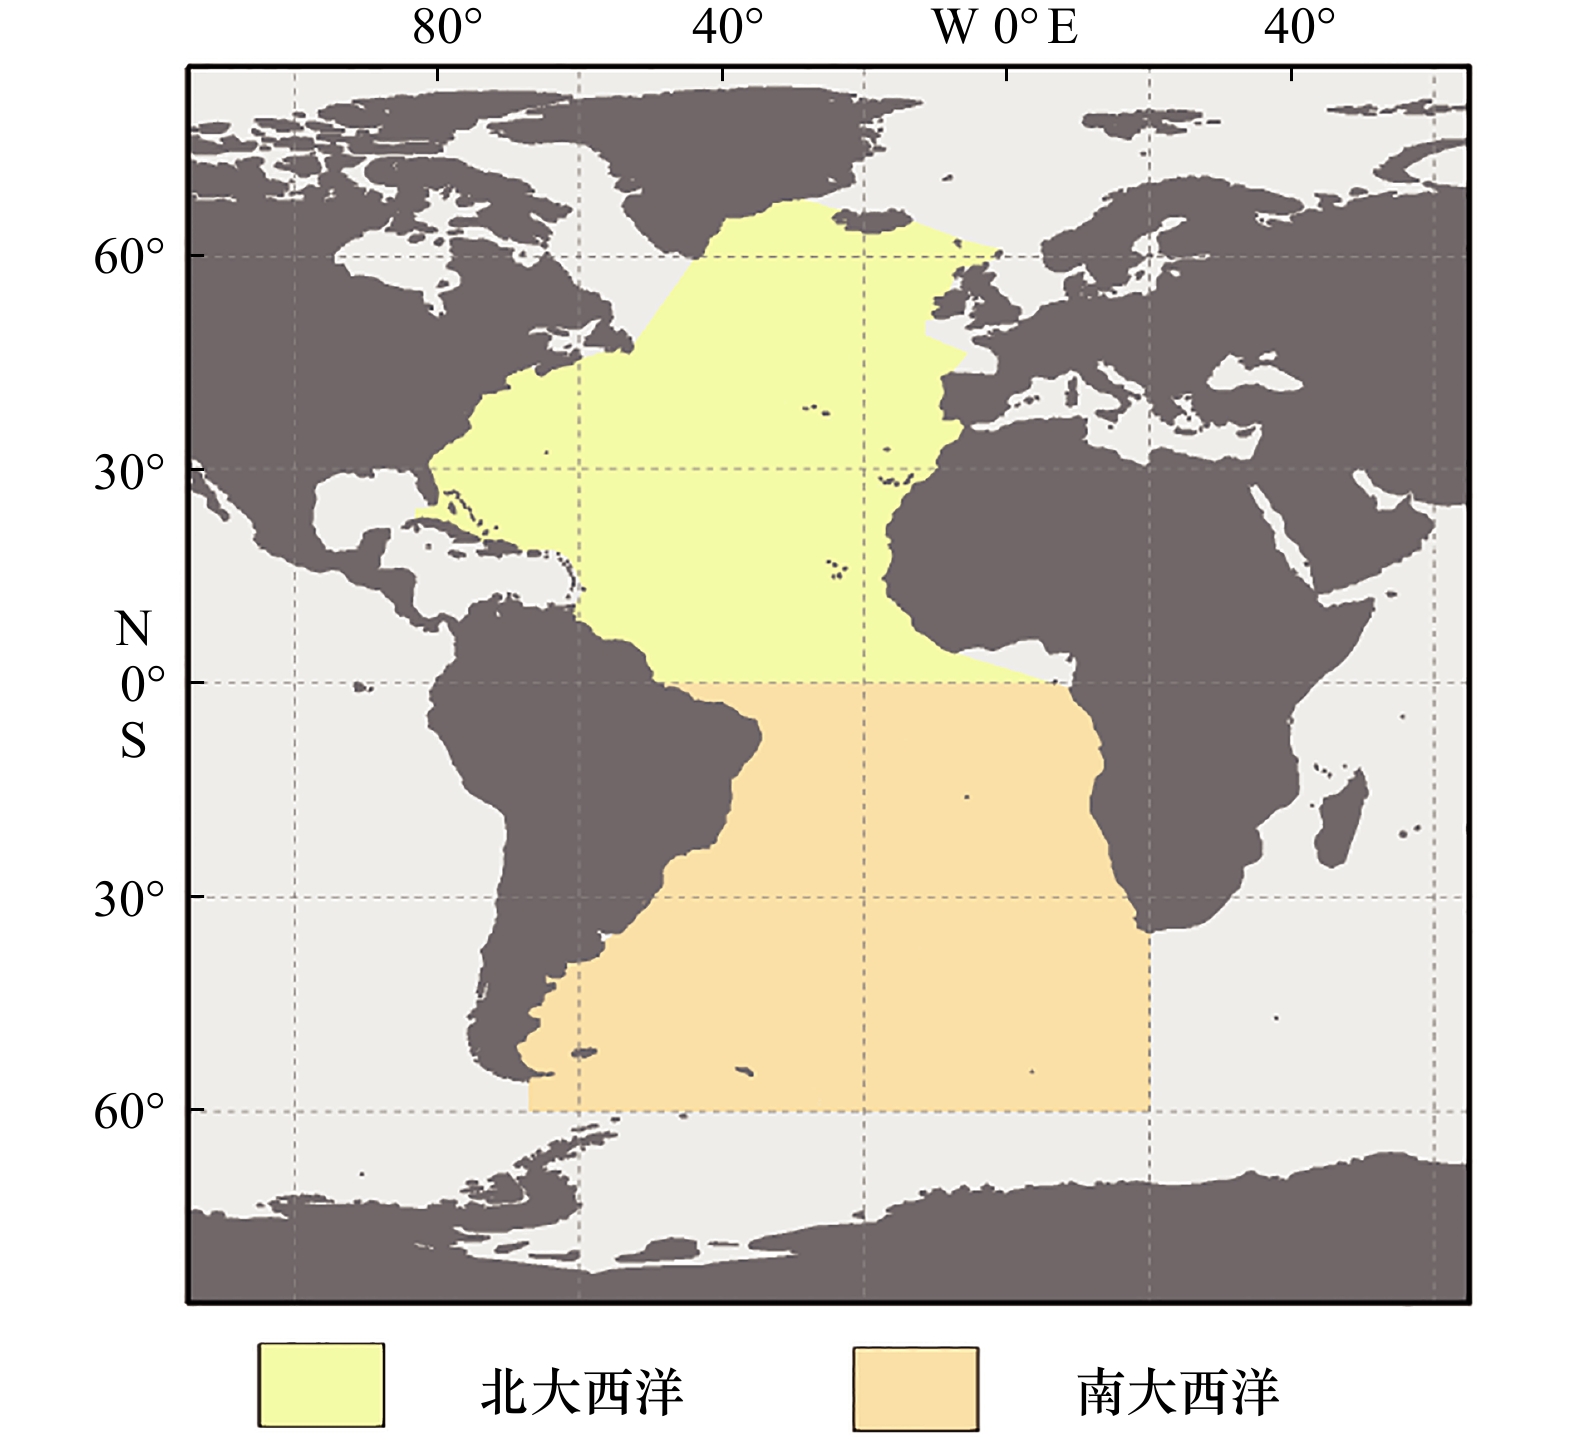
表 3 洋区模型验证
Tab. 3 Verification of model for ocean area
洋区 RMSE/μatm AD/μatm R2 北大西洋 6.001 2.143 0.984 南大西洋 5.295 1.987 0.991
下载: 导出CSV
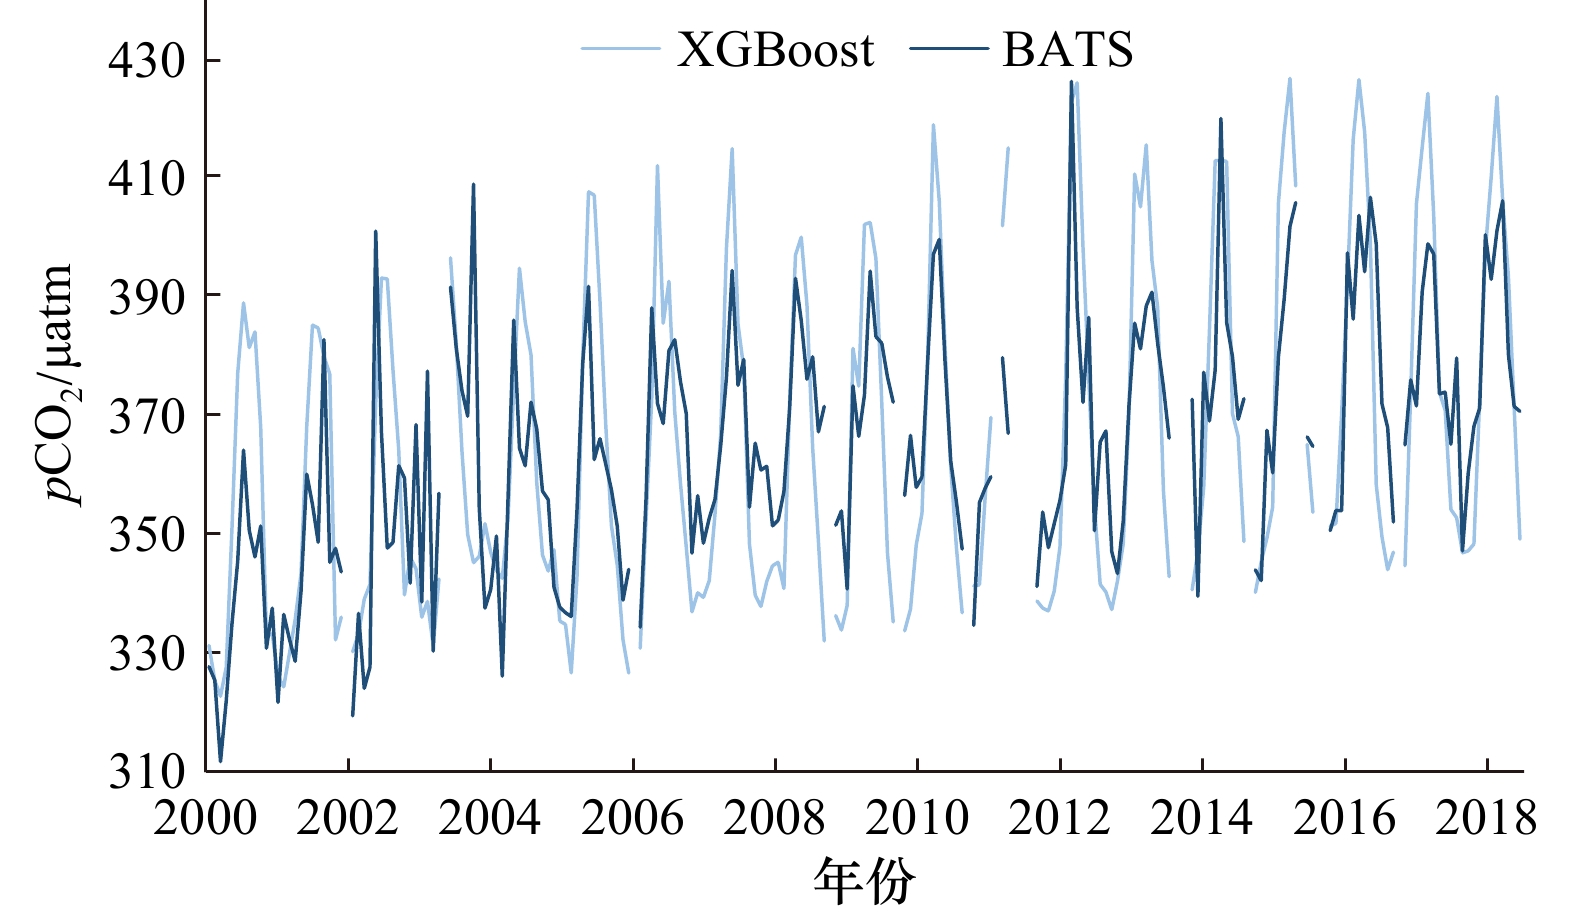
表 4 观测站点误差
Tab. 4 Error with observation stations
站点 位置 RMSE/μatm AD/μatm BATS 31.66°N, 64.16°W 18.90 14.37 ESTOC 29.04°N, 15.50°W 11.95 4.04
下载: 导出CSV
表 5 重构结果均方根误差
Tab. 5 RMSE of reconstruction result
时次 RMSE/μatm XGBoost SOM-FFN 2017年1月 4.48 14.97 2017年4月 4.99 16.21 2017年7月 5.44 16.29 2017年10月 3.31 11.76
下载: 导出CSV
-
[1] Hannah L. Chapter 2—The Climate System and Climate Change[M]. London: Academic Press, 2011: 13−52. [2] Friedlingstein P, Jones M W, O’Sullivan M, et al. Global carbon budget 2021[J]. Earth System Science Data, 2022, 14(4): 1917−2005. doi: 10.5194/essd-14-1917-2022 [3] Bai Yan, Cai Weijun, He Xianqiang, et al. A mechanistic semi-analytical method for remotely sensing sea surface pCO2 in river-dominated coastal oceans: a case study from the East China Sea[J]. Journal of Geophysical Research: Oceans, 2015, 120(3): 2331−2349. doi: 10.1002/2014JC010632 [4] 邱爽, 叶海军, 张玉红, 等. 基于航次观测和再分析资料的南海海表二氧化碳分压反演及变化机制分析[J]. 热带海洋学报, 2022, 41(1): 106−116. doi: 10.11978/2021030Qiu Shuang, Ye Haijun, Zhang Yuhong, et al. Multi-linear regression of partial pressure of sea-surface carbon dioxide in the South China Sea and its mechanism[J]. Journal of Tropical Oceanography, 2022, 41(1): 106−116. doi: 10.11978/2021030 [5] Chen Shuangling, Hu Chuanmin, Byrne R H, et al. Remote estimation of surface pCO2 on the West Florida Shelf[J]. Continental Shelf Research, 2016, 128: 10−25. doi: 10.1016/j.csr.2016.09.004 [6] Nurdjaman S. Estimation of partial pressure of CO2 (pCO2) around mount Krakatau waters, Sunda Straits, Indonesia[J]. Borneo Journal of Marine Science and Aquaculture (BJoMSA), 2021, 5(1): 25−31. doi: 10.51200/bjomsa.v5i1.2711 [7] Chen Shuangling, Hu Chuanmin, Barnes B B, et al. A machine learning approach to estimate surface ocean pCO2 from satellite measurements[J]. Remote Sensing of Environment, 2019, 228: 203−226. doi: 10.1016/j.rse.2019.04.019 [8] Dixit A, Lekshmi K, Bharti R, et al. Net sea-air CO2 fluxes and modeled partial pressure of CO2 in open ocean of bay of Bengal[J]. IEEE Journal of Selected Topics in Applied Earth Observations and Remote Sensing, 2019, 12(7): 2462−2469. doi: 10.1109/JSTARS.2019.2902253 [9] Wang Yanjun, Li Xiaofeng, Song Jinming, et al. Carbon sinks and variations of pCO2 in the Southern Ocean from 1998 to 2018 based on a deep learning approach[J]. IEEE Journal of Selected Topics in Applied Earth Observations and Remote Sensing, 2021, 14: 3495−3503. doi: 10.1109/JSTARS.2021.3066552 [10] Takahashi T, Sutherland S C, Wanninkhof R, et al. Climatological mean and decadal change in surface ocean pCO2, and net sea-air CO2 flux over the global oceans[J]. Deep-Sea Research Part II: Topical Studies in Oceanography, 2009, 56(8/10): 554−577. [11] Landschützer P, Gruber N, Bakker D C E. Decadal variations and trends of the global ocean carbon sink[J]. Global Biogeochemical Cycles, 2016, 30(10): 1396−1417. doi: 10.1002/2015GB005359 [12] Krishna K V, Shanmugam P, Nagamani P V. A multiparametric nonlinear regression approach for the estimation of global surface ocean pCO2 using satellite oceanographic data[J]. IEEE Journal of Selected Topics in Applied Earth Observations and Remote Sensing, 2020, 13: 6220−6235. doi: 10.1109/JSTARS.2020.3026363 [13] Chen Tianqi, Guestrin C. XGBoost: a scalable tree boosting system[C]//Proceedings of the 22nd ACM SIGKDD International Conference on Knowledge Discovery and Data Mining. San Francisco: ACM, 2016: 785−794. [14] Bakker D C E, Pfeil B, Landa C S, et al. A multi-decade record of high-quality fCO2 data in version 3 of the Surface Ocean CO2 Atlas (SOCAT)[J]. Earth System Science Data, 2016, 8(2): 383−413. doi: 10.5194/essd-8-383-2016 [15] Dickson A, Sabine C L, Christian J R. Guide to best practices for ocean CO2 measurements[R]. Sidney: North Pacific Marine Science Organization, 2007. [16] Sathyendranath S, Brewin R J W, Brockmann C, et al. An ocean-colour time series for use in climate studies: the experience of the ocean-colour climate change initiative (OC-CCI)[J]. Sensors, 2019, 19(19): 4285. doi: 10.3390/s19194285 [17] Menemenlis D, Campin J M, Heimbach P, et al. ECCO2: High resolution global ocean and sea ice data synthesis[J]. Mercator Ocean Quarterly Newsletter, 2008, 31: 13−21. [18] Hersbach H, Bell B, Berrisford P, et al. The ERA5 global reanalysis[J]. Quarterly Journal of the Royal Meteorological Society, 2020, 146(730): 1999−2049. doi: 10.1002/qj.3803 [19] Peters W, Jacobson A R, Sweeney C, et al. An atmospheric perspective on North American carbon dioxide exchange: CarbonTracker[J]. Proceedings of the National Academy of Sciences, 2007, 104(48): 18925−18930. doi: 10.1073/pnas.0708986104 [20] Sabine C L, Hankin S, Koyuk H, et al. Surface Ocean CO2 Atlas (SOCAT) gridded data products[J]. Earth System Science Data, 2013, 5(1): 145−153. doi: 10.5194/essd-5-145-2013 [21] Bates N R. Interannual variability of the oceanic CO2 sink in the subtropical gyre of the North Atlantic Ocean over the last 2 decades[J]. Journal of Geophysical Research: Oceans, 2007, 112(C9): C09013. [22] González-Dávila M, Santana-Casiano J M. Carbon dioxide, temperature, salinity and other variables collected via time series monitoring from METEOR, POSEIDON and others in the North Atlantic Ocean from 1995−10−02 to 2009−11−25 (NCEI Accession 0100064)[Z]. Dataset: NOAA National Centers for Environmental Information, 2012. -


计量
- 文章访问数: 852
- HTML全文浏览量: 248
- PDF下载量: 72
- 被引次数: 0
