

Analysis of the spatio-temporal variations of significant wave height in the northern South China Sea and the return period estimation methods of its extreme based on WW3
-
摘要: 本文基于第3代海浪模式WAVEWATCH III (WW3)模拟的1996–2015年海浪后报数据,分析了南海北部有效波高及其极值的时空变化特征,并采用Pearson-III和Gumbel两种极值分布方法对该区极值波高重现期进行了估算。结果表明,南海北部有效波高的季节变化和空间分布与季风风场基本一致,呈现秋冬高春夏低,并自吕宋海峡西侧向西南降低的特征,与ERA5再分析数据结果高度相似。有效波高极值(简称极值波高)的时空分布特征受时间分辨率强烈影响,采用极值数据的分辨率越高(如逐小时),所展现的台风型波浪特征越显著。扣除季节变化信号后的有效波高和年极值波高均体现出较强的线性增高趋势,近20年升高的比例分别为7.7%和31.6%,值得警惕和关注。该区多年一遇极值波高存在若干个大值区,且与台风的路径、强度有直接联系,表明台风是引发该区域极端大浪的最主要机制。对比Pearson-III和Gumbel极值分布估算结果发现:若极值波高较低,频率随极值波高升高缓慢降低,此时两种极值分布的估算都比较准确,差异极小,可忽略不计;但当研究时间范围内,某年极值波高远超其他年份时,Pearson-III极值分布估算结果明显高于Gumbel极值分布估算结果,且更接近实际极值波高,即Pearson-III极值分布在此情况下表现更好。本研究表明对于特定海区,在出现超强台风引发极值波高远超出其他年份时,不同计算方法对极值波高的估算差异较大,会显著影响重现期的评估。此外,南海北部年极值波高的强烈增高趋势,也可能给计算未来极值波高重现期和海上工程防护带来不可忽视的影响。
-
关键词:
- 南海北部 /
- 有效波高 /
- 极值波高 /
- 重现期 /
- Pearson-III极值分布 /
- Gumbel极值分布
Abstract: The spatio-temporal variations of significant wave height and its extremum in the northern South China Sea from 1996 to 2015 are analyzed based on the wave hindcast simulation by the third-generation wave model WaveWatch III (WW3). Two extreme value distribution methods, Pearson-III and Gumbel methods, have been used to estimate the return period of the extreme significant wave height in the northern South China Sea. The results show that the seasonal variation and spatial distribution of significant wave height in the northern South China Sea are consistent with the monsoon field, similar to the results of reanalysis data. It is high in autumn and winter and low in spring and summer, and decreases from the west part of the Luzon Strait to the southwest. But the extremum of significant wave height is strongly affected by the temporal resolution. The higher resolution (such as hourly), the more typhoon wave characteristics are displayed. After deducting the seasonal cycle signal, both the significant wave height and its annual extremum show an intense linear trend, increasing by 7.7% and 31.6% in the last 20 years respectively. There are several large value regions of the return period wave height in this area. They are related to the typhoon's track and intensity directly, indicating that typhoons are the primary mechanism causing extreme waves in this region. Comparing the Pearson-III and Gumbel distribution, it is found that if the extreme significant wave height was relatively low and the frequency decreased slowly with the growth of the extremum, the two methods are both accurate, with little difference which could be ignored. However, when the extreme significant wave height was much higher in one year than that in other years, the estimated result of the Pearson-III would be much higher than that of the Gumbel method, and also closer to the actual value. In other words, the Pearson-III extreme value distribution behaves better in this situation. This study shows that when the extreme significant wave height caused by a super typhoon is much higher than that in other years, the estimation from different methods differs greatly, which will significantly affect the assessment of the return period. Besides, the strong increasing trend of the extreme significant wave height in the northern South China Sea will also bring a non-negligible impact on the calculation of return period wave height and marine engineering protection in the future. -

图 1 南海北部有效波高和海面风的不同季节分布
Fig. 1 The seasonal distributions of the significant wave height and sea surface wind in the northern South China Sea
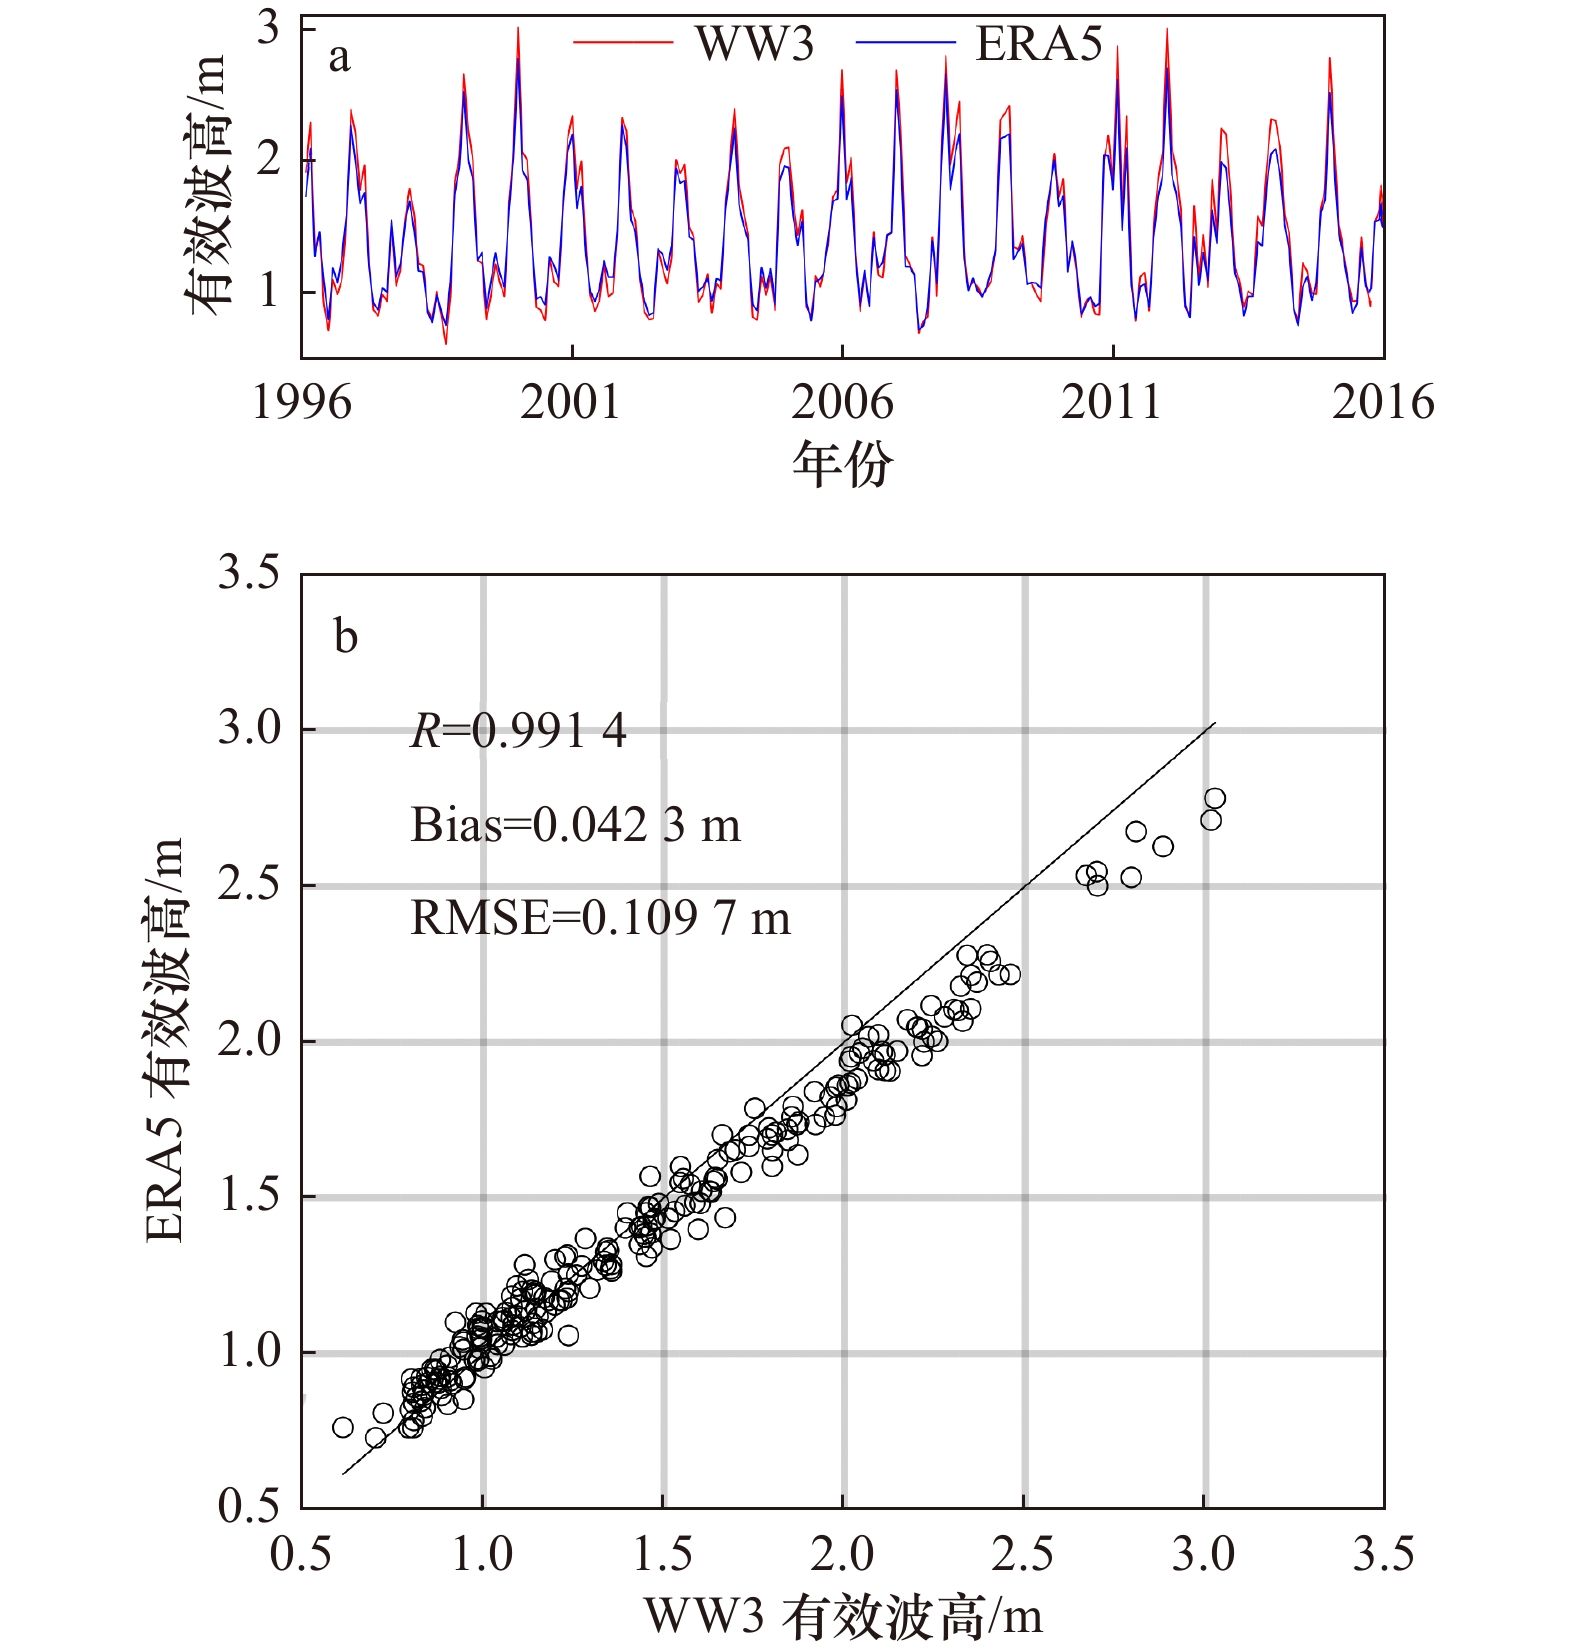
图 2 WW3和ERA5月平均数据南海北部(13°~25°N,105°~120°E)有效波高的对比
a. 时间序列;b. 散点图
Fig. 2 The comparison of the significant wave height in the northern South China Sea (13°–25°N, 105°–120°E) in WW3 simulation and ERA5 monthly dataset
a. Time series; b. scatter diagram
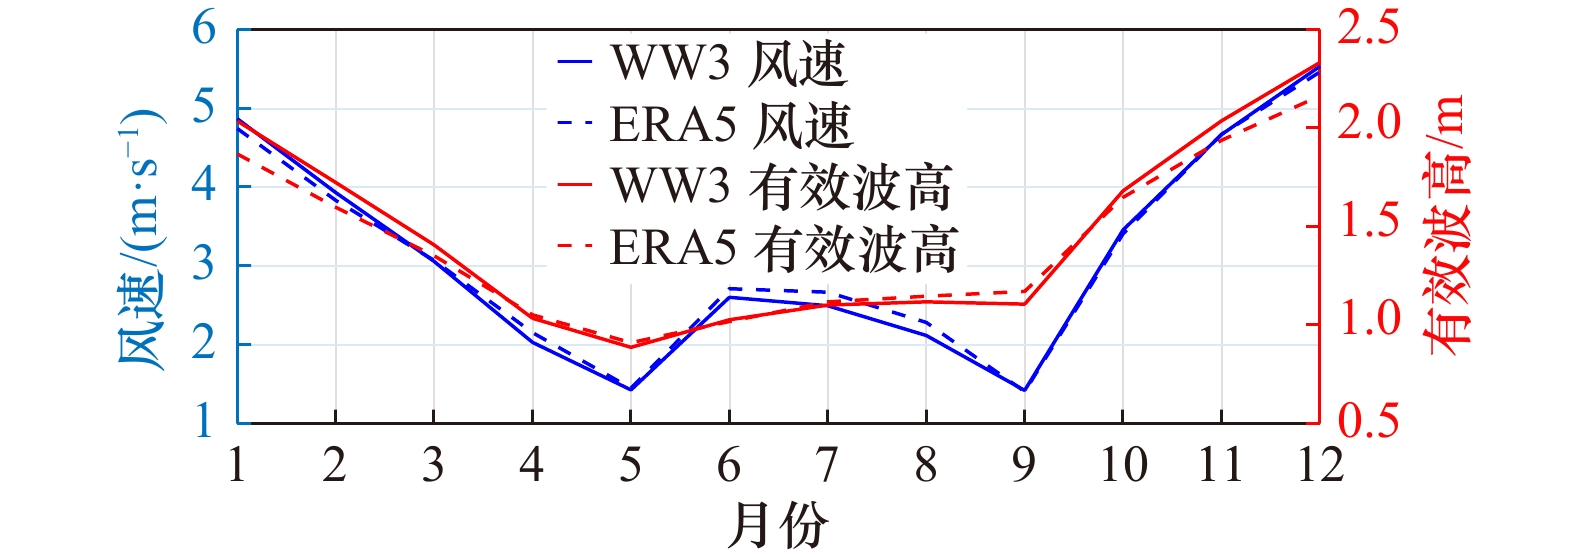
图 3 南海北部(13°~25°N,105°~120°E)海面风速和有效波高的多年月平均时间序列
Fig. 3 The seasonal variations of the significant wave height and sea surface wind in the northern South China Sea (13°–25°N, 105°–120°E)

图 4 1996–2015年WW3模拟结果南海北部有效波高不同极值算法比较
a. 月平均结果的年极值平均;b. 月平均结果的极大值;c. 逐小时结果的年极值平均;d. 逐小时结果的极大值
Fig. 4 The comparison of the significant wave height extreme values in different definitions over the northern South China Sea from 1996 to 2015 based on WW3 simulation
a. Average by annual extreme of the monthly data; b. maximum value of the monthly data; c. average by annual extreme of the hourly data; d. maximum value of the hourly data
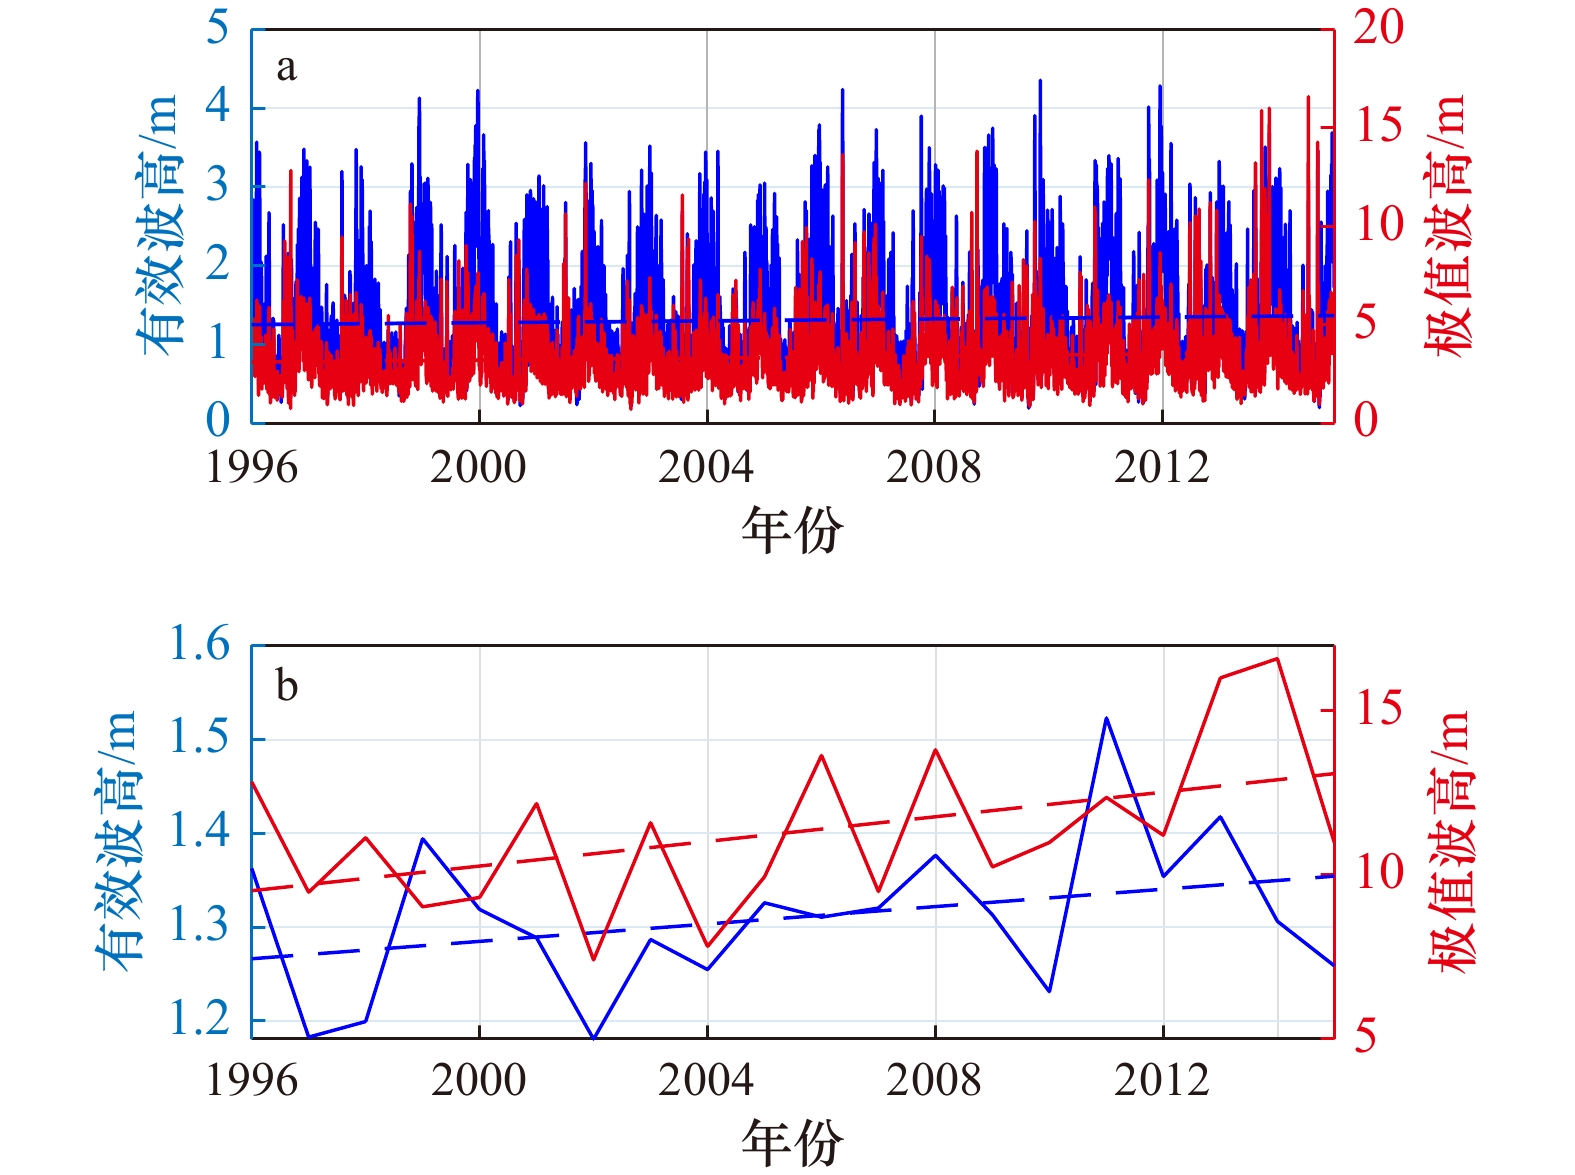
图 5 WW3中南海北部有效波高(蓝线)和极值波高(红线)的时间序列
a. 日平均和对应日极值;b. 年平均和对应年极值,虚线为各曲线对应的线性趋势
Fig. 5 The long-time variations of the WW3 significant wave height (blue lines) and its extreme values (red lines) over the northern South China Sea
a. Daily average and its extremum; b. annual average and its extremum, the dashed line is linear trend of the corresponding curve

图 6 南海北部典型年份的极值波高和台风路径
Fig. 6 The extreme wave height and typhoon path in typical years over the northern South China Sea

图 7 采用Gumbel(a,c)和Pearson-III(b,d)两种方法计算的南海北部不同重现期极值波高对比
白色字母C,D代表两个极值波高最大的海区,黑色字母A,B代表两个极值波高较低的海区。为了方便对比,a和b的色图取值范围与图3d一致,且c和d只在较a和b取值增大的范围内增加了新的紫色调,在极值波高低于16 m时,4个分图的取色是完全一致的
Fig. 7 The extreme wave height in different return periods from Gumbel (a, c) and Pearson-III (b, d) methods over the northern South China Sea
The white letters C and D represent the two regions with the largest extreme wave height, while the black letters A and B represent the two regions with low extreme wave height. For the convenience of comparison, the color map of a and b is consistent with that of Figure 3d, and c and d only adds a new purple tone in the range of increasing value compared with a and b. When the extreme wave height is lower than 16 m, the color map of the four sub-graphs is completely consistent
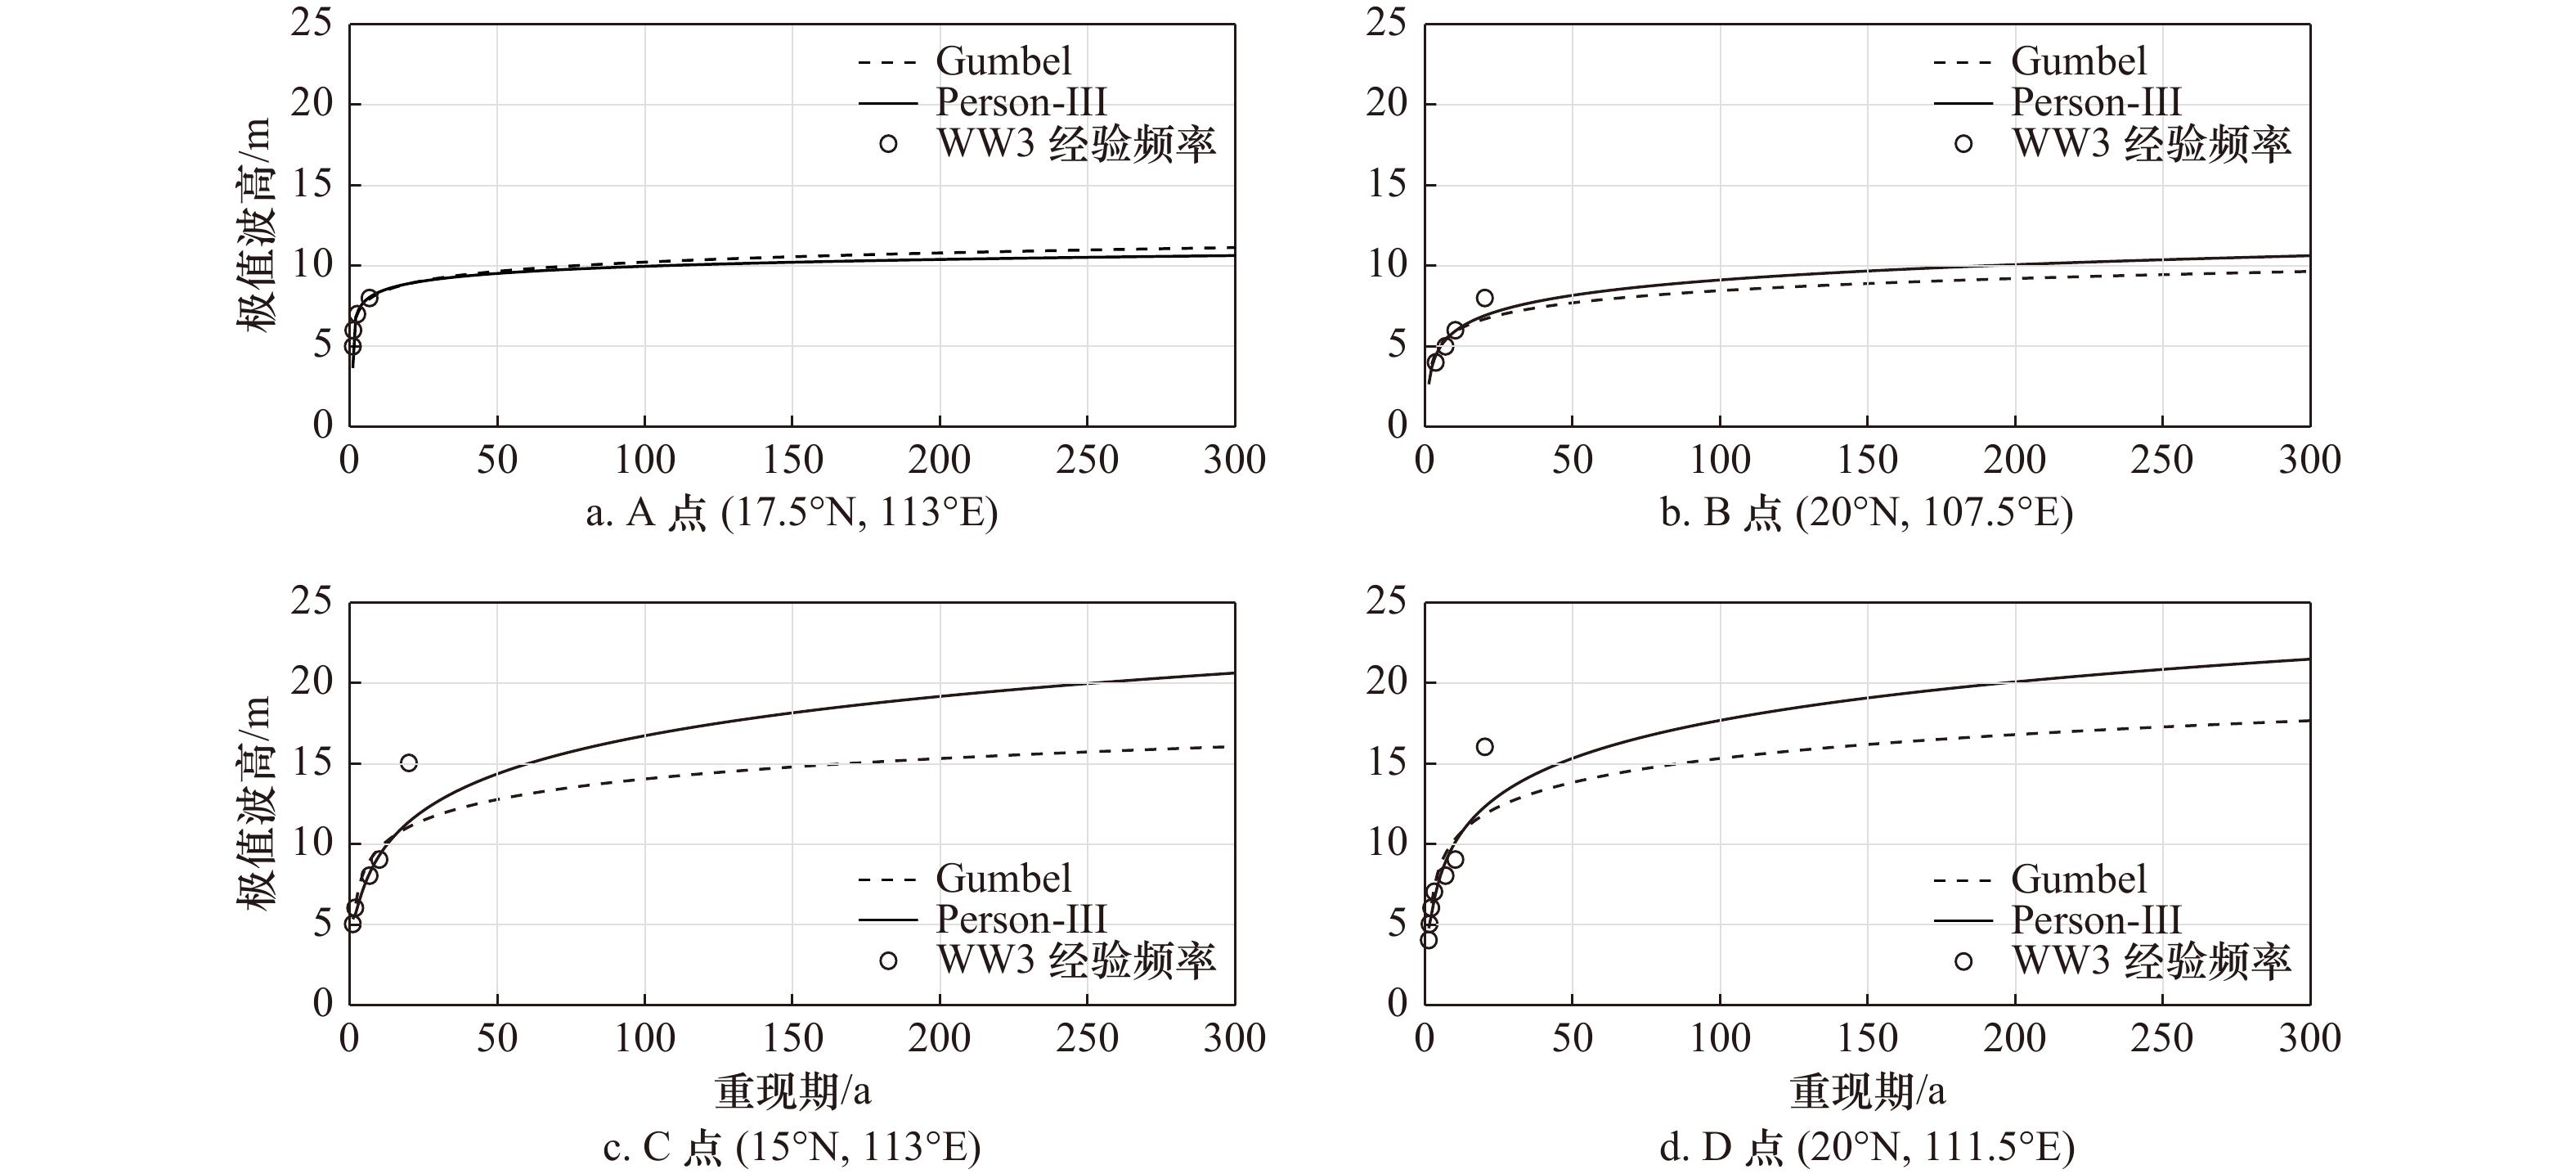
图 8 南海北部4个关键区代表点的重现期–极值波高曲线
Fig. 8 The return period–extreme wave height curves of the representative points in the four key areas of the northern South China Sea
表 1 南海北部年最强台风路径与对应极值波高的分类
Tab. 1 The classification of the yearly strongest typhoon path and corresponding extreme wave height over the northern South China Sea
分类 特征概述 典型年份 (1)南北型 如图6a所示,最强台风路径自南向北运动,对应极值波高大值区也是南北走向* 2006, 2010 (2)北部型 如图6b所示,最强台风出现于吕宋海峡北部至珠江口沿线,对应极值波高主要影响广东中东部沿岸,对北部湾影响较小 1996, 2008 (3)多区域混合型 如图6c所示,一般于南海北部的北、中、南区域均出现超强台风,对应了3个极值波高的大值区域。 2001, 2005, 2012, 2013 (4)中部型 如图6d所示,最强台风出现于吕宋海峡南部至雷州半岛沿线,对应极值波高主要影响雷州半岛海南省东侧,其次影响广东中东部沿岸,可能影响北部湾 2003, 2011, 2014 (5)低极值型 全年台风均较弱,极值波高基本均低于10 m 1997–2000, 2002, 2004, 2007, 2009 注:第3列中字体加粗的年份为图6中选用的代表年;*2006年最强台风“象神”是东西走向,但对极值波高影响较小,所以仍计入第一类,详见正文。  下载: 导出CSV
表 2 南海北部4个关键区代表点不同重现期的极值波高统计(单位:m)
Tab. 2 The extreme wave height in different return periods of the representative points in the four key areas of the northern South China Sea (unit: m)
代表点 计算方法 重现期 20年 50年 100年 200年 300年 A Gumbel 8.89 9.66 10.23 10.8 11.13 Pearson-III 9.24 10.08 10.68 11.27 11.61 B Gumbel 6.70 7.71 8.46 9.21 9.65 Pearson-III 7.11 8.58 9.71 10.85 11.52 C Gumbel 11.03 12.73 14.00 15.27 16.02 Pearson-III 11.5 14.85 17.55 20.34 22.01 D Gumbel 11.82 13.80 15.28 16.76 17.63 Pearson-III 12.51 15.93 18.63 21.39 23.03
下载: 导出CSV
-
[1] 薛力. “马六甲困境”内涵辨析与中国的应对[J]. 世界经济与政治, 2010(10): 117−140.Xue Li. Malacca dilemma and China’s response[J]. World Economics and Politics, 2010(10): 117−140. [2] 宋清润. 从“亚太再平衡”战略看美泰军事同盟关系[J]. 国际研究参考, 2015(2): 1−6.Song Qingrun. The US-Thailand military alliance from the perspective of “Asia-Pacific Rebalance” strategy[J]. International Study Reference, 2015(2): 1−6. [3] 宋建欣. 改革开放以来中国共产党维护南海主权权益研究[D]. 长春: 吉林大学, 2020.Song Jianxin. Study on Chinese communist party safeguarding the sovereignty and rights and interests of the South China Sea since the reform and opening-up[D]. Changchun: Jilin University, 2020. [4] 何小超, 王娴, 杨海军, 等. 南海深水油气资源的开发现状[C]//第十五届中国海洋(岸)工程学术讨论会论文集(上). 北京: 海洋出版社, 2011.He Xiaochao, Wang Xian, Yang Haijun, et al. Development status of deepwater oil and gas resources in the South China Sea[C]//Proceedings of the 15th China Ocean (Shore) Engineering Symposium. Beijing: China Ocean Press, 2011. [5] 王陆新, 潘继平, 杨丽丽. 全球深水油气勘探开发现状与前景展望[J]. 石油科技论坛, 2020, 39(2): 31−37.Wang Luxin, Pan Jiping, Yang Lili. Present conditions and prospect of global deepwater oil and gas exploration and development[J]. Petroleum Science and Technology Forum, 2020, 39(2): 31−37. [6] 齐义泉, 朱伯承, 施平, 等. WWATCH模式模拟南海海浪场的结果分析[J]. 海洋学报, 2003, 25(4): 1−9.Qi Yiquan, Chu P C, Shi Ping, et al. Analysis of significant wave heights from WWATCH and TOPEX/Poseidon Altimetry[J]. Haiyang Xuebao, 2003, 25(4): 1−9. [7] Chu P C, Qi Yiquan, Chen Yuchun, et al. South China Sea wind-wave characteristics. part I: validation of WAVEWATCH-III using TOPEX/Poseidon data[J]. Journal of Atmospheric and Oceanic Technology, 2004, 21(11): 1718−1733. doi: 10.1175/JTECH1661.1 [8] 周良明, 吴伦宇, 郭佩芳, 等. 应用WAVEWATCH-Ⅲ模式对南海的波浪场进行数值计算, 统计分析和研究[J]. 热带海洋学报, 2007, 26(5): 1−8.Zhou Liangming, Wu Lunyu, Guo Peifang, et al. Simulation and study of wave in South China Sea using WAVEWATCH-Ⅲ[J]. Journal of Tropical Oceanography, 2007, 26(5): 1−8. [9] 裘沙怡, 梁楚进, 董昌明, 等. 南海海面风、浪场时空变化特征及其关系分析[J]. 海洋学研究, 2013, 31(4): 1−9. doi: 10.3969/j.issn.1001-909X.2013.04.001Qiu Shayi, Liang Chujin, Dong Changming, et al. Analysis of the temporal and spatial variations in the wind and wave over the South China Sea[J]. Journal of Marine Sciences, 2013, 31(4): 1−9. doi: 10.3969/j.issn.1001-909X.2013.04.001 [10] 宗芳伊. 近20年南海波浪及波浪能分布、变化研究[D]. 青岛: 中国海洋大学, 2015.Zong Fangyi. Research on distributions and variations of sea wave and wave energy in South China Sea during recent 20 years[D]. Qingdao: Ocean University of China, 2015. [11] 韩树宗, 董杨杨, 张水平, 等. 南海波浪时空变化特征研究[J]. 海洋湖沼通报, 2020(2): 1−9.Han Shuzong, Dong Yangyang, Zhang Shuiping, et al. Study of the temporal and spatial variations of wave in South China Sea[J]. Transactions of Oceanology and Limnology, 2020(2): 1−9. [12] Ou S H, Liau J M, Hsu T W, et al. Simulating typhoon waves by SWAN wave model in coastal waters of Taiwan[J]. Ocean Engineering, 2002, 29(8): 947−971. doi: 10.1016/S0029-8018(01)00049-X [13] 徐尧. 南海台风浪与太平洋海浪的数值模拟[D]. 青岛: 中国科学院大学(中国科学院海洋研究所), 2017.Xu Yao. Numerical modelling of typhoon waves in the South China Sea and waves in the Pacific Ocean[D]. Qingdao: The Institute of Oceanology, Chinese Academy of Sciences, 2017. [14] Kim T R, Lee J H. Comparison of high wave hindcasts during typhoon Bolaven (1215) using SWAN and WAVEWATCH III Model[J]. Journal of Coastal Research, 2018, 85(S1): 1096−1100. [15] 石洪源, 尤再进, 胡聪, 等. 不同台风合成风场方案在南海的适用性研究[J]. 海洋湖沼通报, 2018(6): 17−23.Shi Hongyuan, You Zaijin, Hu Cong, et al. A study on the applicability of different typhoon synthetic wind fields in the South China Sea[J]. Transactions of Oceanology and Limnology, 2018(6): 17−23. [16] 林金波, 毛鸿飞, 吴光林, 等. 基于混合风场的南海台风浪数值模拟[J]. 广东海洋大学学报, 2021, 41(6): 44−52. doi: 10.3969/j.issn.1673-9159.2021.06.006Lin Jinbo, Mao Hongfei, Wu Guanglin, et al. Numerical modeling of typhoon waves in South China Sea based on mixed wind field[J]. Journal of Guangdong Ocean University, 2021, 41(6): 44−52. doi: 10.3969/j.issn.1673-9159.2021.06.006 [17] 陈晓斌, 周林, 史文丽, 等. 台风“梅花”风浪场和涌浪场特征分析[J]. 海洋科学进展, 2013, 31(1): 22−30.Chen Xiaobin, Zhou Lin, Shi Wenli, et al. Characteristics of wave and surge fields of Typhoon MUIFA[J]. Advances in Marine Science, 2013, 31(1): 22−30. [18] 郑崇伟, 陈志禄, 贾本凯, 等. 中国海海表风场、风浪、涌浪、混合浪场时空分布特征研究[J]. 中国科技信息, 2011(10): 32−33.Zheng Chongwei, Chen Zhilu, Jia Benkai, et al. Characteristics of sea surface wind field and wave field analysis in the China Sea[J]. China Science and Technology Information, 2011(10): 32−33. [19] 候瑞科. 利用耿贝尔极值分布计算年最高水位[J]. 海洋通报, 1993, 12(3): 126−129.Hou Ruike. The annual maximum water level was calculated using the distribution of Gumbel extreme values[J]. Marine Science Bulletin, 1993, 12(3): 126−129. [20] 葛黎丽, 屈衍, 张志旭, 等. 南海深水区风、浪、流多年一遇重现期极值的推算[J]. 中国海上油气, 2009, 21(3): 207−210. doi: 10.3969/j.issn.1673-1506.2009.03.016Ge Lili, Qu Yan, Zhang Zhixu, et al. The calculation of the extreme wind, wave and current for return periods in the deep water area of the South China Sea[J]. China Offshore Oil and Gas, 2009, 21(3): 207−210. doi: 10.3969/j.issn.1673-1506.2009.03.016 [21] 江丽芳, 尹毅, 齐义泉, 等. 钦州湾台风浪的多年一遇极值推算[J]. 热带海洋学报, 2012, 31(4): 8−16. doi: 10.3969/j.issn.1009-5470.2012.04.004Jiang Lifang, Yin Yi, Qi Yiquan, et al. The extreme wave parameters in the Qinzhou Bay during typhoon passages[J]. Journal of Tropical Oceanography, 2012, 31(4): 8−16. doi: 10.3969/j.issn.1009-5470.2012.04.004 [22] 王志旭, 陈子燊. 极值波高Weibull分布的参数估计方法对比分析[J]. 海洋通报, 2013, 32(2): 127−132.Wang Zhixu, Chen Zishen. Comparative analysis on the parameter estimation methods of Weibull distribution of extreme wave heights[J]. Marine Science Bulletin, 2013, 32(2): 127−132. [23] Liu Guilin, Gao Zhikang, Chen Baiyu, et al. Extreme values of storm surge elevation in Hangzhou Bay[J]. Ships and Offshore Structures, 2020, 15(4): 431−442. doi: 10.1080/17445302.2019.1661618 [24] 韩树宗, 王海龙, 郭佩芳. 利用卫星高度计资料进行多年一遇极值波高推算的方法研究[J]. 青岛海洋大学学报, 2003, 33(5): 657−664.Han Shuzong, Wang Hailong, Guo Peifang. A study of extreme SWH estimation method by using satellite altimeter data[J]. Journal of Ocean University of Qingdao, 2003, 33(5): 657−664. [25] 中华人民共和国交通部. JTJ 213-98, 海港水文规范[S]. 北京: 中华人民共和国交通部, 1999.Ministry of Transport of the People’s Republic of China. JTJ 213-98, Code for sea port hydrology[S]. Beijing: Ministry of Transport of the People’s Republic of China,1999. [26] 吴萌萌, 王毅, 万莉颖, 等. WAVEWATCH III模式在全球海域的数值模拟试验及结果分析[J]. 海洋预报, 2016, 33(5): 31−40. doi: 10.11737/j.issn.1003-0239.2016.05.004Wu Mengmeng, Wang Yi, Wan Liying, et al. Numerical simulation experiments and analysis using WAVEWATCH III in the global ocean[J]. Marine Forecasts, 2016, 33(5): 31−40. doi: 10.11737/j.issn.1003-0239.2016.05.004 [27] Hersbach H, Bell B, Berrisford P, et al. ERA5 monthly averaged data on single levels from 1979 to present[R]. Reading: European Centre for Medium-Range Weather Forecasts, 2019: 252–266. [28] 王彦俊. 中国近海台风路径集合数据集(1945–2021)[EB/OL]. (2022–06–10) [2022–09–01]. http://dx. doi.org/10.12157/IOCAS.20210804.001.Wang Yanjun. A dataset of typhoon tracks in offshore China (1945–2021)[EB/OL]. (2022–06–10) [2022–09–01]. http://dx. doi.org/10.12157/IOCAS.20210804.001. [29] 李明杰, 齐鹏, 侯一筠. 山东沿岸多年一遇最高水位计算[J]. 海洋科学, 2009, 33(11): 78−81.Li Mingjie, Qi Peng, Hou Yijun. Computation of highest water levels of multiyear return periods along the coast of Shandong[J]. Marine Sciences, 2009, 33(11): 78−81. [30] 马智群. 陕西省淳化县暴雨强度公式推求研究[D]. 西安: 长安大学, 2019.Ma Zhiqun. The research of storm intensity formula in Chunhua country, Shanxi Province[D]. Xi’an: Chang’an University, 2019. [31] 孙玉芳. 基于Matlab开发环境的皮尔逊Ⅲ型频率曲线分析软件研发[J]. 山西水利科技, 2014(2): 61−62, 70.Sun Yufang. Software development for analyzing pearson type III frequency curve based on matlab environment[J]. Shanxi Hydrotechnics, 2014(2): 61−62, 70. [32] 王焕. 南海海域波浪时空变化特征分析及有效波高预测研究[D]. 湛江: 广东海洋大学, 2021.Wang Huan. Analysis of spatial-temporal characteristics of waves and prediction of significant wave height in the South China Sea[D]. Zhanjiang: Guangdong Ocean University, 2021. [33] 练江帆, 梁必骐, 郑新江. 9615号台风特点及其原因分析[J]. 中山大学学报(自然科学版), 1998, 37(2): 85−90.Lian Jiangfan, Liang Biqi, Zheng Xinjiang. The analysis of the characteristics and causes of typhoon sally[J]. Acta Scientiarum Naturalium Universitatis Sunyatseni, 1998, 37(2): 85−90. [34] 邰佳爱, 张长宽, 宋立荣. 强台风0814(黑格比)和9615(莎莉)台风暴潮珠江口内超高潮位分析[J]. 海洋通报, 2009, 28(6): 14−18. doi: 10.3969/j.issn.1001-6392.2009.06.003Tai Jiaai, Zhang Changkuan, Song Lirong. Super high water levels due to intense typhoons 0814 (Hagupit) and 9615 (Sally) in the Peal River Estuary[J]. Marine Science Bulletin, 2009, 28(6): 14−18. doi: 10.3969/j.issn.1001-6392.2009.06.003 [35] 中华人民共和国水利部. SL 654-2014, 水利水电工程合理使用年限及耐久性设计规范[S]. 北京: 中国水利水电出版社, 2014.Ministry of Water Resources of the People's Republic of China. SL 654-2014, Code for rational service life and durability design of water resources and hydropower projects[S]. Beijing: China Water Conservancy and Hydropower Press, 2014. [36] Pham D T, Switzer A D, Huerta G, et al. Spatiotemporal variations of extreme sea levels around the South China Sea: assessing the influence of tropical cyclones, monsoons and major climate modes[J]. Natural Hazards, 2019, 98(3): 969−1001. doi: 10.1007/s11069-019-03596-2 -

计量
- 文章访问数: 745
- HTML全文浏览量: 205
- PDF下载量: 96
- 被引次数: 0
