

Water temperature prediction in the Sansha Bay based on the integration of differential regression model and transportable long short-term memory network
-
摘要: 水温预测是保障近海渔业生产和环境安全的关键技术。现有的数值模型开发成本大,业务化应用不足。本文提出了一种集成差分回归(Differential Regression, DR)和可迁移长短期记忆网络(Transferable Long Short-Term Memory, TLSTM)的水温预测方法。以厦门湾(源域,数据多)和三沙湾(目标域,数据少)水温为研究对象,根据三沙湾在线监测水温和预报气温数据建立了DR模型,根据厦门湾长时间监测水温数据建立了TLSTM模型,采用变权算法将纯差分回归模型、混差分回归模型和TLSTM模型集成为三沙湾DR-TLSTM模型,对模型性能进行了评估,并与仅根据三沙湾少量监测数据建立的LSTM模型效果进行了对比。结果表明:(1) TLSTM模型的预测精度优于基于目标域少量数据建立的LSTM模型;(2) DR-TLSTM集成模型具有较高的预测精度,未来1~7 d预测的均方根误差为0.13~0.77℃,未来1~3 d预测的均方根误差小于0.4℃;(3) DR-TLSTM集成模型可有效预测水温骤升或骤降趋势,对水温突变点的预测均方根误差为0.29~1.09℃。基于本文建立的DR-TLSTM集成模型,实现了三沙湾渔业水域的水温预警预报业务化信息服务。Abstract: Water temperature prediction is a key technology to ensure the production of coastal fisheries and environmental safety. The existing numerical models have high development costs with insufficient business applications. This study develops a prediction method of water temperature through integrating differential regression (DR) and transferable long short-term memory (TLSTM). Taking the water temperature of Xiamen Bay (source domain, with a large number of data) and Sansha Bay (target domain, with less data) as the research object, the DR model is established based on the data of monitoring water temperature and forecast temperature in the Sansha Bay, and the TLSTM model is established based on the long-term monitoring data of water temperature in the Xiamen Bay. The pure differential regression model, mixed differential regression model and TLSTM model are integrated into the DR-TLSTM model of Sansha Bay by using variable weight algorithm, and the performance of the model is evaluated, the results are compared with the LSTM model based on only a small amount of monitoring data in the Sansha Bay. The results show that: (1) the prediction accuracy of TLSTM model is better than that of LSTM model based on a small amount of data in the target domain; (2) the DR-TLSTM model has high prediction accuracy, and the root mean square error of prediction in the next 1−7 days is 0.13−0.77℃, and the root mean square error of prediction in the next 1−3 days is less than 0.4℃; (3) the DR-TLSTM model can effectively predict the sudden rise or fall trend of water temperature, and the root mean square error of predicting the sudden change point of water temperature is 0.29−1.09℃. Based on the DR-TLSTM model, the operational information service of water temperature early warning and forecast in the Sansha Bay is realized.
-
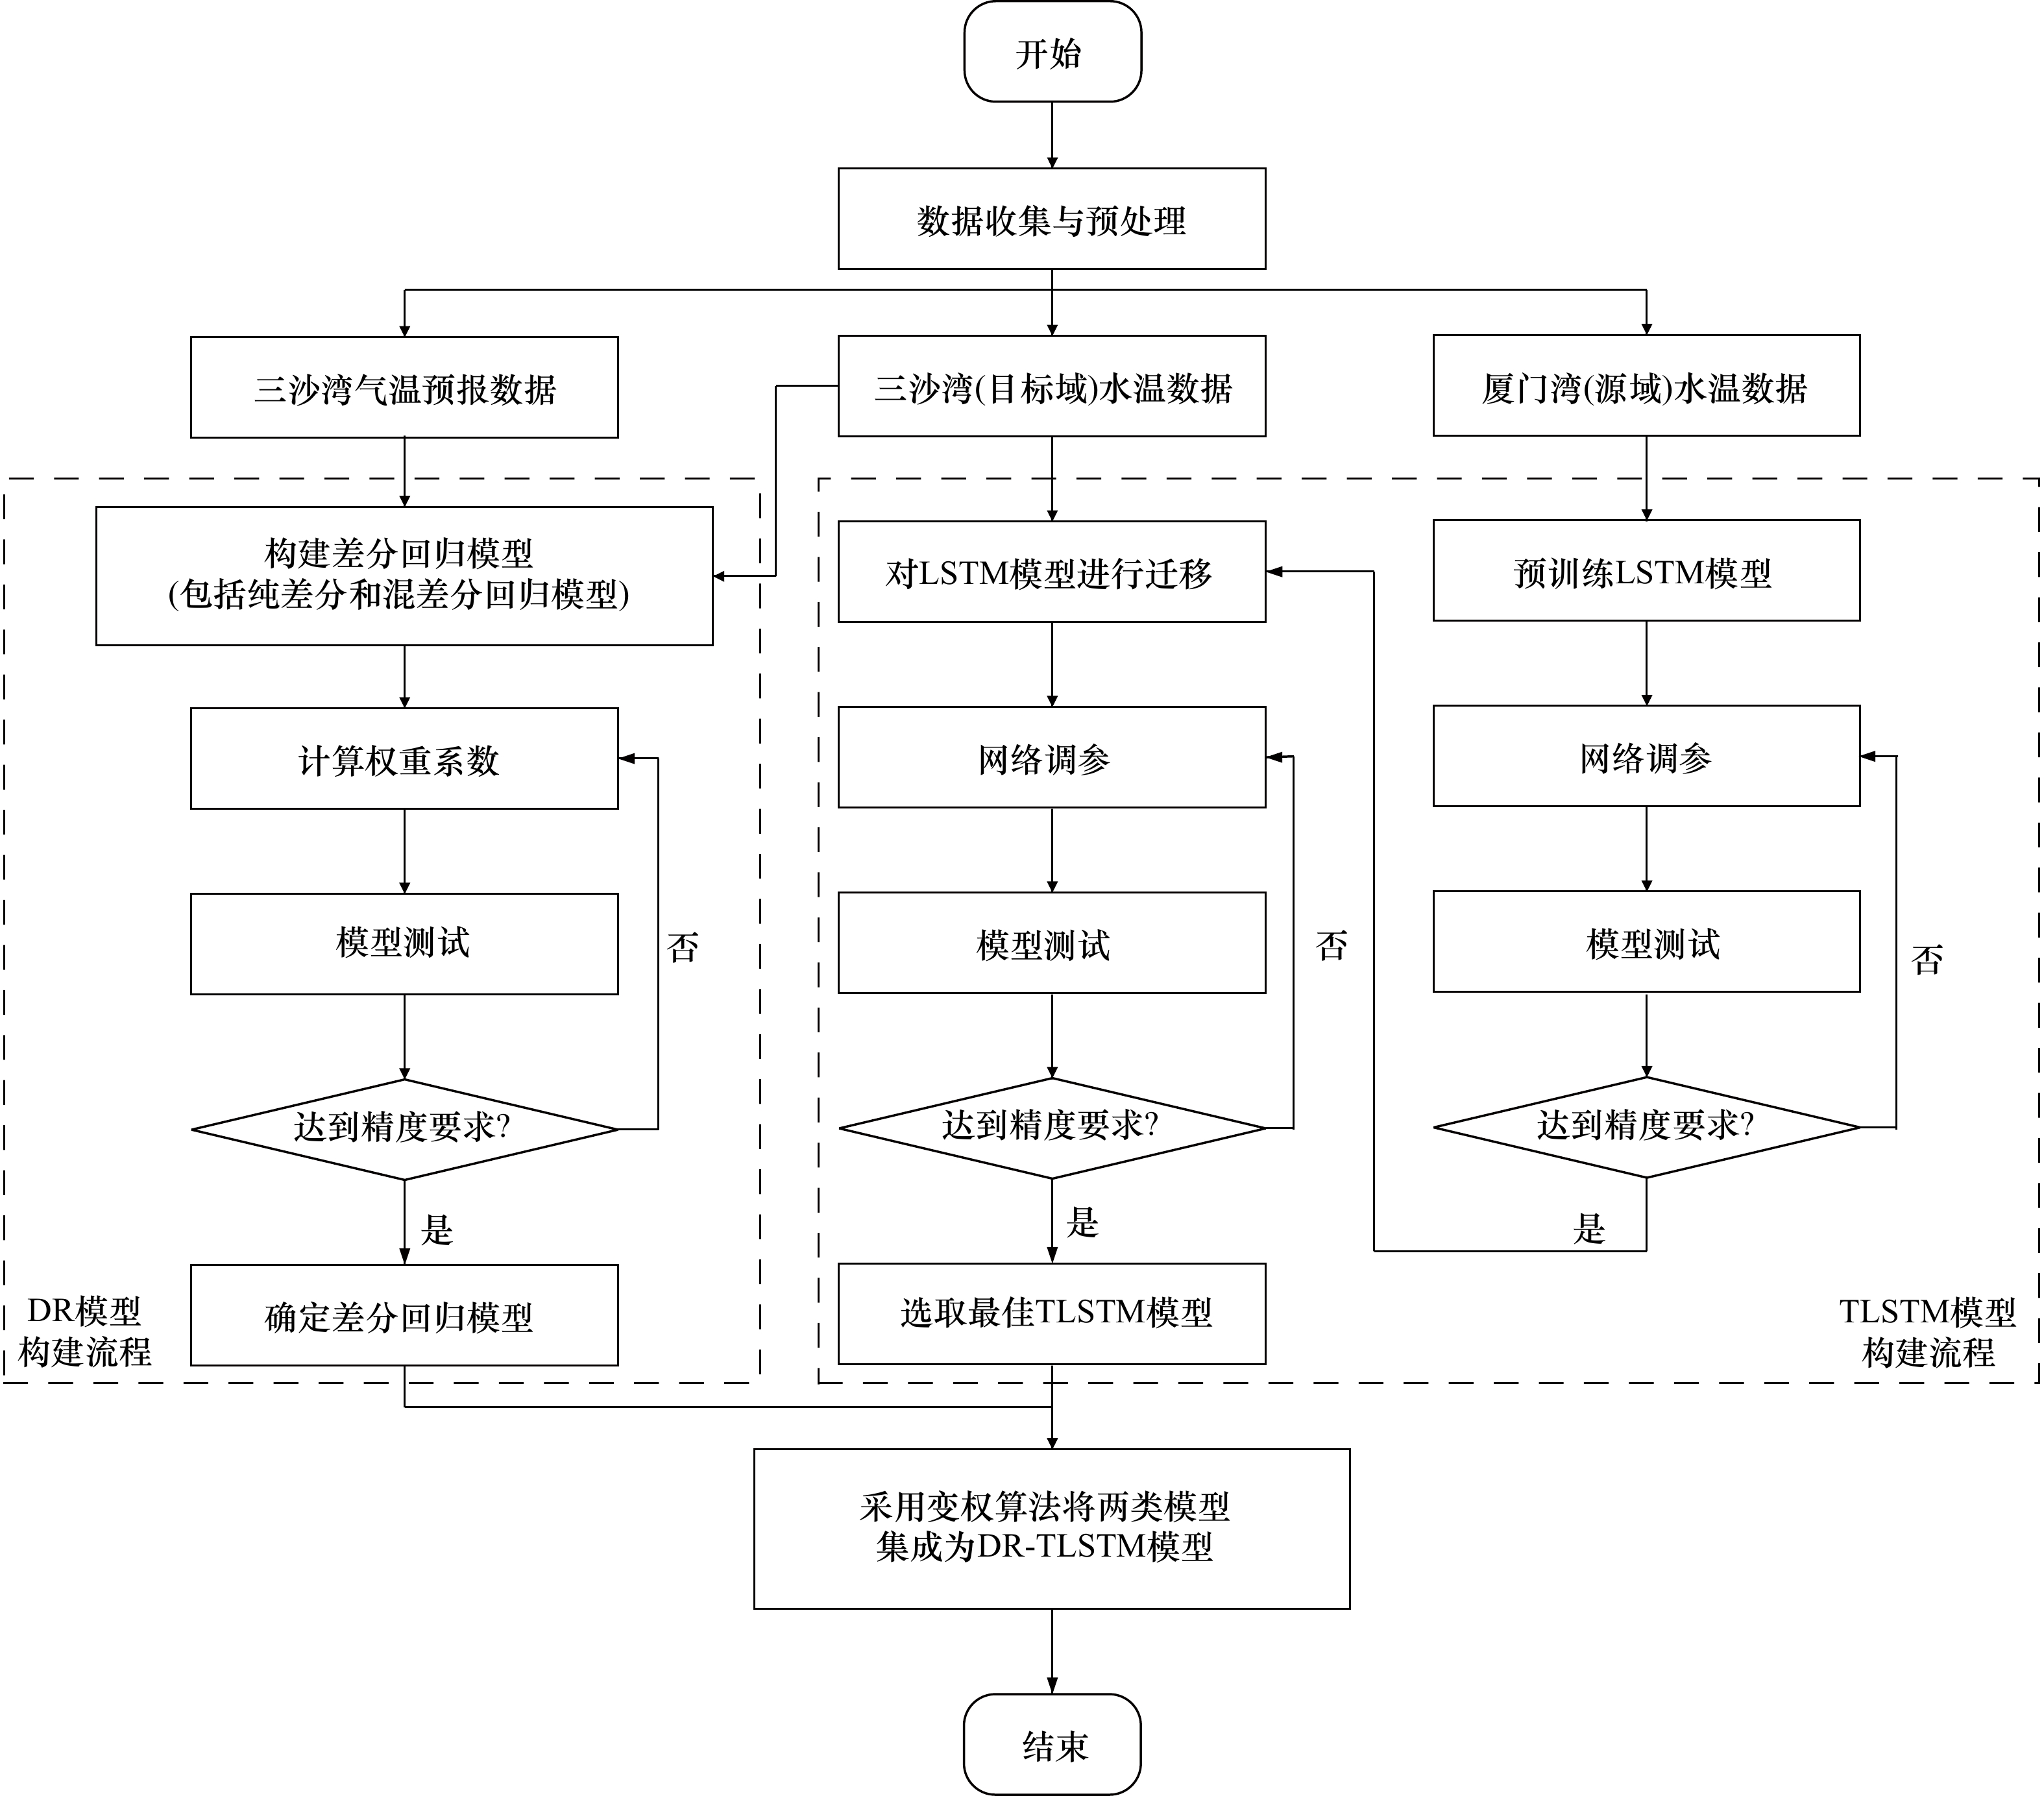
图 1 基于差分回归(DR)与可迁移长短期记忆网络(TLSTM)集成的三沙湾DR-TLSTM模型建模流程
Fig. 1 Modeling process of DR-TLSTM model of Sansha Bay based on differential regression (DR) and transferable long short-term memory (TLSTM)
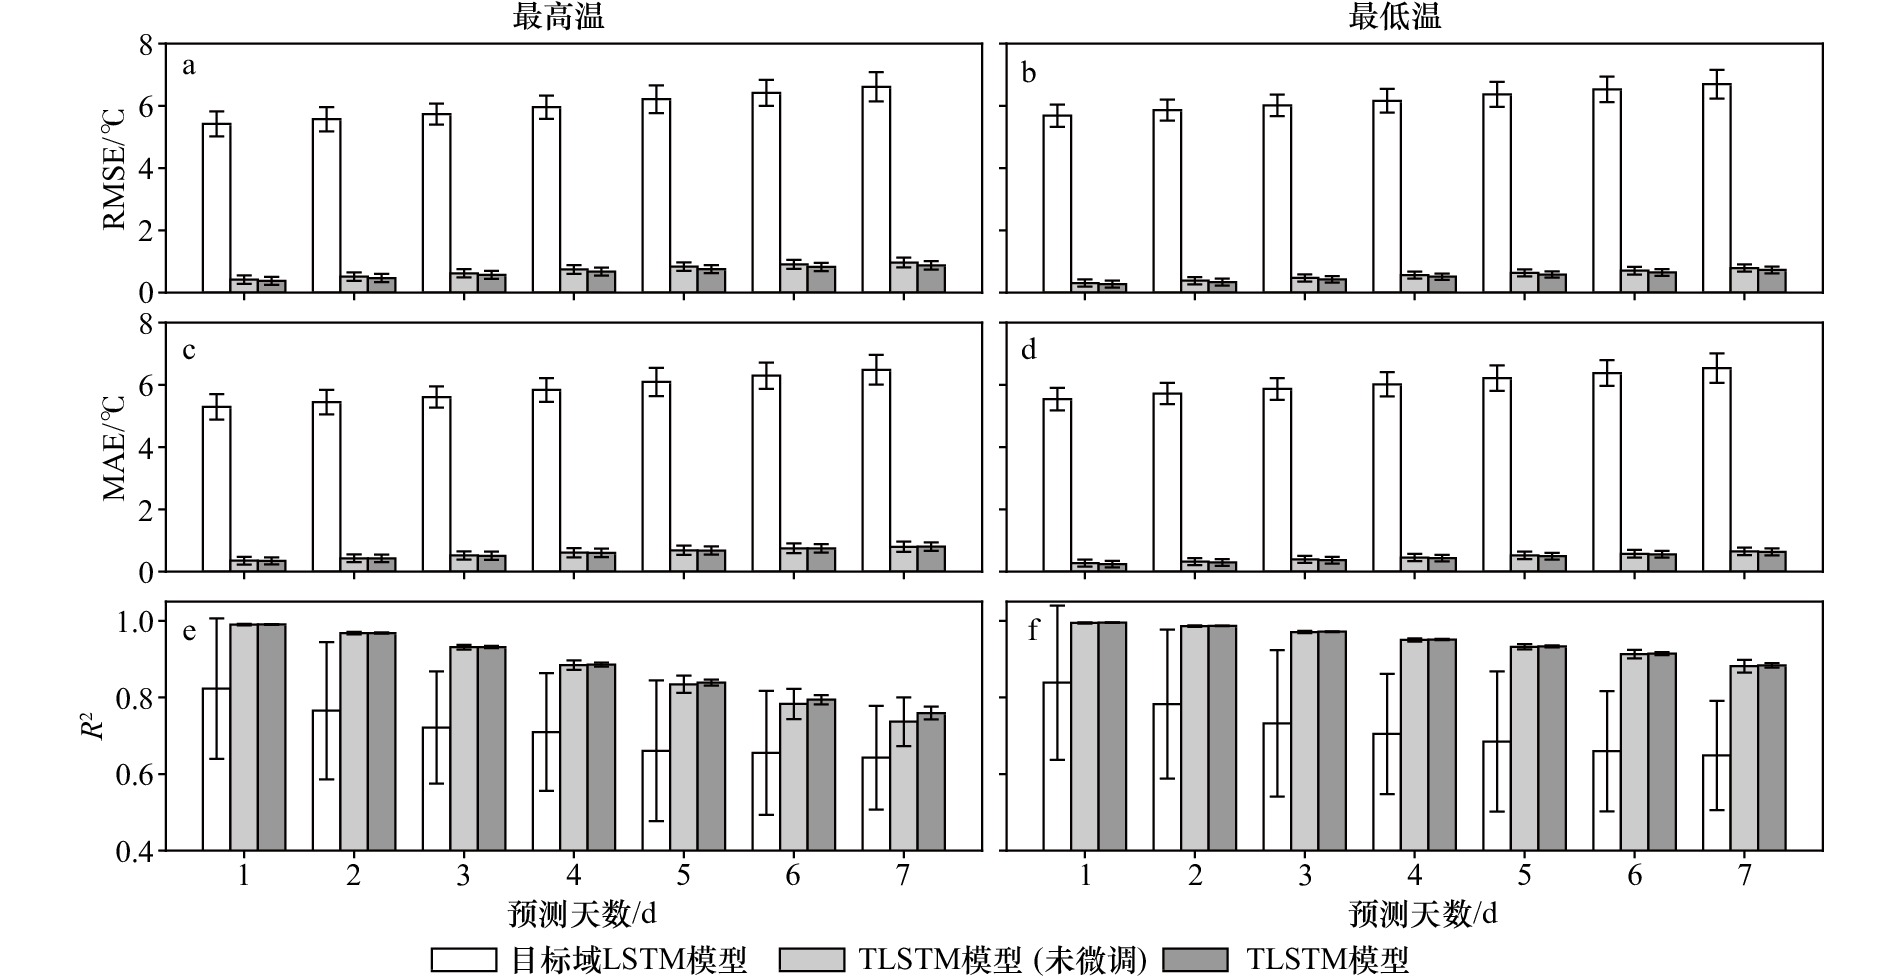
图 2 迁移学习对模型预测三沙湾未来1~7 d水温的影响
a, c, e. 最高温100次重复测试的均方根误差(RMSE)、平均绝对误差(MAE)、拟合优度(R2)的平均值和标准差;b, d, f. 最低温100次重复测试的均方根误差(RMSE)、平均绝对误差(MAE)、拟合优度(R2)的平均值和标准差
Fig. 2 The influence of transfer learning on the prediction of water temperature for the next 1−7 days in the Sansha Bay
a, c, e. Means and standard deviations of root mean square error (RMSE), mean absolute error (MAE), goodness of fit (R2) of 100 replicates at the maximum temperature; b, d, f. means and standard deviations of root mean square error (RMSE), mean absolute error (MAE), goodness of fit (R2) of 100 replicates at the minimum temperature

图 3 变权组合对模型预测三沙湾未来1~7 d水温的影响
a, c, e. 最高温100次重复测试的均方根误差(RMSE)、平均绝对误差(MAE)、拟合优度(R2)的平均值和标准差;b, d, f. 最低温100次重复测试的均方根误差(RMSE)、平均绝对误差(MAE)、拟合优度(R2)的平均值和标准差
Fig. 3 Influence of variable-weight combination on the predicted water temperature for the next 1− 7 days in the Sansha Bay
a, c, e. Means and standard deviations of root mean square error (RMSE), mean absolute error (MAE), goodness of fit (R2) of 100 replicates at the maximum temperature; b, d, f. means and standard deviations of root mean square error (RMSE), mean absolute error (MAE), goodness of fit (R2) of 100 replicates at the minimum temperature

图 4 变权组合对模型预测三沙湾未来1~7 d水温突变点的影响
a, c, e. 最高温100次重复测试的均方根误差(RMSE)、平均绝对误差(MAE)、拟合优度(R2)的平均值和标准差;b, d, f. 最低温100次重复测试的均方根误差(RMSE)、平均绝对误差(MAE)、拟合优度(R2)的平均值和标准差
Fig. 4 Influence of variable-weight combination on the prediction of water temperature sudden change point for the next 1−7 days in the Sansha Bay
a, c, e. Means and standard deviations of root mean square error (RMSE), mean absolute error (MAE), goodness of fit (R2) of 100 replicates at the maximum temperature; b, d, f. means and standard deviations of root mean square error (RMSE), mean absolute error (MAE), goodness of fit (R2) of 100 replicates at the minimum temperature

图 5 三沙湾未来1~7 d水温实测值和模型预测值对比(2021−2022年)
a, b. 第1天对比结果;c, d. 第2天对比结果;e, f. 第3天对比结果;g, h. 第4天对比结果;i, j. 第5天对比结果;k, l. 第6天对比结果;m, n. 第7天对比结果
Fig. 5 Comparison of observed and predicted water temperature for the next 1−7 days in the Sansha Bay (2021−2022)
a, b. Comparison results on day 1; c, d. comparison results on day 2; e, f. comparison results on day 3; g, h. comparison results on day 4; i, j. comparison results on day 5; k, l. comparison results on day 6; m, n. comparison results on day 7
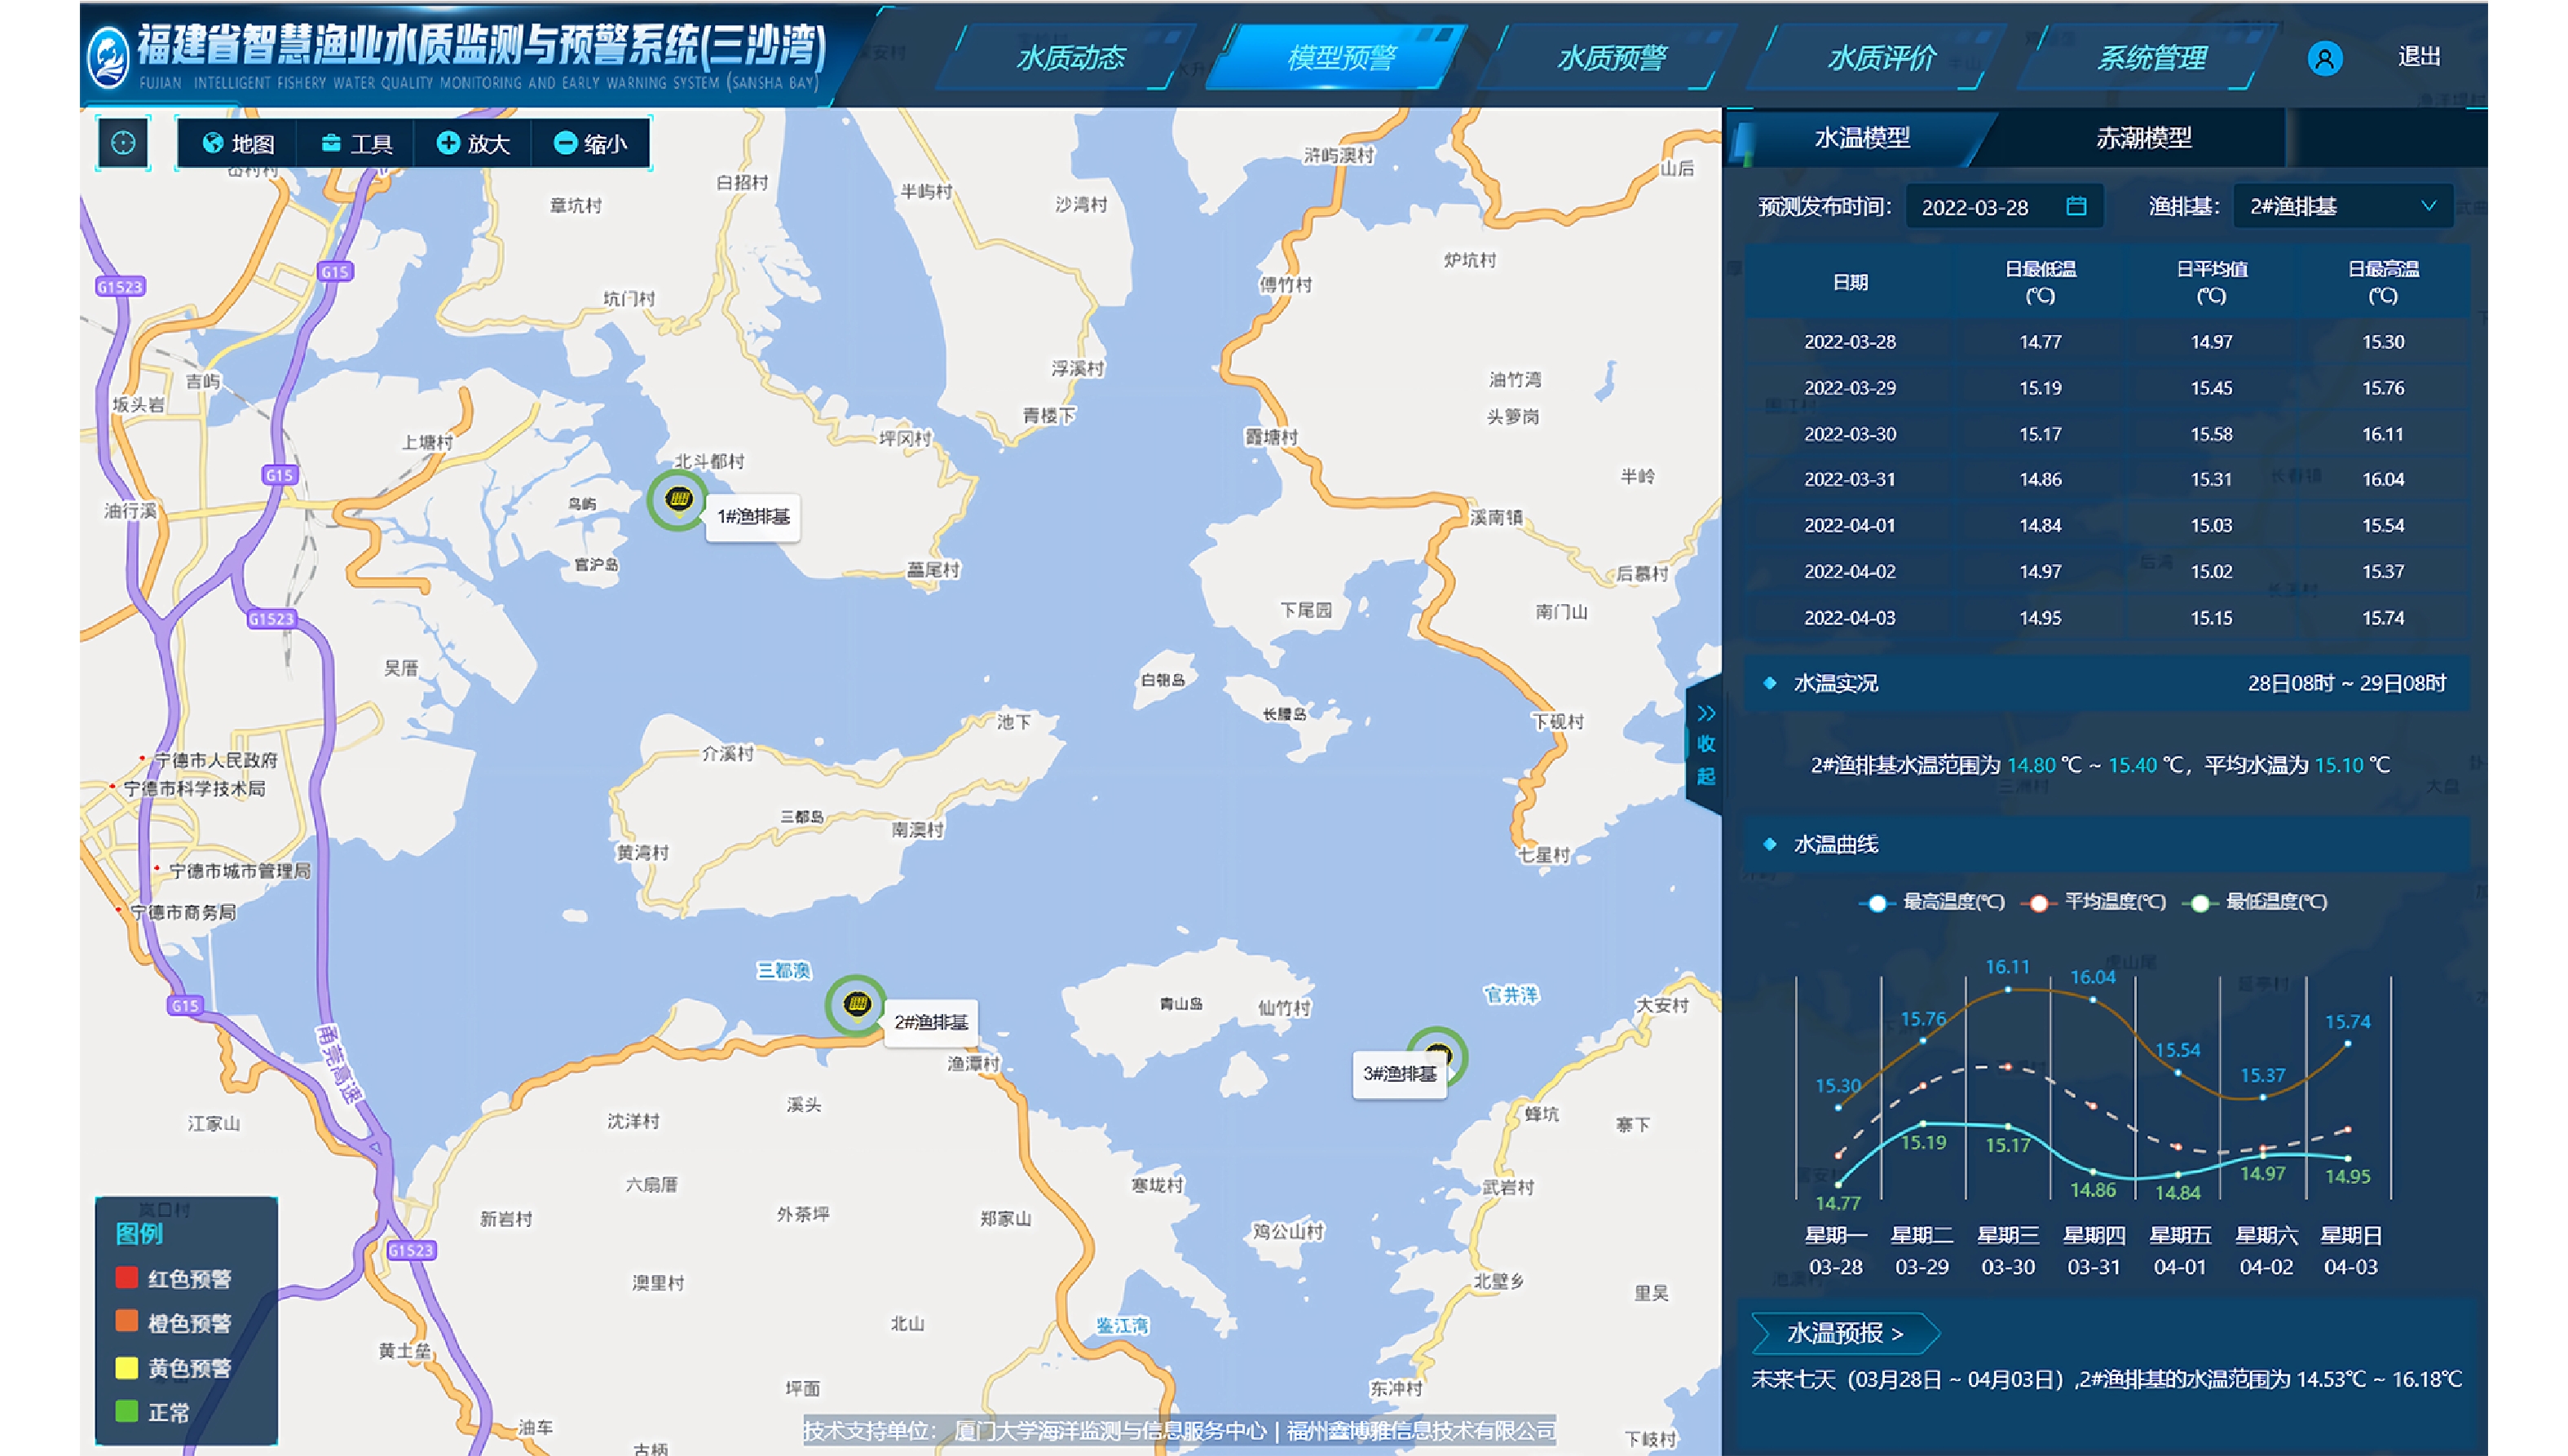
图 6 基于差分回归(DR)与可迁移长短期记忆网络(TLSTM)集成的DR-TLSTM模型应用于三沙湾水温预警预报业务化的信息系统界面
Fig. 6 Operational information system interface based on water temperature early warning and forecast in the Sansha Bay by DR-TLSTM model based on differential regression (DR) and transferable long short-term memory (TLSTM)
表 1 长短期记忆网络(LSTM)模型结构和数学表达式
Tab. 1 Structures and mathematical expressions of long short-term memory (LSTM) model
结构 数学表达式 输入门 $ {i}_{t}=\sigma \left({W}_{i}\cdot \left[{h}_{t-1},{x}_{t}\right]+{b}_{i}\right) $ 遗忘门 $ {f}_{t}=\sigma \left({W}_{f}\cdot \left[{h}_{t-1},{x}_{t}\right]+{b}_{f}\right) $ 输出门 $ {o}_{t}=\sigma \left({W}_{o}\cdot \left[{h}_{t-1},{x}_{t}\right]+{b}_{o}\right) $ 临时记忆单元 ${\widehat{C} }_{t}=\mathrm{tanh}\left({W}_{c}\cdot \left[{h}_{t-1},{x}_{t}\right]+{b}_{c}\right)$ 记忆单元 $ {C}_{t}={f}_{t}\odot {C}_{t-1}+{i}_{t}\odot {\widehat{C}}_{t} $ 隐藏单元 $ {h}_{t}={o}_{t}\odot \mathrm{t}\mathrm{a}\mathrm{n}\mathrm{h}\left({C}_{t}\right) $ 注:式中,$ {i}_{t} $为输入门;$ {f}_{t} $为遗忘门;$ {o}_{t} $为输出门;$ {\widehat{C}}_{t} $为t时刻临时记忆单元的输出;$ {C}_{t} $为t时刻记忆单元的输出;$ {h}_{t} $为t时刻隐藏单元的输出;$ {x}_{t} $为t时刻的输入数据;$ \sigma $为Sigmoid激活函数;$ \mathrm{t}\mathrm{a}\mathrm{n}\mathrm{h} $为双曲正切激活函数;$ {W}_{i} $、$ {W}_{f} $、$ {W}_{c} $、$ {W}_{o} $为权重矩阵;$ {b}_{i} $、$ {b}_{f} $、$ {b}_{c} $、$ {b}_{o} $为偏置向量;$ \odot $为逐元素点积运算。  下载: 导出CSV
表 2 长短期记忆网络(LSTM)模型主要参数和设定值
Tab. 2 Main parameters and set values of long short-term memory (LSTM) model
主要参数 设定值 LSTM层1神经元个数 48 正则化层1正则化系数 0.2 LSTM层2神经元个数 32 正则化层2正则化系数 0.2 损失函数 MSE 优化器 Adam 批处理大小 32 迭代轮次 150 注:MSE为均方误差,Adam为基于适应性低阶矩估计的一阶梯度优化算法结果。
下载: 导出CSV
表 3 三沙湾水温预警等级的划分
Tab. 3 Classification of water temperature warning levels in the Sansha Bay
温度 T<10℃ 10℃≤T<12℃ 12℃≤T<14℃ 14℃≤T≤28℃ 28℃<T≤30℃ 30℃<T≤32℃ T>32℃ 等级 红色低温 橙色低温 黄色低温 正常 黄色高温 橙色高温 红色高温
下载: 导出CSV
表 4 迁移学习测试时100次重复实验的平均值统计
Tab. 4 Statistics of the means of 100 replicates in transfer learning test
预测天数 评价指标 目标域LSTM模型 TLSTM模型(未微调) TLSTM模型 最高温 最低温 最高温 最低温 最高温 最低温 第1天 RMSE/℃ 5.42 5.69 0.42 0.31 0.38 0.28 MAE/℃ 5.30 5.54 0.36 0.28 0.35 0.25 R2 0.823 0.858 0.990 0.994 0.991 0.995 第2天 RMSE/℃ 5.57 5.89 0.52 0.39 0.47 0.34 MAE/℃ 5.45 5.72 0.43 0.33 0.43 0.30 R2 0.837 0.833 0.968 0.986 0.968 0.987 第3天 RMSE/℃ 5.74 6.02 0.62 0.47 0.57 0.43 MAE/℃ 5.61 5.87 0.52 0.40 0.51 0.37 R2 0.795 0.812 0.931 0.971 0.931 0.971 第4天 RMSE/℃ 5.96 6.17 0.75 0.57 0.68 0.52 MAE/℃ 5.84 6.02 0.61 0.46 0.61 0.44 R2 0.740 0.805 0.884 0.950 0.886 0.951 第5天 RMSE/℃ 6.22 6.37 0.84 0.64 0.76 0.59 MAE/℃ 6.09 6.22 0.69 0.52 0.68 0.50 R2 0.671 0.795 0.834 0.932 0.839 0.933 第6天 RMSE/℃ 6.42 6.53 0.91 0.71 0.83 0.65 MAE/℃ 6.30 6.38 0.75 0.58 0.75 0.56 R2 0.665 0.760 0.783 0.913 0.794 0.914 第7天 RMSE/℃ 6.61 6.70 0.97 0.79 0.88 0.73 MAE/℃ 6.49 6.54 0.80 0.65 0.81 0.64 R2 0.653 0.749 0.737 0.882 0.759 0.884
下载: 导出CSV
表 5 变权组合测试时100次重复实验的平均值统计
Tab. 5 Statistics of the means of 100 replicates in variable-weight combination test
预测天数 评价指标 TLSTM模型 纯差分回归模型 混差分回归模型 DR-TLSTM集成模型 最高温 最低温 最高温 最低温 最高温 最低温 最高温 最低温 第1天 RMSE/℃ 0.38 0.28 0.16 0.14 0.15 0.15 0.13 0.13 MAE/℃ 0.35 0.25 0.12 0.11 0.11 0.11 0.11 0.11 R2 0.991 0.995 0.994 0.996 0.995 0.995 0.995 0.996 第2天 RMSE/℃ 0.47 0.34 0.30 0.25 0.31 0.25 0.26 0.22 MAE/℃ 0.43 0.30 0.23 0.30 0.22 0.17 0.22 0.18 R2 0.968 0.987 0.978 0.989 0.978 0.989 0.978 0.989 第3天 RMSE/℃ 0.57 0.43 0.45 0.37 0.48 0.37 0.39 0.33 MAE/℃ 0.51 0.37 0.34 0.29 0.33 0.26 0.33 0.27 R2 0.931 0.971 0.946 0.975 0.947 0.975 0.947 0.975 第4天 RMSE/℃ 0.68 0.52 0.60 0.48 0.63 0.48 0.51 0.44 MAE/℃ 0.61 0.44 0.46 0.38 0.43 0.35 0.43 0.36 R2 0.886 0.951 0.902 0.956 0.906 0.956 0.905 0.956 第5天 RMSE/℃ 0.76 0.59 0.71 0.57 0.74 0.57 0.60 0.51 MAE/℃ 0.68 0.50 0.55 0.47 0.53 0.44 0.52 0.43 R2 0.839 0.933 0.863 0.939 0.870 0.941 0.867 0.940 第6天 RMSE/℃ 0.83 0.65 0.81 0.67 0.83 0.67 0.68 0.59 MAE/℃ 0.75 0.56 0.66 0.58 0.63 0.54 0.62 0.52 R2 0.794 0.914 0.822 0.917 0.834 0.922 0.831 0.921 第7天 RMSE/℃ 0.88 0.73 0.93 0.79 0.95 0.79 0.77 0.69 MAE/℃ 0.81 0.64 0.77 0.68 0.74 0.65 0.71 0.63 R2 0.759 0.884 0.775 0.884 0.793 0.889 0.791 0.890
下载: 导出CSV
表 6 突变点测试时100次重复实验的平均值统计
Tab. 6 Statistics of the means of 100 replicates in sudden change point prediction test
预测天数 评价指标 TLSTM模型 纯差分回归模型 混差分回归模型 DR-TLSTM集成模型 最高温 最低温 最高温 最低温 最高温 最低温 最高温 最低温 第1天 RMSE/℃ 0.44 0.29 0.42 0.32 0.40 0.34 0.35 0.29 MAE/℃ 0.40 0.39 0.36 0.30 0.33 0.29 0.33 0.29 R2 0.992 0.992 0.995 0.993 0.996 0.993 0.996 0.994 第2天 RMSE/℃ 0.71 0.61 0.75 0.63 0.78 0.63 0.65 0.57 MAE/℃ 0.66 0.60 0.58 0.60 0.56 0.52 0.57 0.56 R2 0.940 0.935 0.954 0.951 0.954 0.951 0.954 0.951 第3天 RMSE/℃ 1.07 0.77 1.02 0.67 1.08 0.67 0.89 0.61 MAE/℃ 0.95 0.72 0.80 0.75 0.76 0.69 0.76 0.71 R2 0.798 0.705 0.806 0.747 0.808 0.747 0.807 0.747 第4天 RMSE/℃ 1.31 0.95 1.01 0.81 1.06 0.81 0.87 0.74 MAE/℃ 1.13 0.95 0.85 0.92 0.80 0.85 0.80 0.87 R2 0.729 0.693 0.782 0.780 0.785 0.781 0.784 0.781 第5天 RMSE/℃ 1.32 0.95 1.18 0.99 1.23 0.99 1.01 0.90 MAE/℃ 1.04 0.94 0.89 0.95 0.85 0.88 0.84 0.88 R2 0.666 0.672 0.788 0.729 0.794 0.731 0.792 0.730 第6天 RMSE/℃ 1.33 1.00 1.19 1.07 1.23 1.07 1.01 0.95 MAE/℃ 1.03 1.05 1.00 1.07 0.94 1.00 0.94 0.98 R2 0.693 0.691 0.712 0.694 0.722 0.698 0.720 0.698 第7天 RMSE/℃ 1.23 1.03 1.31 1.11 1.34 1.12 1.09 0.98 MAE/℃ 1.07 1.06 1.02 1.02 0.97 0.97 0.95 0.95 R2 0.630 0.450 0.636 0.526 0.651 0.529 0.649 0.530
下载: 导出CSV
表 7 基于差分回归(DR)与可迁移长短期记忆网络(TLSTM)集成的DR-TLSTM模型对三沙湾水温预警准确率的统计结果
Tab. 7 Statistical results of DR-TLSTM model based on differential regression (DR) and transferable long short-term memory (TLSTM) for water temperature early warning accuracy in the Sansha Bay
设备编号 第1天 第2天 第3天 第4天 第5天 第6天 第7天 1#渔排基 96.27% 94.03% 91.04% 88.06% 84.33% 82.84% 82.09% 2#渔排基 95.52% 94.03% 91.04% 88.06% 85.82% 83.58% 80.60% 3#渔排基 97.76% 95.52% 91.79% 91.79% 88.06% 87.31% 79.10%
下载: 导出CSV
-
[1] 田梓杨, 黄洪辉, 齐占会, 等. 大鹏澳海湾养殖生态环境的化学计量分析[J]. 中国水产科学, 2012, 19(5): 881−888.Tian Ziyang, Huang Honghui, Qi Zhanhui, et al. Using chemometric methods to study the mariculture eco-environment in Dapeng Cove, China[J]. Journal of Fishery Sciences of China, 2012, 19(5): 881−888. [2] 程建新, 肖佳媚, 陈明茹, 等. 兴化湾海湾生态系统退化评价[J]. 厦门大学学报(自然科学版), 2012, 51(5): 944−950.Cheng Jianxin, Xiao Jiamei, Chen Mingru, et al. Ecosystem degradation assessment of Xinghua Bay[J]. Journal of Xiamen University (Natural Science), 2012, 51(5): 944−950. [3] Rabalais N N. Human impacts on fisheries across the land-sea interface[J]. Proceedings of the National Academy of Sciences of the United States of America, 2015, 112(26): 7892−7893. doi: 10.1073/pnas.1508766112 [4] 肖应凯, 刘卫国, 马云麒, 等. 鹿角珊瑚δ18O, Sr/Ca和Mg/Ca比值与海水表面温度的相关性研究——不同海水温度下的珊瑚养殖实验[J]. 中国科学: 地球科学, 2014, 57(5): 1048−1060. doi: 10.1007/s11430-013-4710-6Xiao Yingkai, Liu Weiguo, Ma Yunqi, et al. Correlation between δ18O, Sr/Ca and Mg/Ca of coral Acropora and seawater temperature from coral culture experiments[J]. Science China Earth Sciences, 2014, 57(5): 1048−1060. doi: 10.1007/s11430-013-4710-6 [5] 胡石建, 李诗翰. 海洋热浪研究进展与展望[J]. 地球科学进展, 2022, 37(1): 51−64.Hu Shijian, Li Shihan. Progress and prospect of marine heatwave study[J]. Advances in Earth Science, 2022, 37(1): 51−64. [6] Biswas B K, Svirezhev Y M, Bala B K. A model to predict climate-change impact on fish catch in the world oceans[J]. IEEE Transactions on Systems, Man, and Cybernetics-Part A: Systems and Humans, 2005, 35(6): 773−783. doi: 10.1109/TSMCA.2005.851345 [7] Gianelli I, Ortega L, Marín Y, et al. Evidence of ocean warming in Uruguay's fisheries landings: the mean temperature of the catch approach[J]. Marine Ecology Progress Series, 2019, 625: 115−125. doi: 10.3354/meps13035 [8] Wang Wenyu, Zhou Chenghu, Shao Quanqin, et al. Remote sensing of sea surface temperature and chlorophyll-a: implications for squid fisheries in the north-west Pacific Ocean[J]. International Journal of Remote Sensing, 2010, 31(17/18): 4515−4530. [9] Wheeland L J, Morgan M J. Age-specific shifts in Greenland halibut (Reinhardtius hippoglossoides) distribution in response to changing ocean climate[J]. ICES Journal of Marine Science, 2020, 77(1): 230−240. [10] Zisserson B, Cook A. Impact of bottom water temperature change on the southernmost snow crab fishery in the Atlantic Ocean[J]. Fisheries Research, 2017, 195: 12−18. doi: 10.1016/j.fishres.2017.06.009 [11] 卢峰本, 黄滢, 周启强, 等. 海水养殖的气象风险分析及预报[J]. 气象, 2006, 32(11): 113−117. doi: 10.7519/j.issn.1000-0526.2006.11.018Lu Fengben, Huang Ying, Zhou Qiqiang, et al. Meteorological risk analysis and forecast to mariculture production[J]. Meteorological Monthly, 2006, 32(11): 113−117. doi: 10.7519/j.issn.1000-0526.2006.11.018 [12] Xie Jiang, Zhang Jiyuan, Yu Jie, et al. An adaptive scale sea surface temperature predicting method based on deep learning with attention mechanism[J]. IEEE Geoscience and Remote Sensing Letters, 2020, 17(5): 740−744. doi: 10.1109/LGRS.2019.2931728 [13] Hochreiter S, Schmidhuber J. Long short-term memory[J]. Neural Computation, 1997, 9(8): 1735−1780. doi: 10.1162/neco.1997.9.8.1735 [14] 刘建伟, 宋志妍. 循环神经网络研究综述[J]. 控制与决策, 2022, 37(11): 2753−2768.Liu Jianwei, Song Zhiyan. Overview of recurrent neural networks[J]. Control and Decision, 2022, 37(11): 2753−2768. [15] Zhang Qin, Wang Hui, Dong Junyu, et al. Prediction of sea surface temperature using long short-term memory[J]. IEEE Geoscience and Remote Sensing Letters, 2017, 14(10): 1745−1749. doi: 10.1109/LGRS.2017.2733548 [16] Hou Siyun, Li Wen’gen, Liu Tianying, et al. D2CL: a dense dilated convolutional LSTM model for sea surface temperature prediction[J]. IEEE Journal of Selected Topics in Applied Earth Observations and Remote Sensing, 2021, 14: 12514−12523. doi: 10.1109/JSTARS.2021.3128577 [17] Yang Yuting, Dong Junyu, Sun Xin, et al. A CFCC-LSTM model for sea surface temperature prediction[J]. IEEE Geoscience and Remote Sensing Letters, 2018, 15(2): 207−211. doi: 10.1109/LGRS.2017.2780843 [18] 张昆. 基于深度学习的深海遥感技术研究[D]. 厦门: 厦门大学, 2019.Zhang Kun. Research on deep-ocean remote sensing by deep learning[D]. Xiamen: Xiamen University, 2019. [19] Kim M, Yang H, Kim J. Sea surface temperature and high water temperature occurrence prediction using a long short-term memory model[J]. Remote Sensing, 2020, 12(21): 3654. doi: 10.3390/rs12213654 [20] 李嘉康, 李其杰, 赵颖, 等. 基于CEEMD-BP神经网络的海温异常预测研究[J]. 数学的实践与认识, 2017, 47(24): 163−171.Li Jiakang, Li Qijie, Zhao Ying, et al. Sea surface temperature anomaly forecast research based on CEEMD-BP neural network[J]. Mathematics in Practice and Theory, 2017, 47(24): 163−171. [21] 董璐, 周天军. 20世纪太平洋海温变化中人为因子与自然因子贡献的模拟研究[J]. 海洋学报, 2014, 36(3): 48−60.Dong Lu, Zhou Tianjun. Contributions of natural and anthropogenic forcings to the twentieth-century Pacific sea surface temperature variability simulated by a climate system model[J]. Haiyang Xuebao, 2014, 36(3): 48−60. [22] 田远洋, 徐显涛, 彭安帮, 等. 训练数据量对LSTM网络学习性能影响分析[J]. 水文, 2022, 42(1): 29−34, 22.Tian Yuanyang, Xu Xiantao, Peng Anbang, et al. Effects of training data on the study performance of LSTM network[J]. Journal of China Hydrology, 2022, 42(1): 29−34, 22. [23] Zhuang Fuzhen, Qi Zhiyuan, Duan Keyu, et al. A comprehensive survey on transfer learning[J]. Proceedings of the IEEE, 2021, 109(1): 43−76. doi: 10.1109/JPROC.2020.3004555 [24] 黎英, 宋佩华. 迁移学习在医学图像分类中的研究进展[J]. 中国图象图形学报, 2022, 27(3): 672−686. doi: 10.11834/jig.210814Li Ying, Song Peihua. Review of transfer learning in medical image classification[J]. Journal of Image and Graphics, 2022, 27(3): 672−686. doi: 10.11834/jig.210814 [25] 张晓, 李业刚, 王栋, 等. 基于迁移学习的社交评论命名实体识别[J]. 计算机应用与软件, 2022, 39(1): 143−150.Zhang Xiao, Li Yegang, Wang Dong, et al. Social comment named entity recognition based on transfer learning[J]. Computer Applications and Software, 2022, 39(1): 143−150. [26] 王义刚, 宋志尧, 姜翠玲, 等. 福建省海湾数模与环境研究: 三沙湾[M]. 北京: 海洋出版社, 2009.Wang Yigang, Song Zhiyao, Jiang Cuiling, et al. Numerical Modeling and Environmental Study of Gulf in Fujian Province: Sansha Bay[M]. Beijing: China Ocean Press, 2009. [27] 厦门市地方志编纂委员会. 厦门市志[M]. 北京: 方志出版社, 2004.Xiamen Local Chronicle Compilation Committee. County Annals of Xiamen[M]. Beijing: Local Records Publishing House, 2004. [28] 欧阳俊峰. 福建沿海滩涂微型真核生物群落结构及对生物修复的响应[D]. 厦门: 集美大学, 2016.Ouyang Junfeng. Microeukaryotic community structure and response to bioremediation in intertidal mudflats of Fujian coast[D]. Xiamen: Jimei University, 2016. [29] 王翠, 郭晓峰, 方婧, 等. 闽浙沿岸流扩展范围的季节特征及其对典型海湾的影响[J]. 应用海洋学学报, 2018, 37(1): 1−8.Wang Cui, Guo Xiaofeng, Fang Jing, et al. Characteristics of seasonal spatial expansion of Fujian and Zhejiang Coastal Current and their bay effects[J]. Journal of Applied Oceanography, 2018, 37(1): 1−8. [30] Yu Yong, Si Xiaosheng, Hu Changhua, et al. A review of recurrent neural networks: LSTM cells and network architectures[J]. Neural Computation, 2019, 31(7): 1235−1270. doi: 10.1162/neco_a_01199 [31] Pan S J, Yang Qiang. A survey on transfer learning[J]. IEEE Transactions on Knowledge and Data Engineering, 2010, 22(10): 1345−1359. doi: 10.1109/TKDE.2009.191 [32] 福建省科学技术厅. 大黄鱼养殖[M]. 北京: 海洋出版社, 2004.Province Department of Science and Technology of Fujian. Breeding and farming of Pseudosciaena Crocea[M]. Beijing: China Ocean Press, 2004. [33] Yosinski J, Clune J, Bengio Y, et al. How transferable are features in deep neural networks?[C]//Proceedings of the 27th International Conference on Neural Information Processing Systems. Montreal: MIT Press, 2014. [34] 刘明, 王红蕾, 索良泽. 基于变权组合模型的中长期负荷概率密度预测[J]. 电力系统及其自动化学报, 2019, 31(7): 88−94. doi: 10.3969/j.issn.1003-8930.2019.07.014Liu Ming, Wang Honglei, Suo Liangze. Medium- and long-term load probability density forecasting based on variable weight combination model[J]. Proceedings of the CSU-EPSA, 2019, 31(7): 88−94. doi: 10.3969/j.issn.1003-8930.2019.07.014 [35] 康俊锋, 谭建林, 方雷, 等. XGBoost-LSTM变权组合模型支持下短期PM2.5浓度预测—以上海为例[J]. 中国环境科学, 2021, 41(9): 4016−4025.Kang Junfeng, Tan Jianlin, Fang Lei, et al. Short-term PM2.5 concentration prediction based on XGBoost and LSTM variable weight combination model: a case study of Shanghai[J]. China Environmental Science, 2021, 41(9): 4016−4025. [36] Benthuysen J A, Oliver E C J, Feng Ming, et al. Extreme marine warming across tropical Australia during austral summer 2015−2016[J]. Journal of Geophysical Research: Oceans, 2018, 123(2): 1301−1326. doi: 10.1002/2017JC013326 [37] 齐庆华, 蔡榕硕. 中国近海海表温度变化的极端特性及其气候特征研究[J]. 海洋学报, 2019, 41(7): 36−51.Qi Qinghua, Cai Rongshuo. Analysis on climate characteristics of sea surface temperature extremes in coastal China seas[J]. Haiyang Xuebao, 2019, 41(7): 36−51. -

计量
- 文章访问数: 484
- HTML全文浏览量: 223
- PDF下载量: 38
- 被引次数: 0
