

Tracking and forecasting method and numerical simulation of high-risk ice in cold wave weather
-
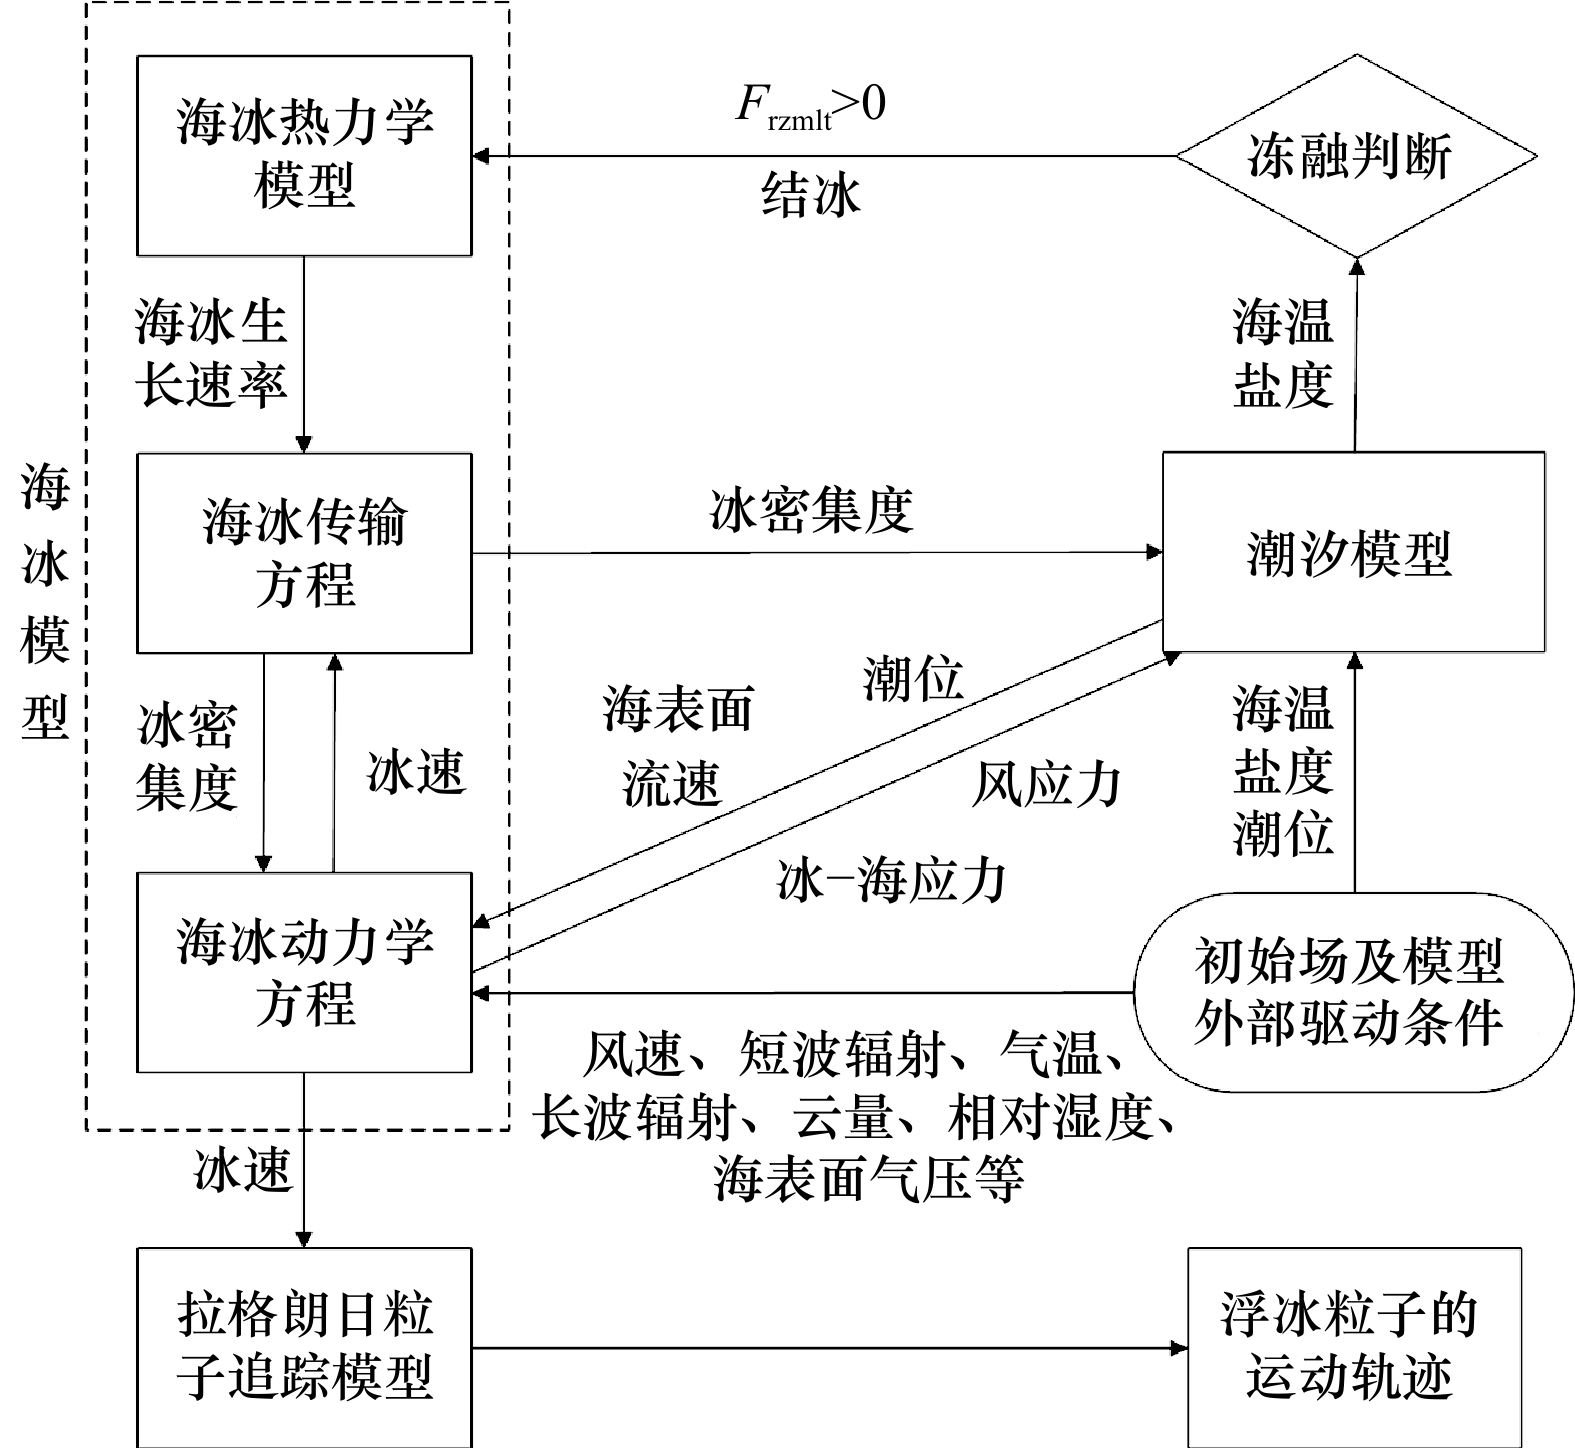
摘要: 为向拟建、在建和已建冰区所有冷源取水工程海域的海冰环境监测和动态风险预警提供技术支撑,本文构建了海冰–海洋耦合条件下的拉格朗日粒子追踪预测模型,并以辽东湾某核电站取水口为例,模拟并探讨了寒潮天气下高风险冰块在24 h、48 h和72 h的运移轨迹及其进入取水口的概率。结果表明,由于取水口的走向与流向和风向几乎垂直,因此在口门外随机释放的1 200个高风险冰块粒子中只有不到6%的粒子进入到取水口内。通过分区域标识粒子颜色,发现这些粒子多来自于靠近取水口300 m范围内。敏感性分析的结果表明,当释放粒子数量增至5倍时,结论不变。该项研究为冷源取水安全预警提供了一种新方法。
-
关键词:
- 辽东湾 /
- 冷源取水 /
- 海冰 /
- 耦合模型 /
- 拉格朗日粒子追踪模型
Abstract: To provide technical support for sea ice environmental monitoring and dynamic risk early warning in the sea area of the proposed, under construction and built cold source water intake project in cold regions, a Lagrangian particle tracking prediction model under the sea ice ocean coupling condition is constructed in this paper. Taking the water intake of a nuclear power station in the Liaodong Bay as an example, the migration trajectories of high-risk ice blocks in 24 h, 48 h and 72 h under cold wave weather and the probability of entering the water intake are simulated and discussed. The results show that since the direction of the water intake is almost perpendicular to the flow direction and wind direction, less than 6% of the 1200 high-risk ice particles randomly released outside the water intake enter the water intake. It is found that most of the particles come from within 300 m near the water intake by identifying the particle color in different regions. The results of sensitivity analysis showed that when the number of released particles increased to 5 times, the conclusion remained unchanged. This study provides a new method for safety early warning of cold source water intake.-
Key words:
- Liaodong Bay /
- cold source water intake /
- sea ice /
- coupling model /
- Lagrangian particle tracking model
-
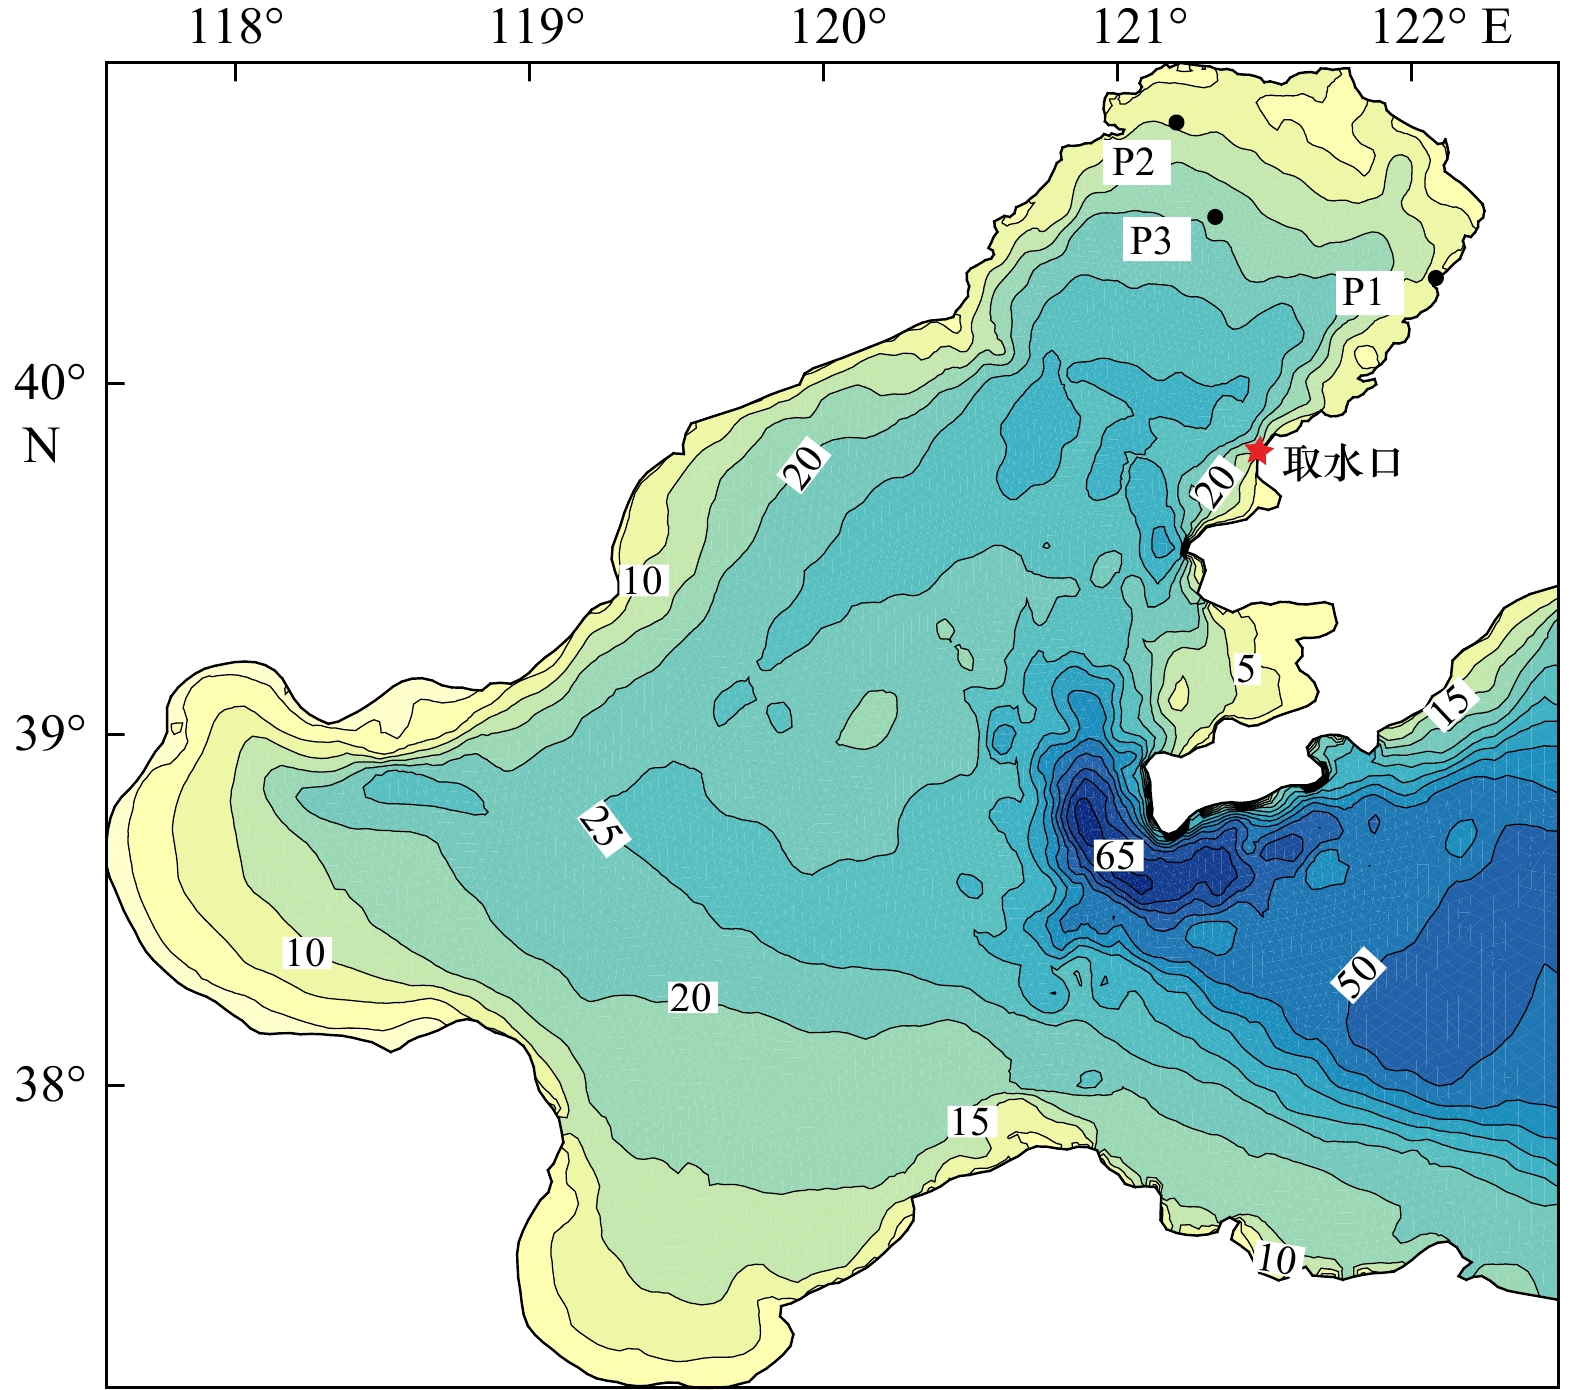
图 2 渤海水深(单位:m)与测点图
P1(40.30°N,122.08°E)为潮位测站,P2(40.75°N,121.20°E)为流速测站,P3(40.47°N,121.33°E)为JZ20-2平台冰速测站
Fig. 2 The water depth (unit: m) and measured stations in the Bohai Sea
P1 (40.30°N, 122.08°E) is the tidal level station, P2 (40.75°N, 121.20°E) is the tidal current station, and P3 (40.47°N, 121.33°E) is the ice velocity station of JZ20-2 platform
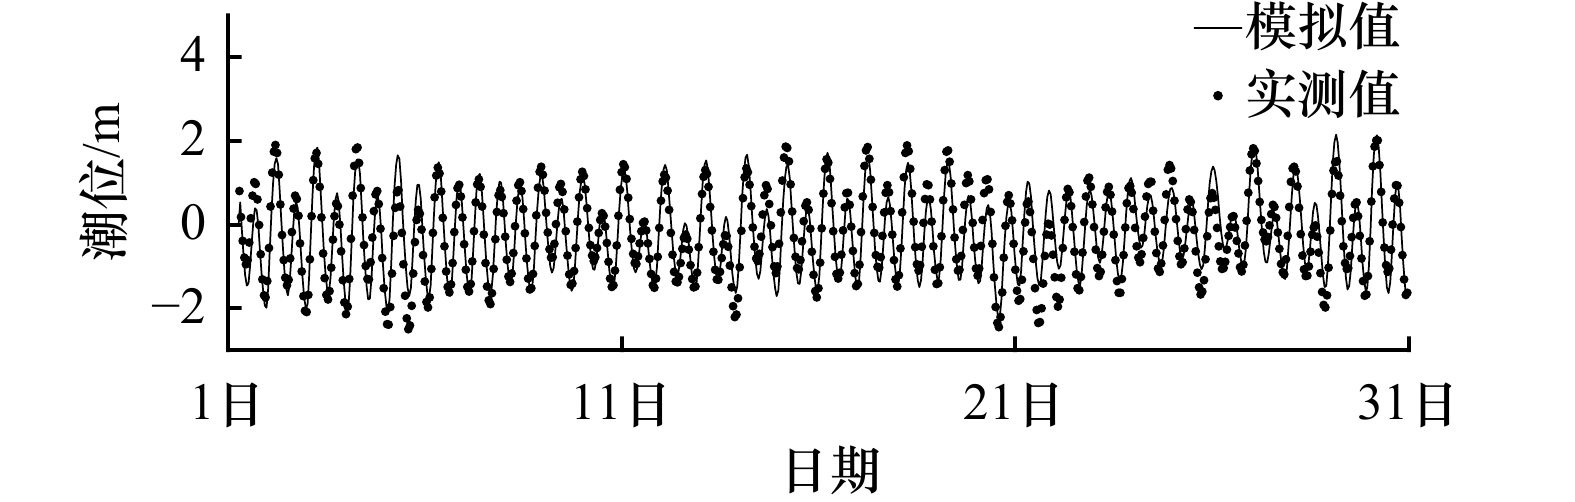
图 3 测点P1(40.30°N,122.08°E)潮位验证图
Fig. 3 Tidal level verification of Station P1 (40.30°N, 122.08°E)
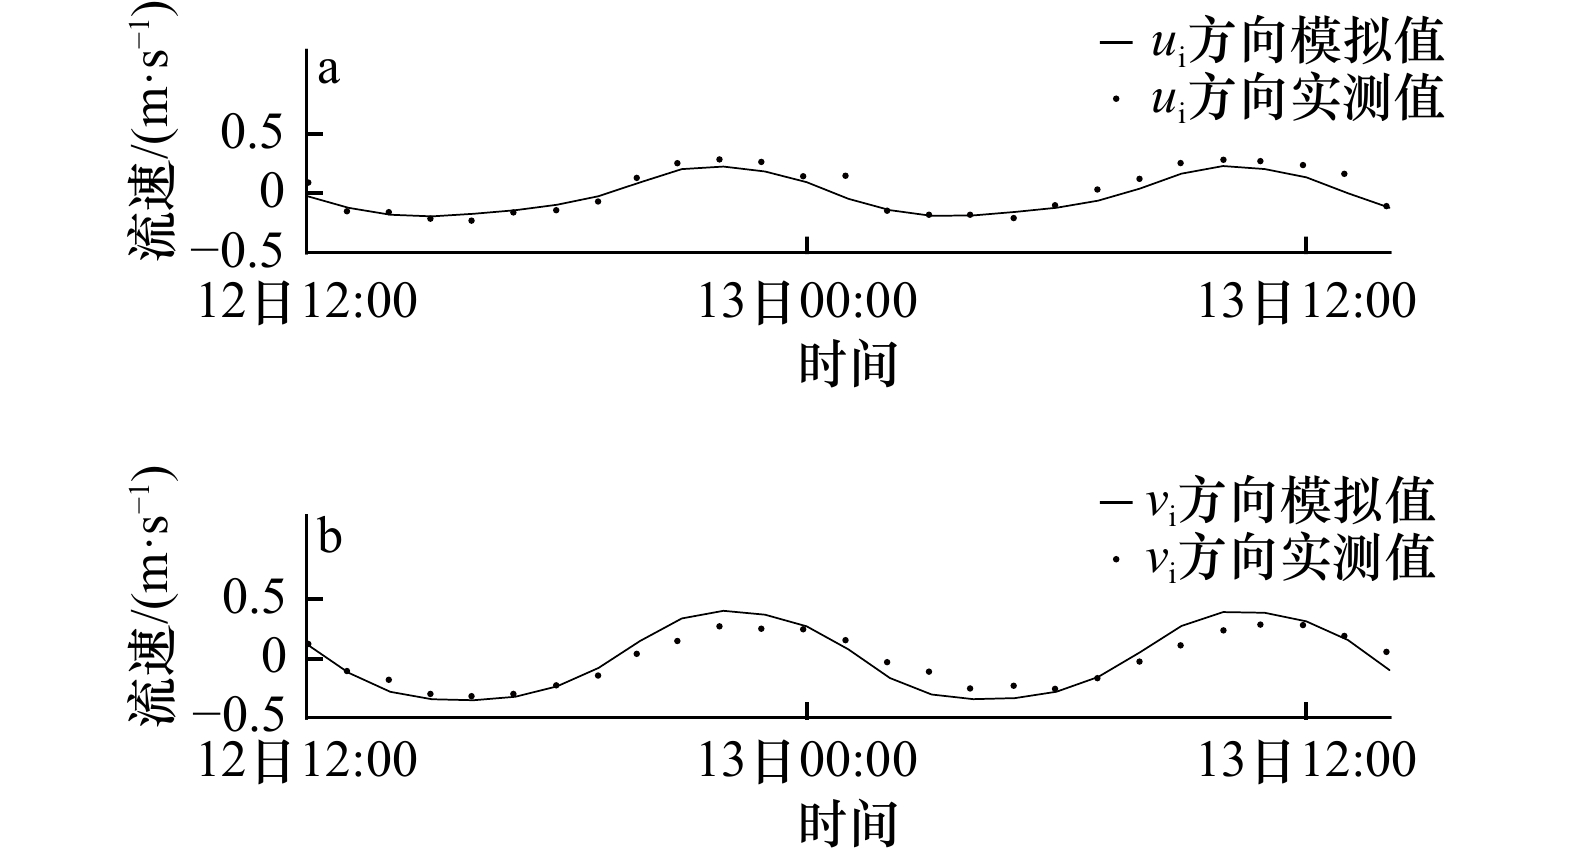
图 4 测点P2(40.75°N,121.20°E)流速模拟值与实测值对比
Fig. 4 The simulated and measured current velocity of Station P2 (40.75°N, 121.20°E)

图 5 2010年1月13日数值模拟的渤海海冰分布(橙色线围成的区域)与MODIS卫星遥感图像对比
Fig. 5 Comparison between simulated ice cover surrounded by orange lines of the Bohai Sea and MODIS satellite remote sensing image on January 13, 2010
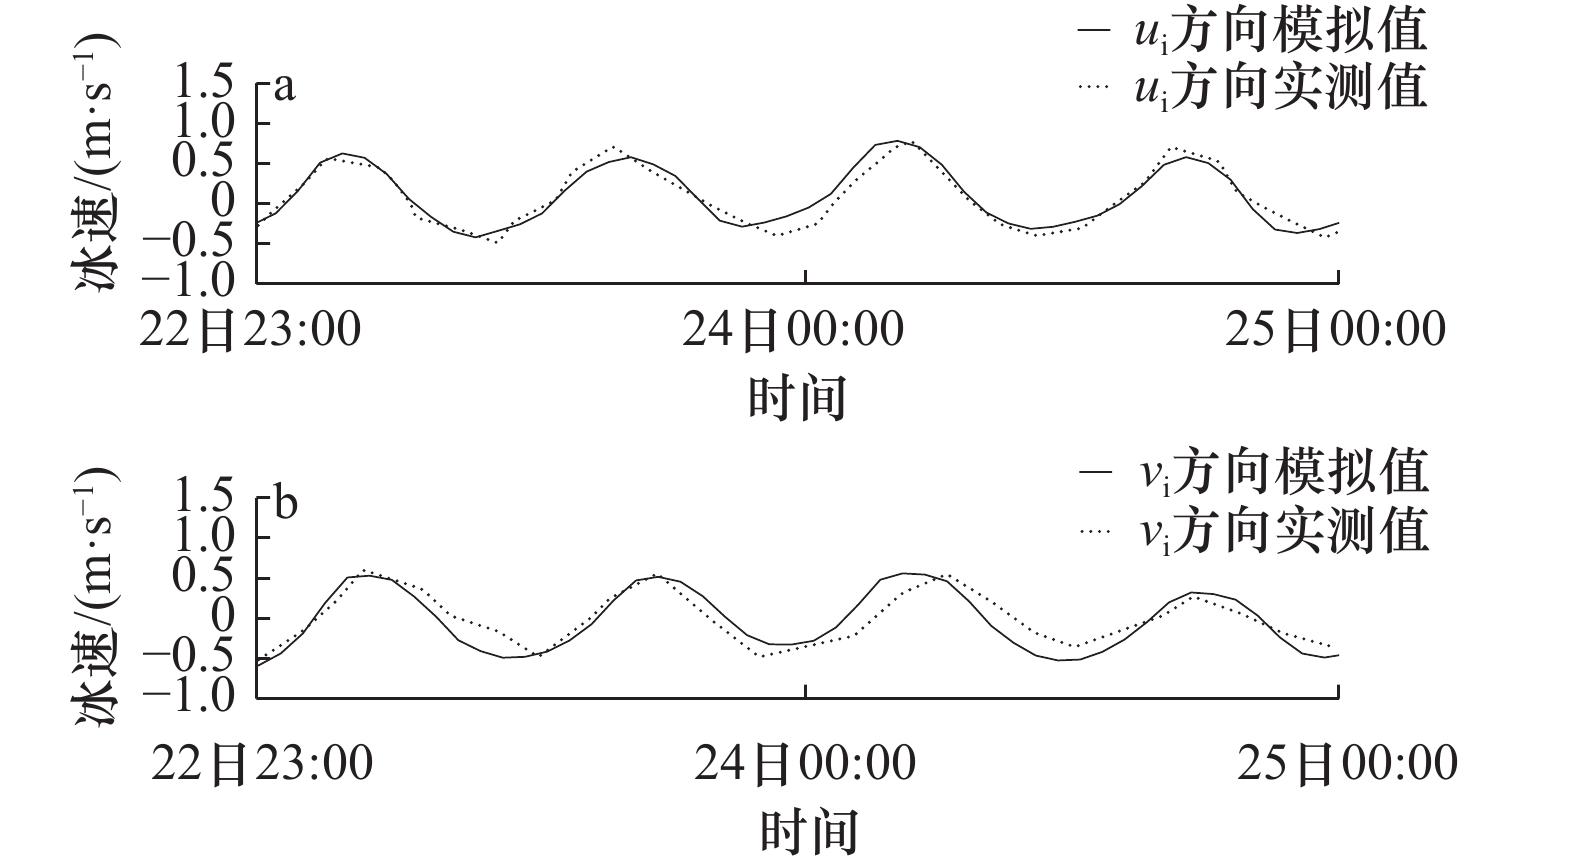
图 6 JZ20-2(P3)平台附近海域ui和vi方向冰速模拟值与实测值对比
Fig. 6 The simulated and measured values of ice velocity in the direction of ui and vi in the sea area near JZ20-2 (P3) platform
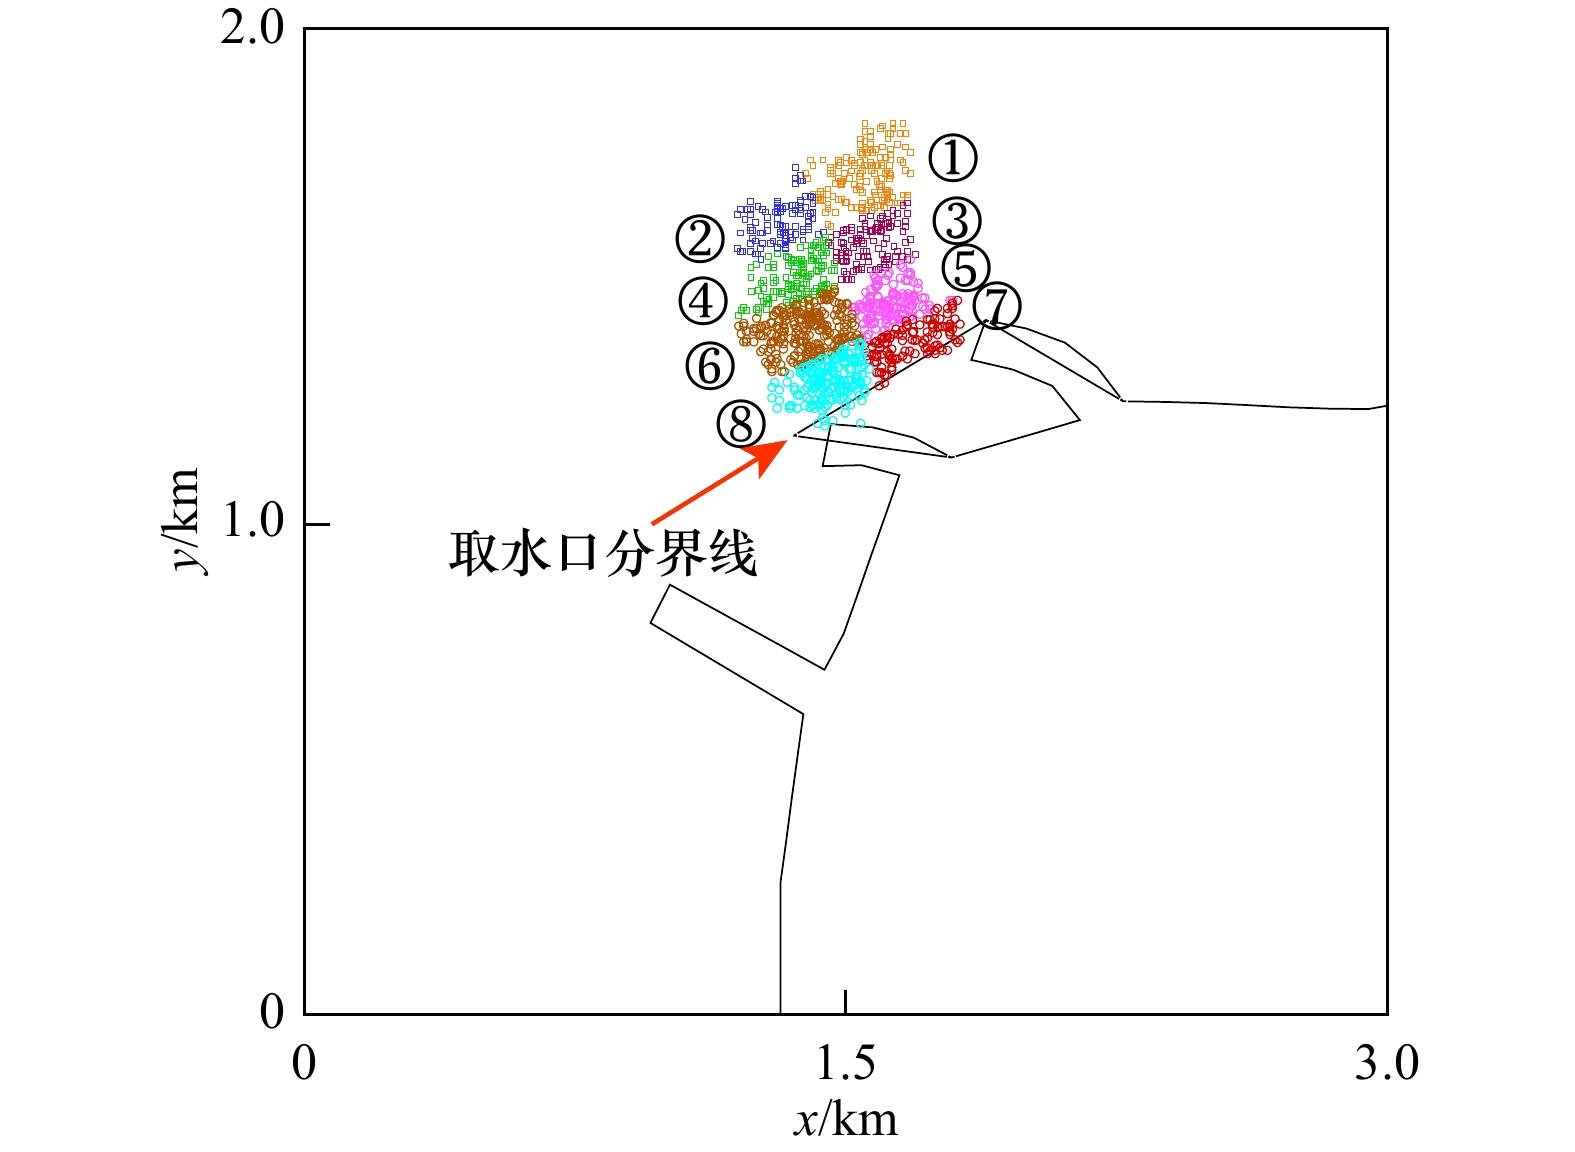
图 7 取水口位置判定线及初始时刻粒子分布
Fig. 7 Determination line of water intake inlet and particle distribution at initial time
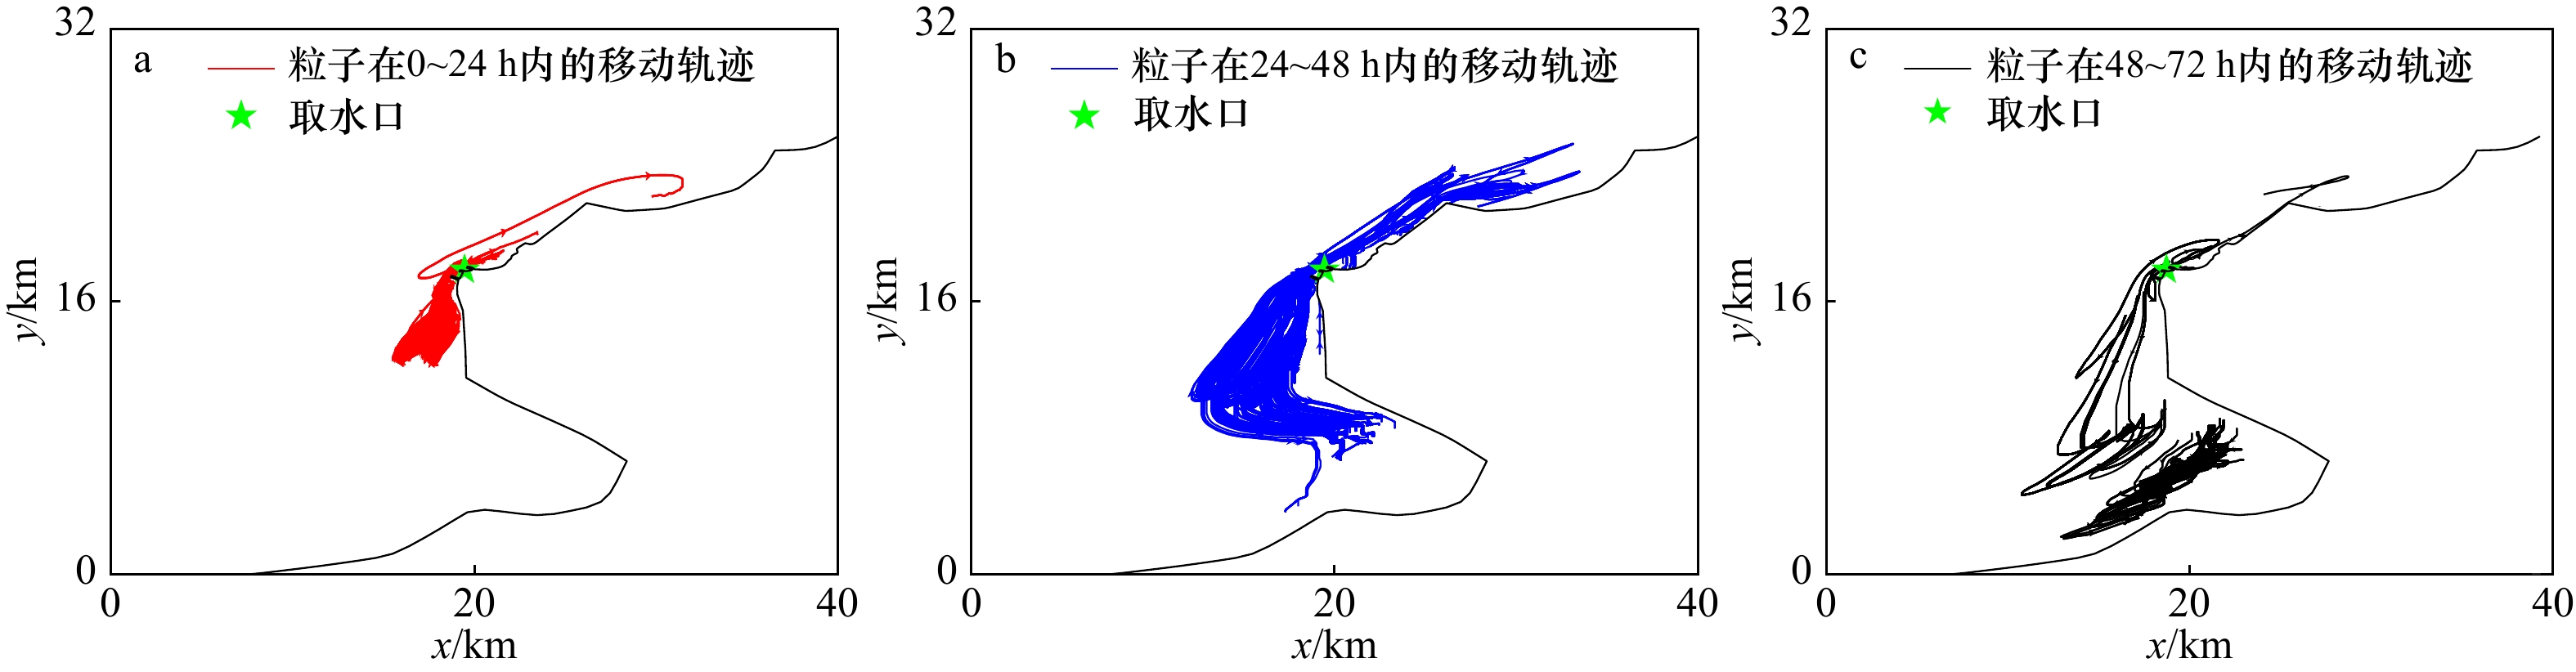
图 8 0~24 h(a)、24~48 h(b)和48~72 h(c)所有释放粒子的移动轨迹
Fig. 8 Trajectories of all released particles in 0−24 h (a), 24−48 h (b) and 48−72 h (c)
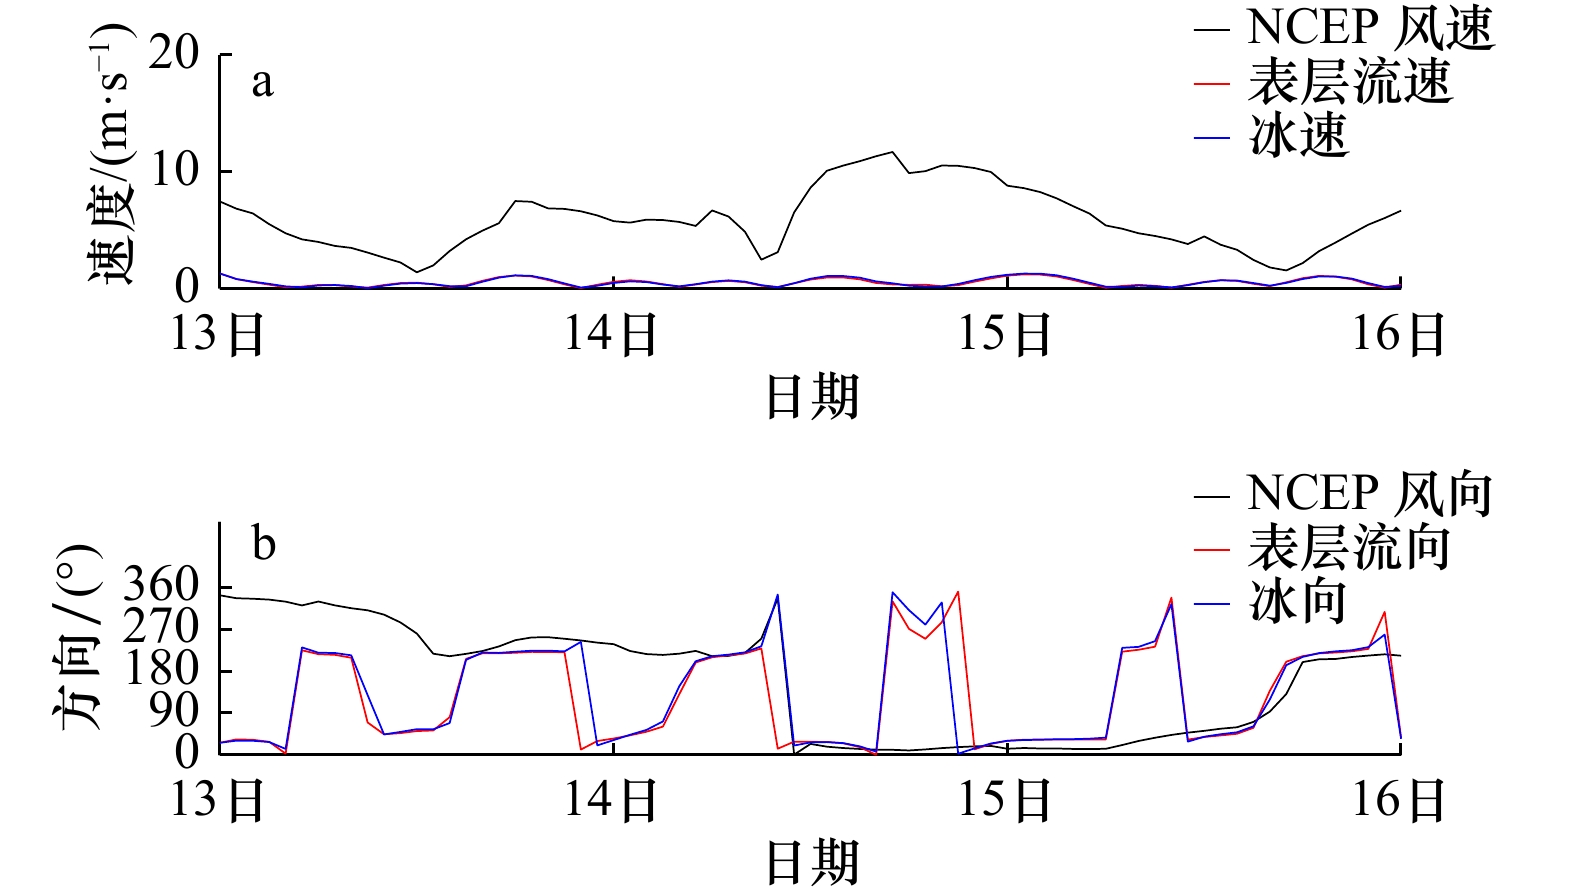
图 9 2010年1月13日0时至16日0时取水口外的风、流、冰情况
Fig. 9 Wind, current and ice velocity outside the water intake from 0:00 on January 13 to 0:00 on January 16, 2010

图 10 0~24 h(红线)、24~48 h(蓝线)和48~72 h(黑线)取水口内追踪粒子的移动轨迹
Fig. 10 Trajectories of particles in the water intake in 0–24 h (red line), 24–48 h (blue line) and 48–72 h (black line)

图 11 释放不同数量粒子进入取水口内的百分比
Fig. 11 Percentage of particles entering the water intake released in different quantities at the initial time
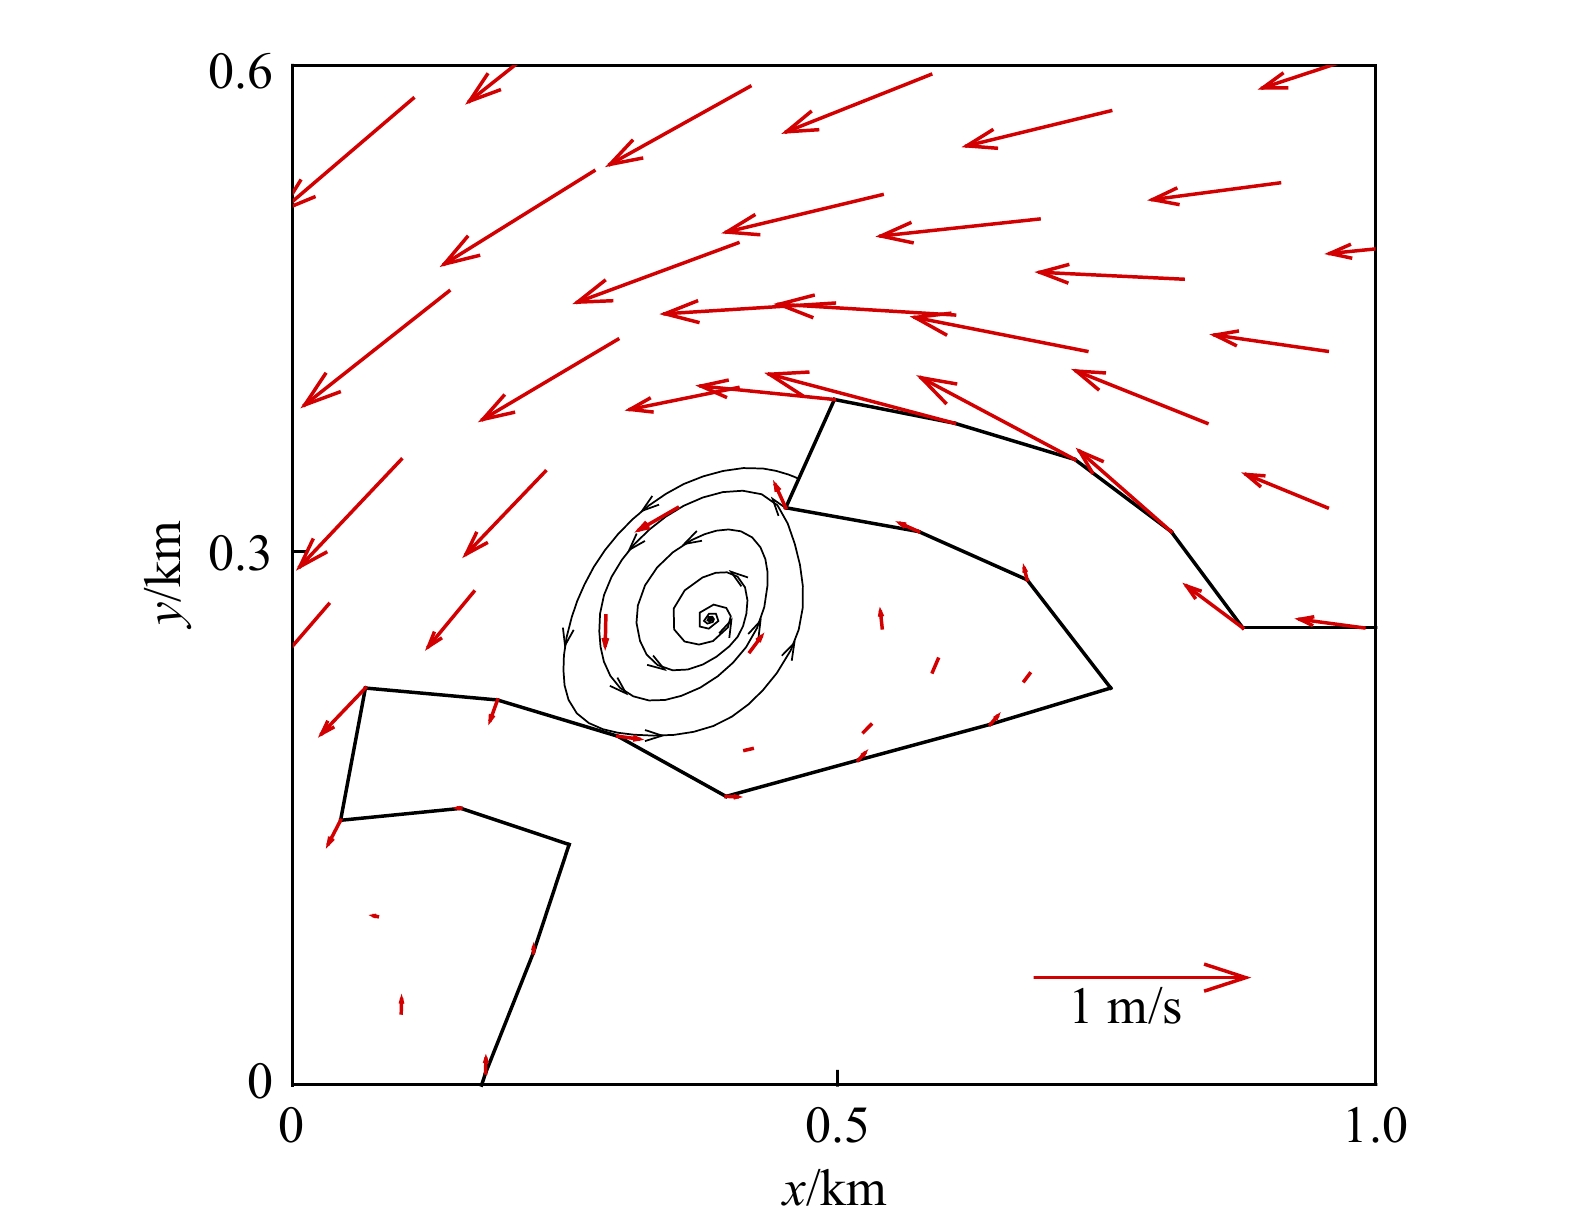
图 12 取水口附近粒子释放第10个小时的流场图
Fig. 12 The current field near the water intake at the 10th hour after the release of particles
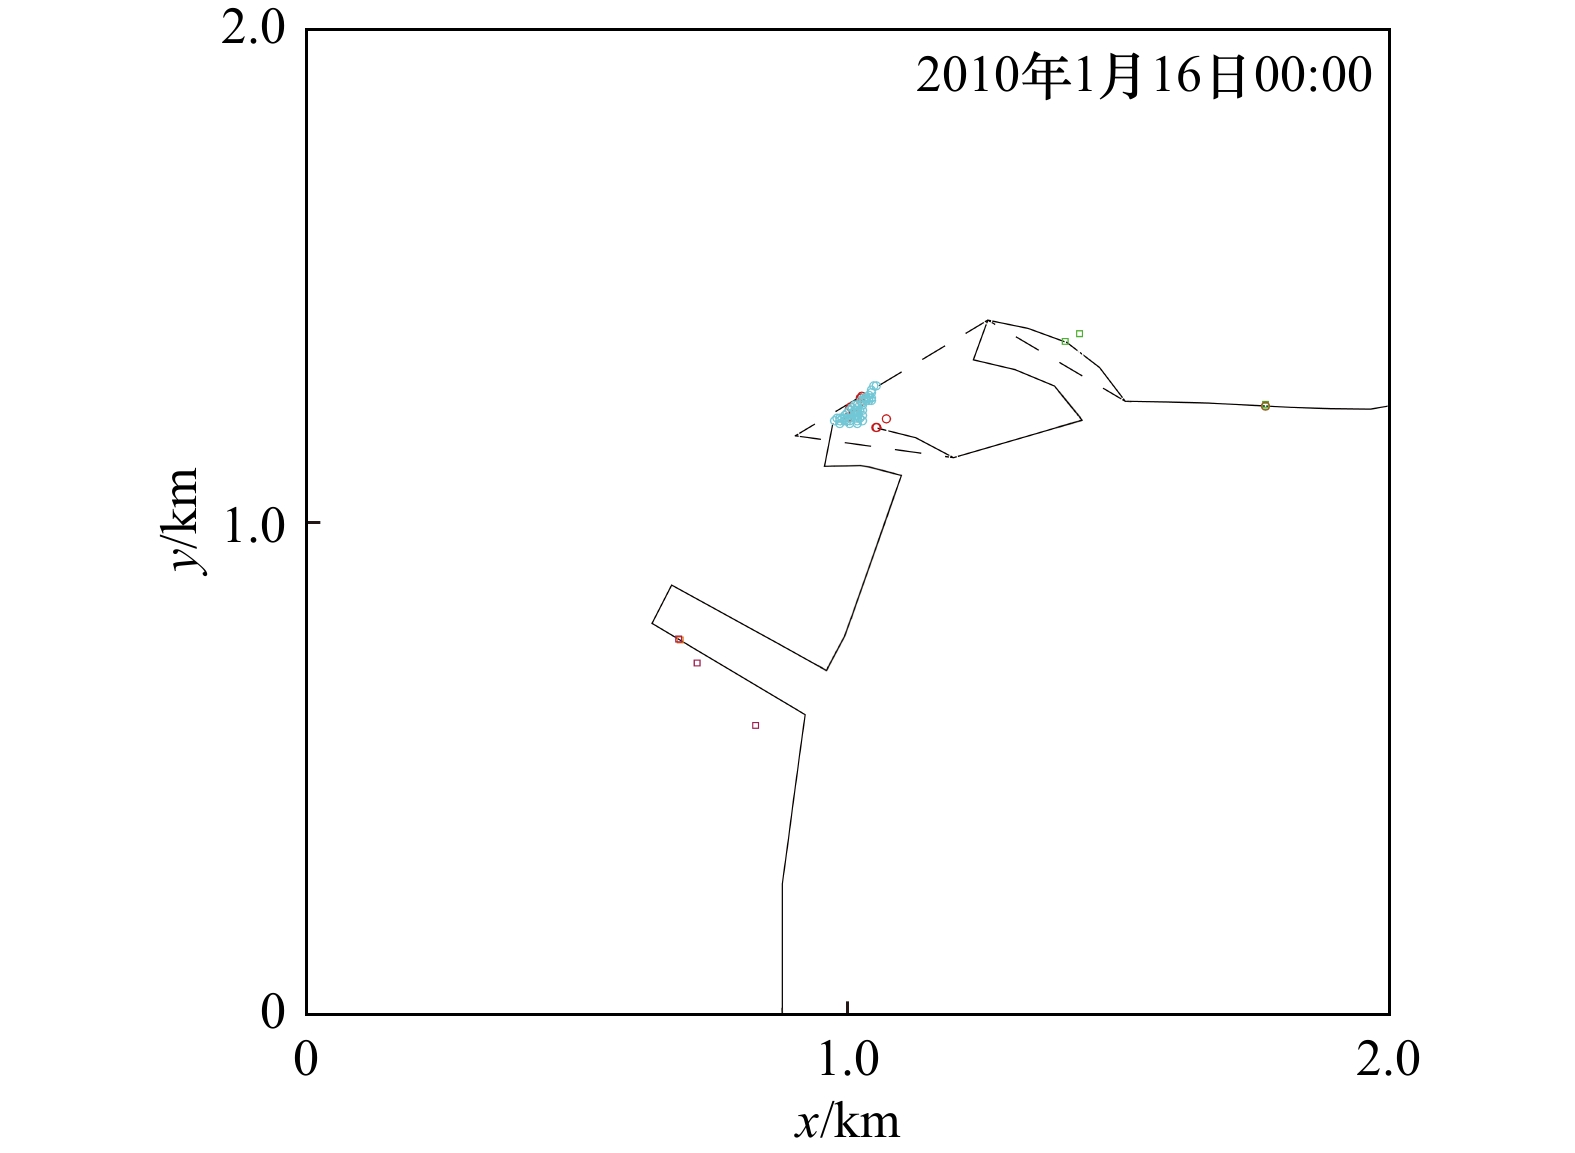
图 13 6 000个粒子结束时刻位置图
不同颜色代表图7所示的粒子初始位置
Fig. 13 Position of 6 000 particles at end time
Different colors represent the initial position of particles as shown in Fig. 7
表 1 模拟时段取水口外、内流速和冰速情况(单位: m/s)
Tab. 1 Current and ice velocity outside and inside the water intake during the period of simulation (unit: m/s)
类型 海表面流速
最大值海表面流速
平均值冰速
最大值冰速
平均值取水口外 1.27 0.51 1.27 0.53 取水口内 0.09 0.04 0.14 0.01 取水口内(考虑取水流量) 0.15 0.05 0.15 0.01  下载: 导出CSV
-
[1] 史文奇, 袁帅, 宋丽娜, 等. 针对红沿河核电站冷源取水海冰堵塞风险的数值模拟预警设计初探[J]. 海洋通报, 2020, 39(4): 439−446.Shi Wenqi, Yuan Shuai, Song Li’na, et al. A preliminary study on numerical simulation warning of the risk of ice blocking in water intake of the Hongyanhe Nuclear Power Plant[J]. Marine Science Bulletin, 2020, 39(4): 439−446. [2] 张培宣, 陈晓东, 孔帅, 等. 基于Hough变换原理的海冰厚度识别方法[J]. 海洋学报, 2022, 44(7): 161−169.Zhang Peixuan, Chen Xiaodong, Kong Shuai, et al. Research on sea ice thickness identification method based on Hough transform principle[J]. Haiyang Xuebao, 2022, 44(7): 161−169. [3] 刘煜, 唐茂宁, 隋俊鹏, 等. 工程海冰预报技术研究[J]. 中国科技成果, 2015(16): 35−36.Liu Yu, Tang Maoning, Sui Junpeng, et al. Research on engineering sea ice forecast technology[J]. China Science and Technology Achievements, 2015(16): 35−36. [4] 李志军, 王智群, 王庆凯, 等. 浮冰界面融化速率参数化方案的实验室研究[J]. 海洋学报, 2021, 43(7): 162−172.Li Zhijun, Wang Zhiqun, Wang Qingkai, et al. Laboratory study on parameterization of ice floe melt rate at ice-air and ice-water interfaces[J]. Haiyang Xuebao, 2021, 43(7): 162−172. [5] 阮国萍. 核电厂取水口堵塞原因分析与应对策略[J]. 核动力工程, 2015, 36(S1): 151−154.Ruan Guoping. Reason analysis and corresponding strategy for cooling water intake blockage at nuclear power plants[J]. Nuclear Power Engineering, 2015, 36(S1): 151−154. [6] 龙雪, 季顺迎, 王跃方. 红沿河核电站取水口海冰堆积特性的离散元分析[J]. 海洋工程, 2018, 36(3): 51−58, 68. doi: 10.16483/j.issn.1005-9865.2018.03.007Long Xue, Ji Shunying, Wang Yuefang. Analysis of sea ice pile-up features in water intakes of nuclear power station by discrete element method[J]. The Ocean Engineering, 2018, 36(3): 51−58, 68. doi: 10.16483/j.issn.1005-9865.2018.03.007 [7] 王延林, 张亚伟, 许宁, 等. 核电取水口海冰堆积问题的数值模拟[J]. 哈尔滨工程大学学报, 2019, 40(10): 1716−1722. doi: 10.11990/jheu.201804056Wang Yanlin, Zhang Yawei, Xu Ning, et al. Numerical simulation of sea ice pile-up on nuclear water intake structures[J]. Journal of Harbin Engineering University, 2019, 40(10): 1716−1722. doi: 10.11990/jheu.201804056 [8] Xing Fei, Wang Yaping, Wang H V. Tidal hydrodynamics and fine-grained sediment transport on the radial sand ridge system in the southern Yellow Sea[J]. Marine Geology, 2012, 291−294: 192−210. doi: 10.1016/j.margeo.2011.06.006 [9] 邹国良, 张庆河. 基于非静压方程的波浪与孔隙结构物相互作用模拟[J]. 天津大学学报(自然科学与工程技术版), 2016, 49(1): 65−72.Zou Guoliang, Zhang Qinghe. Simulation of wave interaction with porous structures based on non-hydrostatic equation[J]. Journal of Tianjin University (Science and Technology), 2016, 49(1): 65−72. [10] 王爽, 卢鹏, 祖永恒, 等. 冰脊间遮掩作用对冰−水拖曳力影响的实验研究[J]. 海洋学报, 2022, 44(7): 170−176.Wang Shuang, Lu Peng, Zu Yongheng, et al. Experimental study on the sheltering effect between ice ridges on ice-water drag force[J]. Haiyang Xuebao, 2022, 44(7): 170−176. [11] Chen Changsheng, Liu Hedong, Beardsley R C. An unstructured grid, finite-volume, three-dimensional, primitive equations ocean model: application to coastal ocean and estuaries[J]. Journal of Atmospheric and Oceanic Technology, 2003, 20(1): 159−186. doi: 10.1175/1520-0426(2003)020<0159:AUGFVT>2.0.CO;2 [12] Chen Changsheng, Beardsley R C, Cowles G. An unstructured grid, finite-volume coastal ocean model: FVCOM User Manual, Second Edition[J]. Oceanography, 2006, 19(1): 78–89. [13] Smagorinsky J. General circulation experiments with the primitive equations: I the basic experiment[J]. Monthly Weather Review, 1962, 91(3): 99−164. [14] Mellor G L, Yamada T. Development of a turbulence closure model for geophysical fluid problems[J]. Reviews of Geophysics, 1982, 20(4): 851−875. doi: 10.1029/RG020i004p00851 [15] Gao Guoping, Chen Changsheng, Qi Jianhua, et al. An unstructured-grid, finite-volume sea ice model: Development, validation, and application[J]. Journal of Geophysical Research: Oceans, 2011, 116(C8): C00D04. [16] Zhang Na, Wang Jin, Wu Yongsheng, et al. A modelling study of ice effect on tidal damping in the Bohai Sea[J]. Ocean Engineering, 2019, 173: 748−760. doi: 10.1016/j.oceaneng.2019.01.049 [17] Wu Jin. Wind-stress coefficients over sea surface from breeze to hurricane[J]. Journal of Geophysical Research: Oceans, 1982, 87(C12): 9704−9706. doi: 10.1029/JC087iC12p09704 [18] Georgas N. Large seasonal modulation of tides due to ice cover friction in a midlatitude estuary[J]. Journal of Physical Oceanography, 2012, 42(3): 352−369. doi: 10.1175/JPO-D-11-063.1 [19] 张庆河, 张娜. 渤海海冰演化的三维数值模型[J]. 天津大学学报(自然科学与工程技术版), 2013, 46(4): 333−341.Zhang Qinghe, Zhang Na. A three-dimensional numerical model of sea ice evolution in the Bohai Sea[J]. Journal of Tianjin University (Science and Technology), 2013, 46(4): 333−341. [20] Zhang Na, Wu Yongsheng, Zhang Qinghe. Detection of sea ice in sediment laden water using MODIS in the Bohai Sea: a CART decision tree method[J]. International Journal of Remote Sensing, 2015, 36(6): 1661−1674. doi: 10.1080/01431161.2015.1015658 [21] 王瑞学, 季顺迎, 岳前进, 等. 海冰动力学数值模拟中改进的PIC方法[J]. 计算力学学报, 2006, 23(4): 440−446. doi: 10.3969/j.issn.1007-4708.2006.04.011Wang Ruixue, Ji Shunying, Yue Qianjin, et al. Modified PIC method for numerical simulation of sea ice dynamics[J]. Chinese Journal of Computational Mechanics, 2006, 23(4): 440−446. doi: 10.3969/j.issn.1007-4708.2006.04.011 [22] Sorrel M, Moorthi S, Pan Hualu, et al. The NCEP climate forecast system reanalysis[J]. Bulletin of the American Meteorological Society, 2010, 91(8): 1015−1058. doi: 10.1175/2010BAMS3001.1 -

计量
- 文章访问数: 590
- HTML全文浏览量: 298
- PDF下载量: 49
- 被引次数: 0
