Qualitative comparative analysis on grain-size parameters of derived from graphic and moment methods: a case study of the surficial sediment of coastal beaches of Qiongzhou Strait
-
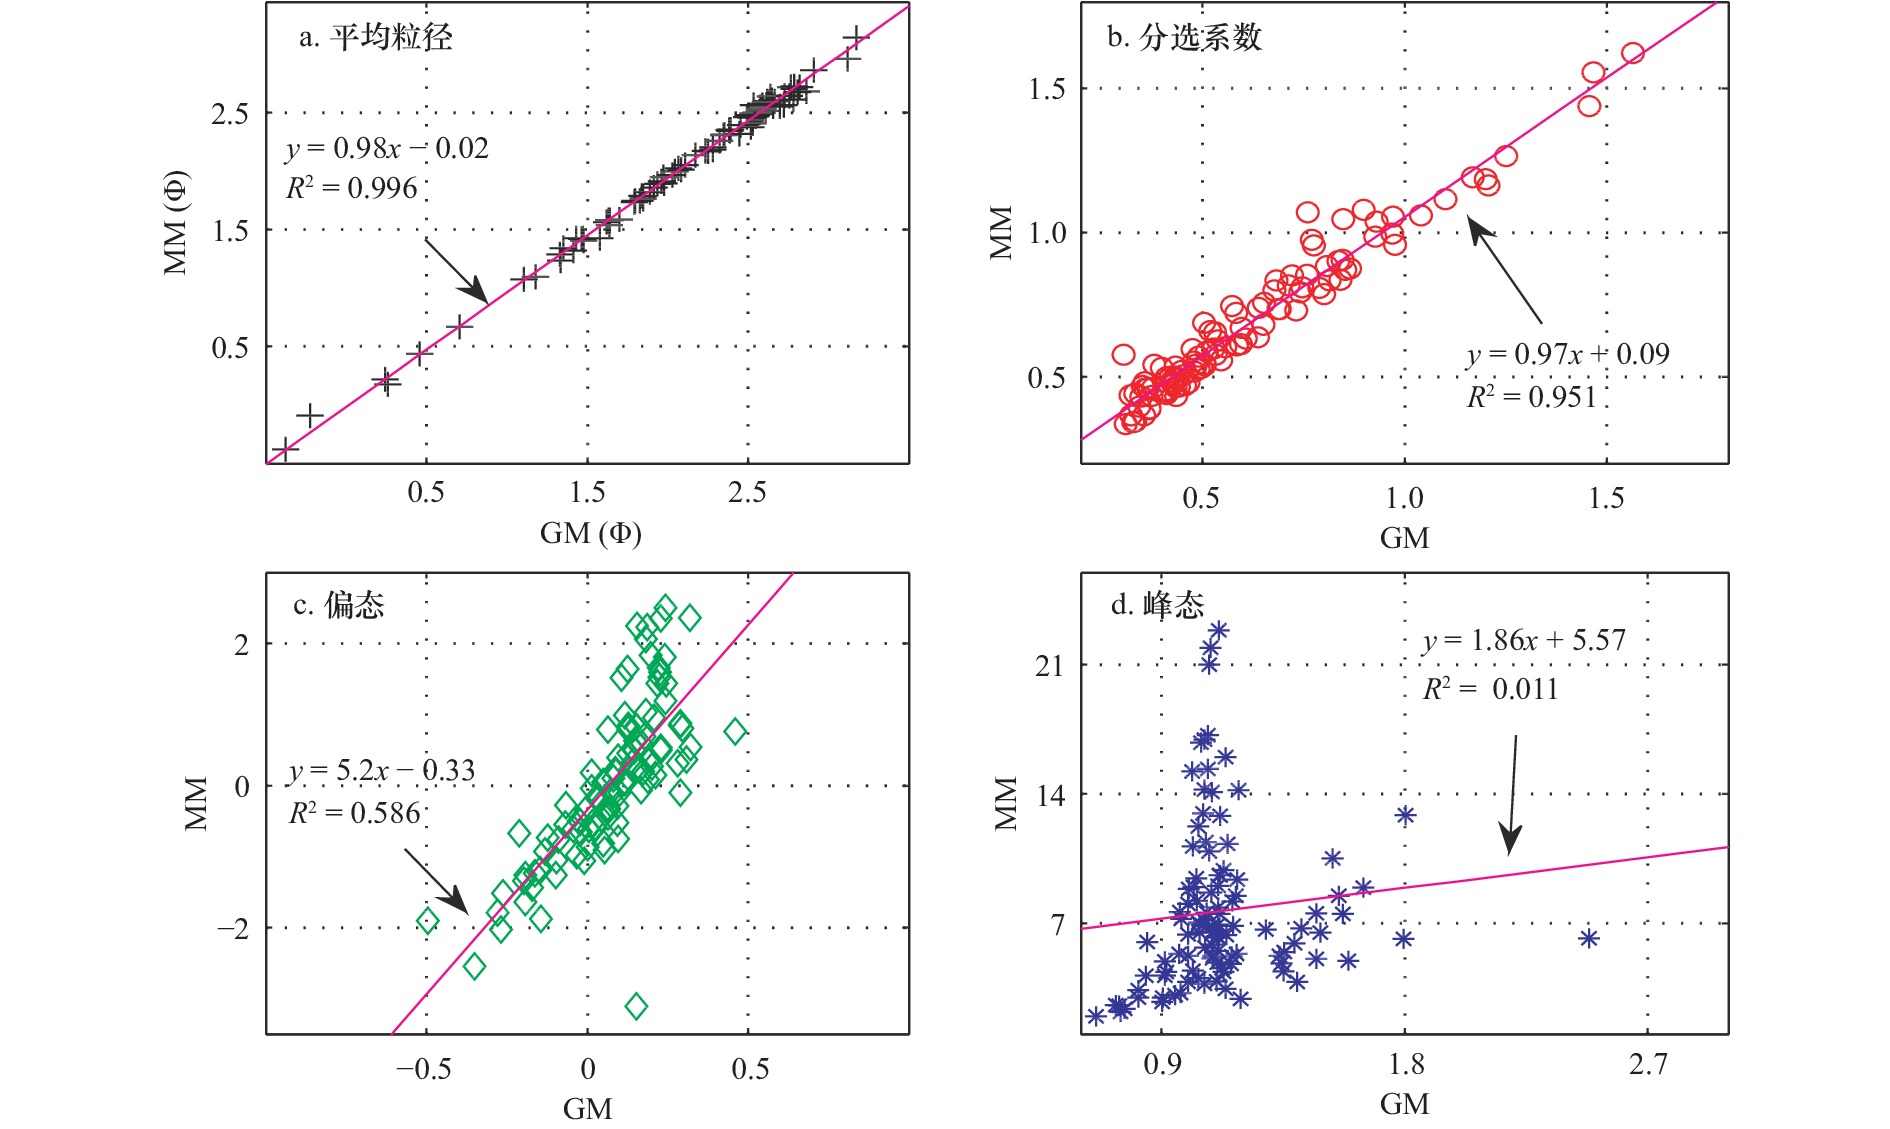
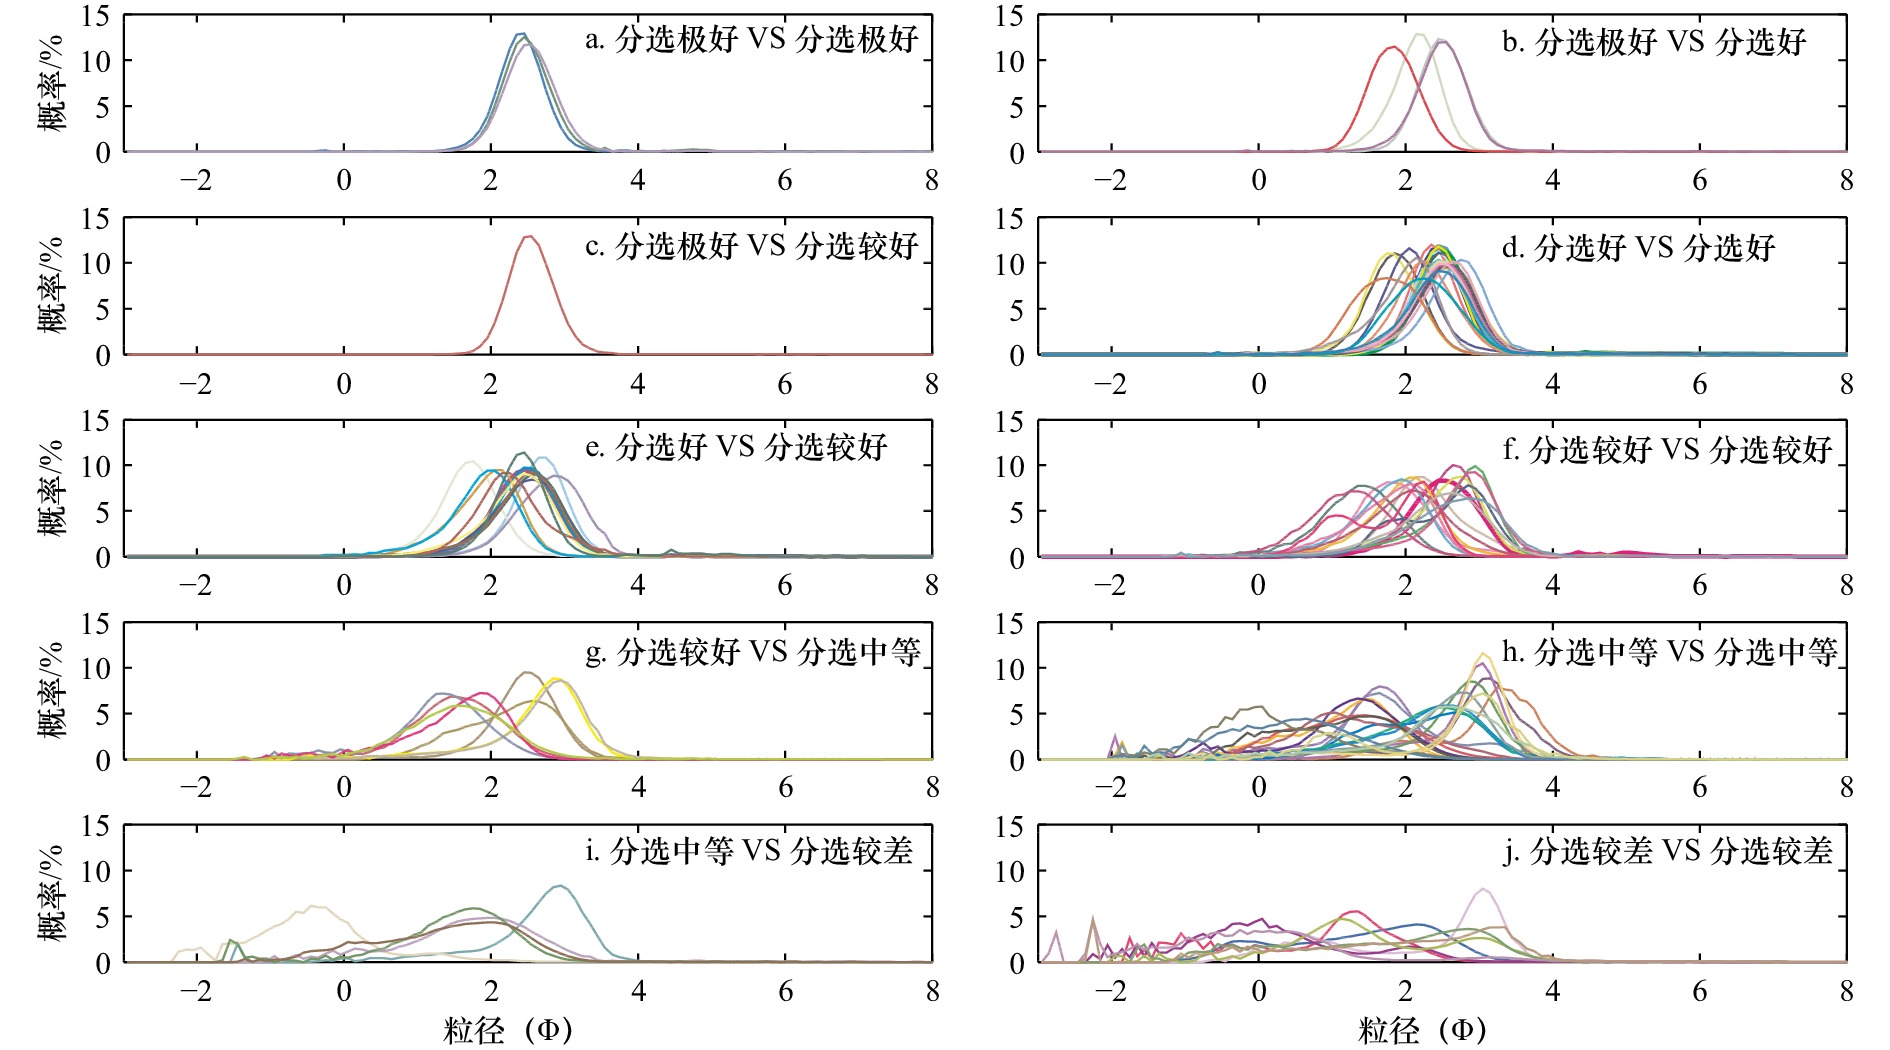
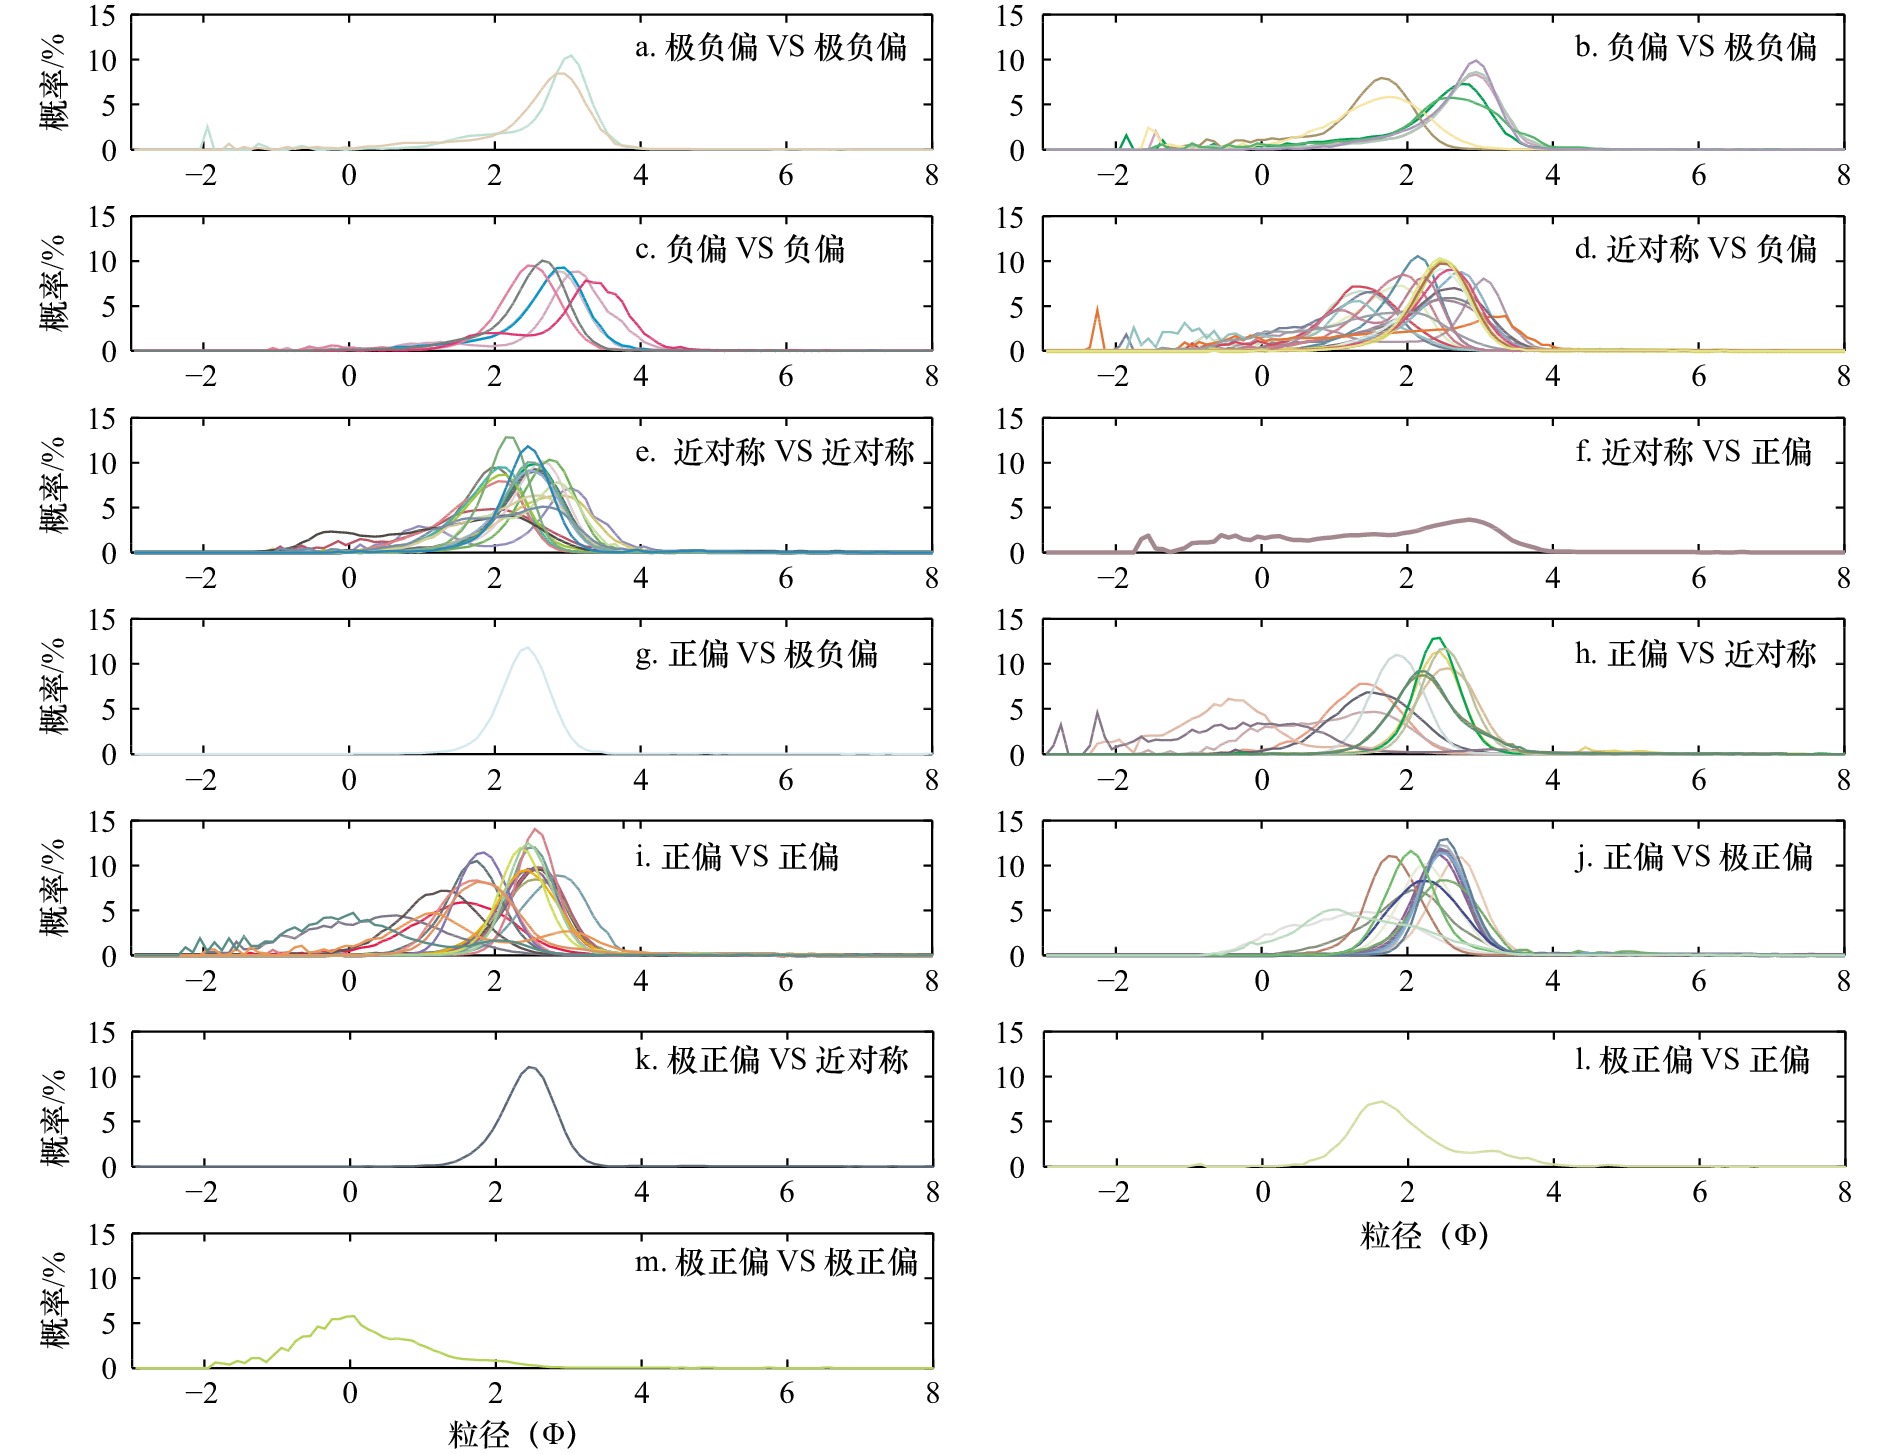
摘要: 前人已开展了大量的关于图解法和矩值法数值结果的相关性分析和相互转换方程的确定工作,但针对定性结果的对比仍较为罕见。本文选取了琼州海峡两岸15个海滩22条断面105个表层沉积物为典型研究对象,分别采用Folk和Ward图解法和Friedman矩值法获取粒度参数结果,构建定量结果的回归关系和对比定性结果的异同。结合前人的研究成果,本文进一步探讨了两种方法结果的可对比性,并分析两种方法的方法差异对沉积物粒度信息提取及使用造成的可能影响。研究结果表明:(1)就定量结果而言,图解法和矩值法计算的平均粒径和分选系数具有强相关性(R2 ≥ 0.951),而偏态和峰态则表现为中等相关(R2 = 0.586)和不相关(R2 = 0.011),表明图解法和矩值法计算粒度参数定量结果之间的相关性并不稳定,这与前人的研究结果基本一致;(2)就定性结果而言,图解法和矩值法的结果之间存在较大偏差,分选系数、偏态和峰态不一致的占比分别达30.48%、55.24%和71.43%,这与定量结果的相关性存在一定程度的偏差,表明定量结果的相关性程度并不能完全用于指示定性术语结果的一致性程度。鉴于最大化地揭示沉积物的差异是粒度参数分析方法追寻的目标,在选择何种方法计算粒度参数时需充分考虑沉积物粒径概率分布曲线的特征。本文提供了一个以海滩沉积物为研究对象的图解法和矩值法粒度参数结果对比的典型案例,研究结果有助于提升对粒度参数分析方法的差异、原因和科学使用等方面的认识。Abstract: Little research attention has been paid to comparison of the descriptive terms used in graphical method and moment method for grains-size parameters, although some work has been done on comparison of the numerical values and mutual conversion equations. In this paper, 105 surface sediments from 22 sections of 15 beaches on both sides of the Qiongzhou Strait are selected as typical research objects. The grain-size parameter results are obtained by the Folk & Ward graphic method and Friedman moment method respectively. The regression relationship of quantitative results is constructed and the similarities and differences of qualitative results are compared. Combined with the previous research results, this paper further discusses the comparability of the results of the two methods, and analyzes the possible impact of the differences between the two methods on the extraction and use of sediment particle size information. The results show that: (1) in terms of quantitative results, the average particle size and sorting coefficient calculated by graphic method and moment method have strong correlation (R2 ≥ 0.951), while the skewness and kurtosis show moderate correlation (R2 = 0.586) and uncorrelation (R2 = 0.011), indicating that the correlation between the quantitative results of particle size parameters calculated by the two methods is not stable, which is basically consistent with the previous research results; (2) as far as qualitative results are concerned, there is a large deviation between the results of graphic method and moment method. The proportion of inconsistent sorting coefficient, skewness and kurtosis is 30.48%, 55.24% and 71.43% respectively, which deviates from the correlation of quantitative results to a certain extent, indicating that the correlation degree of quantitative results can not be fully used to indicate the consistency degree of qualitative term results. Since it is the goal of grain-size parameter analysis method to reveal the differences of sediments to the greatest extent, it is necessary to fully consider the characteristics of grain-size distribution curve when choosing which method to calculate grain-size parameters. This paper provides a typical case of comparing the results of graphical method and moment method for grain-size parameters of beach sediments. The research results help to improve the understanding of the differences, causes and scientific use of grain-size parameter analysis methods.
-
表 1 图解法和矩值法粒度参数的计算方程
Tab. 1 Equations of grain-size parameters for the graphic and moment mothods
粒度参数 图解法[5] 矩值法[7] 平均粒径(Φ) ${ \displaystyle\frac{{D}_{16}+{D}_{50}+{D}_{84}}{3} }$ ${ \displaystyle\frac{\displaystyle\sum _{i}^{n}{X}_{i}{f}_{i}}{100} }$ 分选系数 ${ \displaystyle\frac{{D}_{84}-{D}_{16}}{4}+\displaystyle\frac{{D}_{95}-{D}_{5}}{6.6}} $ ${ {\left[\displaystyle\frac{ \displaystyle\sum _{i}^{n}{ {f}_{i}({X}_{i}-\stackrel{—}{X})^{2} } }{100}\right]}^{1/2} }$ 偏态 ${ \displaystyle\frac{{D}_{84}+{D}_{16}-{2D}_{50}}{2({D}_{84}-{D}_{16})}+\displaystyle\frac{{D}_{95}+{D}_{5}-{2D}_{50}}{2({D}_{95}-{D}_{5})}} $ ${ \displaystyle\frac{ \displaystyle\sum _{i}^{n}{({X}_{i}-\stackrel{—}{X})^{3} }{f}_{i} }{100{\sigma }^{3} } }$ 峰态 ${ \displaystyle\frac{{D}_{95}-{D}_{5}}{2.44({D}_{75}-{D}_{25})}} $ ${ \displaystyle\frac{ \displaystyle\sum _{i}^{n}{({X}_{i}-\stackrel{—}{X})^{4} }{f}_{i} }{100{\sigma }^{4} } }$ 注:D5、D16、D25、D50、D75、D84、D95分别对应概率累积曲线上5%、16%、25%、50%、75%、84%和95%的粒径;Xi为粒级组的中值,fi为各粒级范围的百分比含量,$ \sigma $为分选系数的结果。 表 2 图解法和矩值法粒度参数的定性描述术语及其数值范围
Tab. 2 Physical descriptive terms and their ranges applied to numerical values for grain-size parameters of the graphical and moment methods
粒度参数 定性描述术语 数值范围 图解法[5] 矩值法[7] 分选 分选极好 < 0.35 < 0.35 分选好 0.35~0.50 0.35~0.50 分选较好 0.50~0.70 0.50~0.70 分选中等 0.70~1.00 0.70~1.00 分选较差 1.00~2.00 1.00~2.00 分选差 2.00~4.00 2.00~4.00 分选极差 > 4.00 > 4.00 偏态 极负偏 –1.0~–0.3 < −1.30 负偏 –0.3~–0.1 −0.30~–0.43 近对称 –0.1~0.1 –0.43~0.43 正偏 0.1~0.3 0.43~1.30 极正偏 0.3~1.0 > 1.30 峰态 很平坦 < 0.67 < 1.70 平坦 0.67~ 0.90 1.70~2.55 中等 0.90~1.11 2.55~3.70 尖锐 1.11~1.50 3.70~7.40 很尖锐 1.50~3.00 > 7.40 非常尖锐 > 3.00 − 注:“−”代表无数据。 表 3 图解法(GM)和矩值法(MM)粒度参数数值结果特征值统计表
Tab. 3 Characteristic values of grain-size parameters for the numerical values of graphic method (GM) and moment method (MM)
粒度参数 计算方法 最小值 最大值 平均值 标准偏差 平均粒径 GM –0.37 3.17 2.16 0.66 MM –0.37 3.14 2.10 0.68 分选系数 GM 0.31 1.56 0.62 0.27 MM 0.34 1.62 0.69 0.27 偏态 GM –0.49 0.46 0.07 0.16 MM –3.10 2.50 0.06 1.10 峰态 GM 0.66 2.48 1.13 0.25 MM 1.95 22.87 7.67 4.33 表 4 图解法(GM)和矩值法(MM)分选系数术语的分布矩阵(%)
Tab. 4 Distribution matrix for the sorting descriptive terms obtained using the graphic method (GM) and the moment method (MM) (%)
MM GM 分选极好 分选好 分选较好 分选中等 分选较差 分选极好 2.86 0.00 0.00 0.00 0.00 分选好 3.81 22.86 0.00 0.00 0.00 分选较好 0.95 13.33 16.19 0.00 0.00 分选中等 0.00 0.00 7.62 19.05 0.00 分选较差 0.00 0.00 0.00 4.76 8.57 表 5 图解法(GM)和矩值法(MM)偏态术语的分布矩阵(%)
Tab. 5 Distribution matrix for the skewness descriptive terms obtained using the graphic method (GM) and the moment method (MM) (%)
MM GM 极负偏 负偏 近对称 正偏 极正偏 极负偏 1.90 6.67 0.00 0.95 0.00 负偏 0.00 5.71 19.05 0.00 0.00 近对称 0.00 0.00 18.10 11.43 0.95 正偏 0.00 0.00 0.95 18.10 1.90 极正偏 0.00 0.00 0.00 13.33 0.95 表 6 图解法(GM)和矩值法(MM)峰态术语的分布矩阵(%)
Tab. 6 Distribution matrix for the kurtosis descriptive terms obtained using the graphic method (GM) and the moment method (MM) (%)
MM GM 很平坦 平坦 中等 尖锐 很尖锐 很平坦 0.00 0.00 0.00 0.00 0.00 平坦 0.95 2.86 0.00 0.00 0.00 中等 0.00 2.86 3.81 1.90 0.00 尖锐 0.00 1.90 25.71 17.14 2.86 很尖锐 0.00 0.00 22.86 12.38 4.76 表 7 图解法(GM)和矩值法(MMFr或MMMc)粒度参数回归方程的斜率和拟合优度(R2)统计表
Tab. 7 Regression equations and their coefficients of determination for the grain size parameters computed by the graphic method (GM) and moment method (MMFr or MMMc)
对比方法 序号 沉积环境 平均粒径 分选系数 偏态 峰态 参考文献 斜率 R2 斜率 R2 斜率 R2 斜率 R2 GM- MMFr 1 黄土高原西部黄土古土壤和风成砂 1.01 0.999 1.00 0.947 1.14 0.384 3.06 0.941 [15] 2 东沙群岛以东陆坡区沉积物 0.94 0.995 0.90 0.978 3.11 0.732 3.56 0.725 [16] 3 中沙群岛以东深海盆地沉积物 0.95 0.986 0.90 0.991 2.01 0.726 2.60 0.697 [16] 4 长江口外近海海域表层沉积物 – 0.998 – 0.956 – 0.179 – 0.411 [22] 5 钱塘江河口中高潮滩泥质纹层 1.06 0.999 1.52 0.898 0.30 0.877 0.26 0.970 [17] 6 钱塘江河口中高潮滩砂质纹层 1.05 0.974 1.42 0.875 0.09 0.156 0.20 0.718 [17] 7 西台吉乃尔盐湖沉积物 – 0.997 – 0.870 – 0.328 – 0.273 [18] 8 岱海稳定湖相沉积物 1.05 0.991 1.12 0.959 0.23 0.632 0.15 0.622 [21] 9 洛川典型风成黄土 1.05 0.987 1.05 0.811 0.35 0.804 0.11 0.391 [21] 10 秦安孙嘉剖面红黏土 1.05 0.999 1.26 0.954 0.20 0.499 0.14 0.742 [21] 11 酒泉盆地火烧沟河湖相沉积物 1.05 0.995 0.97 0.724 0.46 0.840 0.24 0.617 [21] 12 胶州湾表层沉积物 0.99 0.998 1.07 0.966 2.30 0.801 1.71 0.597 [12] 13 江苏潮滩表层沉积物 0.97 0.998 0.78 0.949 4.14 0.390 3.75 0.065 [12] 14 珠江水下三角洲表层沉积物 0.97 0.998 0.97 0.971 2.16 0.788 2.84 0.791 [12] 15 湛江南三岛海滩表层沉积物 1.04 0.979 1.01 0.821 3.21 0.207 4.19 0.035 [12] 16 北部湾陆架表层沉积物 0.99 0.994 0.97 0.985 1.92 0.844 2.40 0.816 [12] 17 海南潟湖表层沉积物 0.97 0.998 0.85 0.944 2.62 0.416 3.24 0.537 [12] 18 琼州海峡两岸海滩表层沉积物 0.98 0.996 0.97 0.951 5.20 0.586 1.86 0.011 本研究 GM-MMMc 19 山东半岛月湖和荣成湾沉积物 – 0.998 – 0.985 – 0.771 – 0.248 [14] 20 宜昌莲沱河河道沉积物 1.05 0.995 0.96 0.907 0.47 0.130 0.43 0.494 [23] 21 福建泉州湾表层沉积物 0.94 0.966 0.83 0.631 4.24 0.146 1.20 0.084 [19] 22 金沙江上游雪隆囊溃坝堆积物(上游) 0.72 0.948 0.93 0.824 1.89 0.757 6.91 0.822 [20] 23 金沙江上游雪隆囊溃坝堆积物(中游) 0.92 0.994 0.89 0.959 1.73 0.815 2.47 0.942 [20] 24 金沙江上游雪隆囊溃坝堆积物(下游) 0.99 0.991 1.45 0.901 2.25 0.491 4.66 0.580 [20] 25 湛江南三岛海滩表层沉积物 1.04 0.979 1.01 0.821 0.13 0.067 0.04 0.159 [11] 注:“−”代表无数据。 -
[1] Gao S, Collins M. Net sediment transport patterns inferred from grain-size trends, based upon definition of “transport vectors”[J]. Sedimentary Geology, 1992, 81(1/2): 47−60. [2] Michael N A, Zühlke R. Source-to-sink: regional grain size trends to reconstruct sediment budgets and catchment areas[J]. Basin Research, 2022, 34(1): 393−410. doi: 10.1111/bre.12624 [3] Wu Li, Krijgsman W, Liu Jian, et al. CFLab: a MATLAB GUI program for decomposing sediment grain size distribution using Weibull functions[J]. Sedimentary Geology, 2020, 398: 105590. doi: 10.1016/j.sedgeo.2020.105590 [4] Chiverrell R C, Sear D A, Warburton J, et al. Using lake sediment archives to improve understanding of flood magnitude and frequency: recent extreme flooding in northwest UK[J]. Earth Surface Processes and Landforms, 2019, 44(12): 2366−2376. doi: 10.1002/esp.4650 [5] Folk R L, Ward W C. Brazos river bar: a study in the significance of grain size parameters[J]. Journal of Sedimentary Petrology, 1957, 27(1): 3−26. doi: 10.1306/74D70646-2B21-11D7-8648000102C1865D [6] Swan D, Clague J J, Luternauer J L. Grain-size statistics I: evaluation of the Folk and Ward graphic measures[J]. Journal of Sedimentary Petrology, 1978, 48(3): 863−878. [7] Cera A, Pierdomenico M, Sodo A, et al. Spatial distribution of microplastics in volcanic lake water and sediments: relationships with depth and sediment grain size[J]. Science of the Total Environment, 2022, 829: 154659. doi: 10.1016/j.scitotenv.2022.154659 [8] Friedman G M. Comparison of moment measures for sieving and thin-section data in sedimentary petrological studies[J]. Journal of Sedimentary Petrology, 1962, 32(1): 15−25. [9] McManus J. Grain size determination and interpretation[M]//Tucker M E. Techniques in Sdimentology. Oxford: Blackwell Scientific Publications, 1988: 63–85. [10] Blott S J, Pye K. GRADISTAT: a grain size distribution and statistics package for the analysis of unconsolidated sediments[J]. Earth Surface Processes and Landforms, 2001, 26(11): 1237−1248. doi: 10.1002/esp.261 [11] 赵珍清. 南黄海沉积物粒度分布参数计算方法的比较[J]. 海洋地质与第四纪地质, 1992, 12(3): 95−107. doi: 10.16562/j.cnki.0256-1492.1992.03.010Zhao Zhenqing. Comparison of calculating methods for grain-size distribution parameters of sediments in South Yellow Sea[J]. Marine Geology & Quaternary Geology, 1992, 12(3): 95−107. doi: 10.16562/j.cnki.0256-1492.1992.03.010 [12] 贾建军, 高抒, 薛允传. 图解法与矩法沉积物粒度参数的对比[J]. 海洋与湖沼, 2002, 33(6): 577−582. doi: 10.3321/j.issn:0029-814X.2002.06.002Jia Jianjun, Gao Shu, Xue Yunchuan. Grain-size parameters derived from graphic and moment methods: a comparative study[J]. Oceanologia et Limnologia Sinica, 2002, 33(6): 577−582. doi: 10.3321/j.issn:0029-814X.2002.06.002 [13] 徐树建, 潘保田, 张慧, 等. 末次冰期旋回风成沉积物图解法与矩值法粒度参数的对比[J]. 干旱区地理, 2005, 28(2): 194−198. doi: 10.3321/j.issn:1000-6060.2005.02.011Xu Shujian, Pan Baotian, Zhang Hui, et al. Grain size parameters of Loess-palaeosol Deposits from graphic and moment methods: a comparative study[J]. Arid Land Geography, 2005, 28(2): 194−198. doi: 10.3321/j.issn:1000-6060.2005.02.011 [14] 刘志杰, 龙海燕. 南海沉积物图解法和矩值法粒度参数计算及对比[J]. 中国海洋大学学报, 2009, 39(2): 313−316, 336.Liu Zhijie, Long Haiyan. Comparing study on the grain-size parameters estimated from the graphical method and the moment method of the sediments from South China Sea[J]. Periodical of Ocean University of China, 2009, 39(2): 313−316, 336. [15] 蔡国富, 范代读, 尚帅, 等. 图解法与矩值法计算的潮汐沉积粒度参数之差异及其原因解析[J]. 海洋地质与第四纪地质, 2014, 34(1): 195−204.Cai Guofu, Fan Daidu, Shang Shuai, et al. Difference in grain-size parameters of tidal deposits derived form the graphic and its potential causes[J]. Marine Geology & Quaternary Geology, 2014, 34(1): 195−204. [16] 曾方明, 张萍. 图解法和矩值法计算西台吉乃尔盐湖沉积物粒度参数的差异[J]. 盐湖研究, 2015, 23(3): 1−4, 22.Zeng Fangming, Zhang Ping. Differences of particle parameters calculated by graphic and moment methods in sediments at the West Taijinar Salt Lake region[J]. Journal of Salt Lake Research, 2015, 23(3): 1−4, 22. [17] 王兆夺, 于东生, 罗福生, 等. 图解法和矩法计算泉州湾表层沉积物粒度参数的对比[J]. 海洋地质前沿, 2016, 32(7): 19−27. doi: 10.16028/j.1009-2722.2016.07003Wang Zhaoduo, Yu Dongsheng, Luo Fusheng, et al. Comparison of grain size parameters from graphical and moment methods for surface sediments in Quanzhou Bay[J]. Marine Geology Frontiers, 2016, 32(7): 19−27. doi: 10.16028/j.1009-2722.2016.07003 [18] 陈松, 陈剑, 乔春生, 等. 图解法与矩值法在金沙江上游雪隆囊古滑坡堰塞湖溃坝堆积物粒度分析中的应用[J]. 现代地质, 2017, 31(6): 1278−1283. doi: 10.3969/j.issn.1000-8527.2017.06.018Chen Song, Chen Jian, Qiao Chunsheng, et al. Application of graphic and moment methods on the analysis of particle sizes of dam-break accumulations by Xuelongnang Ancient Landslide Lake in the upper Jinsha River[J]. Geoscience, 2017, 31(6): 1278−1283. doi: 10.3969/j.issn.1000-8527.2017.06.018 [19] 戴建, 张平. 几种沉积物图解法与矩值法粒度参数的对比研究及其意义[J]. 地质学刊, 2017, 41(2): 239−244. doi: 10.3969/j.issn.1674-3636.2017.02.011Dai Jian, Zhang Ping. Comparison and its significance of grain-size parameters of several sediments with graphic method and moment method[J]. Journal of Geology, 2017, 41(2): 239−244. doi: 10.3969/j.issn.1674-3636.2017.02.011 [20] 李高聪, 李志强, 朱士兵, 等. 图解法和矩值法海洋沉积物粒度参数的对比[J]. 广东海洋大学学报, 2020, 40(6): 96−101. doi: 10.3969/j.issn.1673-9159.2020.06.012Li Gaocong, Li Zhiqiang, Zhu Shibing, et al. Comparative study on grain-size parameters of marine sediment derived from graphic and moment methods[J]. Journal of Guangdong Ocean University, 2020, 40(6): 96−101. doi: 10.3969/j.issn.1673-9159.2020.06.012 [21] Li Gaocong, Du Rihong, Tang Jieping, et al. Comparison of the graphic and moment methods for analyzing grain-size distributions: a case study for the Chinese inner continental shelf seas[J]. International Journal of Sediment Research, 2022, 37(6): 729−736. doi: 10.1016/j.ijsrc.2022.05.001 [22] 刘志杰, 公衍芬, 周松望, 等. 海洋沉积物粒度参数3种计算方法的对比研究[J]. 海洋学报, 2013, 35(3): 179−188.Liu Zhijie, Gong Yanfen, Zhou Songwang, et al. A comparative study on the grain-size parameters of marine sediments derived from three different computing methods[J]. Haiyang Xuebao, 2013, 35(3): 179−188. [23] 陶敏, 邓山, 王婷乐, 等. 矩值法和图解法计算山区河流沉积物粒度参数的差异[J]. 三峡大学学报(自然科学版), 2011, 33(6): 27−32.Tao Min, Deng Shan, Wang Tingle, et al. The difference between moment method and graphic method for calculating grain-size parameters of sediments in mountain streams[J]. Journal of China Three Gorges University (Natural Sciences), 2011, 33(6): 27−32. [24] Swan D, Clague J J, Luternauer J L. Grain-size statistics II: evaluation of grouped moment measures[J]. Journal of Sedimentary Petrology, 1979, 49(2): 487−500. [25] Wang Shanshan, Pan Cunhong, Xie Dongfeng, et al. Grain size characteristics of surface sediment and its response to the dynamic sedimentary environment in Qiantang Estuary, China[J]. International Journal of Sediment Research, 2022, 37(4): 457−468. doi: 10.1016/j.ijsrc.2021.12.002 [26] Yang Yang, Piper D J W, Xu Min, et al. Northwestern Pacific tropical cyclone activity enhanced by increased Asian dust emissions during the little ice age[J]. Nature Communications, 2022, 13(1): 1712. [27] van Rijn L C. Unified view of sediment transport by currents and waves. I: initiation of motion, bed roughness, and bed-load transport[J]. Journal of Hydraulic Engineering, 2007, 133(6): 649−667. doi: 10.1061/(ASCE)0733-9429(2007)133:6(649) [28] 李自超, 蒲晓强, 赵辉, 等. 湖光岩玛珥湖表层沉积物粒度特征及其物源指示意义[J]. 广东海洋大学学报, 2017, 37(3): 93−99. doi: 10.3969/j.issn.1673-9159.2017.03.014Li Zichao, Pu Xiaoqiang, Zhao Hui, et al. Grain size characteristics of the surface sediments in Huguangyan Maar Lake and its significance to sediment source analysis[J]. Journal of Guangdong Ocean University, 2017, 37(3): 93−99. doi: 10.3969/j.issn.1673-9159.2017.03.014 [29] 张才学, 孙省利, 陈春亮. 湛江港湾表层沉积物重金属的分布特征及潜在生态危害评价[J]. 湛江海洋大学学报, 2006, 26(3): 45−49.Zhang Caixue, Sun Xingli, Chen Chunliang. Distribution features and evaluation on potential ecological risk of heavy metals in submarine surface sediments of Zhanjiang Bay[J]. Journal of Zhanjiang Ocean University, 2006, 26(3): 45−49. [30] 谭靖千, 高苑, Abarike G A, 等. 环雷州半岛海底表层沉积物brGDGTs组成分布特征及其环境意义[J]. 广东海洋大学学报, 2021, 41(5): 84−93. doi: 10.3969/j.issn.1673-9159.2021.05.011Tan Jingqian, Gao Yuan, Abarike G A, et al. Composition and distribution characteristics of brGDGTs and significance of environment in surface sediments of Leizhou Peninsula[J]. Journal of Guangdong Ocean University, 2021, 41(5): 84−93. doi: 10.3969/j.issn.1673-9159.2021.05.011 [31] 黄鑫, 蒲晓强. 热液活动对海底沉积物中有机质的影响[J]. 广东海洋大学学报, 2017, 37(1): 117−124. doi: 10.3969/j.issn.1673-9159.2017.01.019Huang Xin, Pu Xiaoqiang. The influence of hydrothermal activities on the organic matter in sediment[J]. Journal of Guangdong Ocean University, 2017, 37(1): 117−124. doi: 10.3969/j.issn.1673-9159.2017.01.019 -


 下载:
下载:


