

Accuracy assessment of global vertical displacement loading tide models in the Bohai Sea, Yellow Sea, East China Sea and surrounding areas
-
摘要: 本研究利用渤海、黄海、东海及周边区域21个GPS站的调和常数资料,对5个全球垂向位移负荷潮模式(FES2014、EOT11a、GOT4.10c、GOT4.8和NAO.99b)在渤海、黄海、东海及周边区域的准确度进行了评估。结果表明,在渤海、黄海、东海及周边区域,对于M2分潮,FES2014和EOT11a模式结果准确度相对较高;对于S2分潮,NAO.99b和EOT11a模式结果准确度相对较高;对于K1分潮,EOT11a和FES2014模式结果准确度相对较高;对于O1分潮,EOT11a和GOT4.8模式结果准确度相对较高;对于N2分潮,EOT11a和FES2014模式结果准确度相对较高;对于K2分潮,NAO.99b和FES2014模式结果准确度相对较高;对于P1分潮,EOT11a和GOT4.8模式结果准确度相对较高;对于Q1分潮,FES2014和EOT11a模式结果准确度相对较高。除此之外,本文还简单分析了渤海、黄海、东海及周边区域8个主要分潮的垂向位移负荷潮分布特征。
-
关键词:
- 准确度评估 /
- 垂向位移负荷潮模式 /
- 渤海、黄海、东海及周边区域 /
- GPS站
Abstract: In this study, the harmonic constants of the 5 global vertical displacement loading tide models FES2014, EOT11a, GOT4.10c, GOT4.8 and NAO.99b are validated evaluated to the observed data of 21 GPS stations in Bohai Sea, Yellow Sea, East China Sea and surrounding areas. The results show that the accuracy of the M2 constituents of FES2014 and EOT11a models are relatively high, S2 constituents of NAO.99b and EOT11a models are relatively high, K1 constituents of EOT11a and FES2014 models are relatively high, O1 constituents of EOT11a and GOT4.8 models are relatively high, N2 constituents of EOT11a and FES2014 models are relatively high, K2 constituents of NAO.99b and FES2014 models are relatively high, P1 constituents of EOT11a and GOT4.8 models are relatively high, Q1 constituents of FES2014 and EOT11a models are relatively high. The distribution features of the eight vertical displacement loading tides in Bohai Sea, Yellow Sea, East China Sea and surrounding areas.1) ① CM参考系包括大气、海洋在内的整个地球质量中心。2) ② CF参考系为固体地球外表面的形状中心。 -

图 1 渤海、黄海、东海及周边区域GPS站位置
Fig. 1 GPS station locations in the Bohai Sea, Yellow Sea, East China Sea and surrounding areas
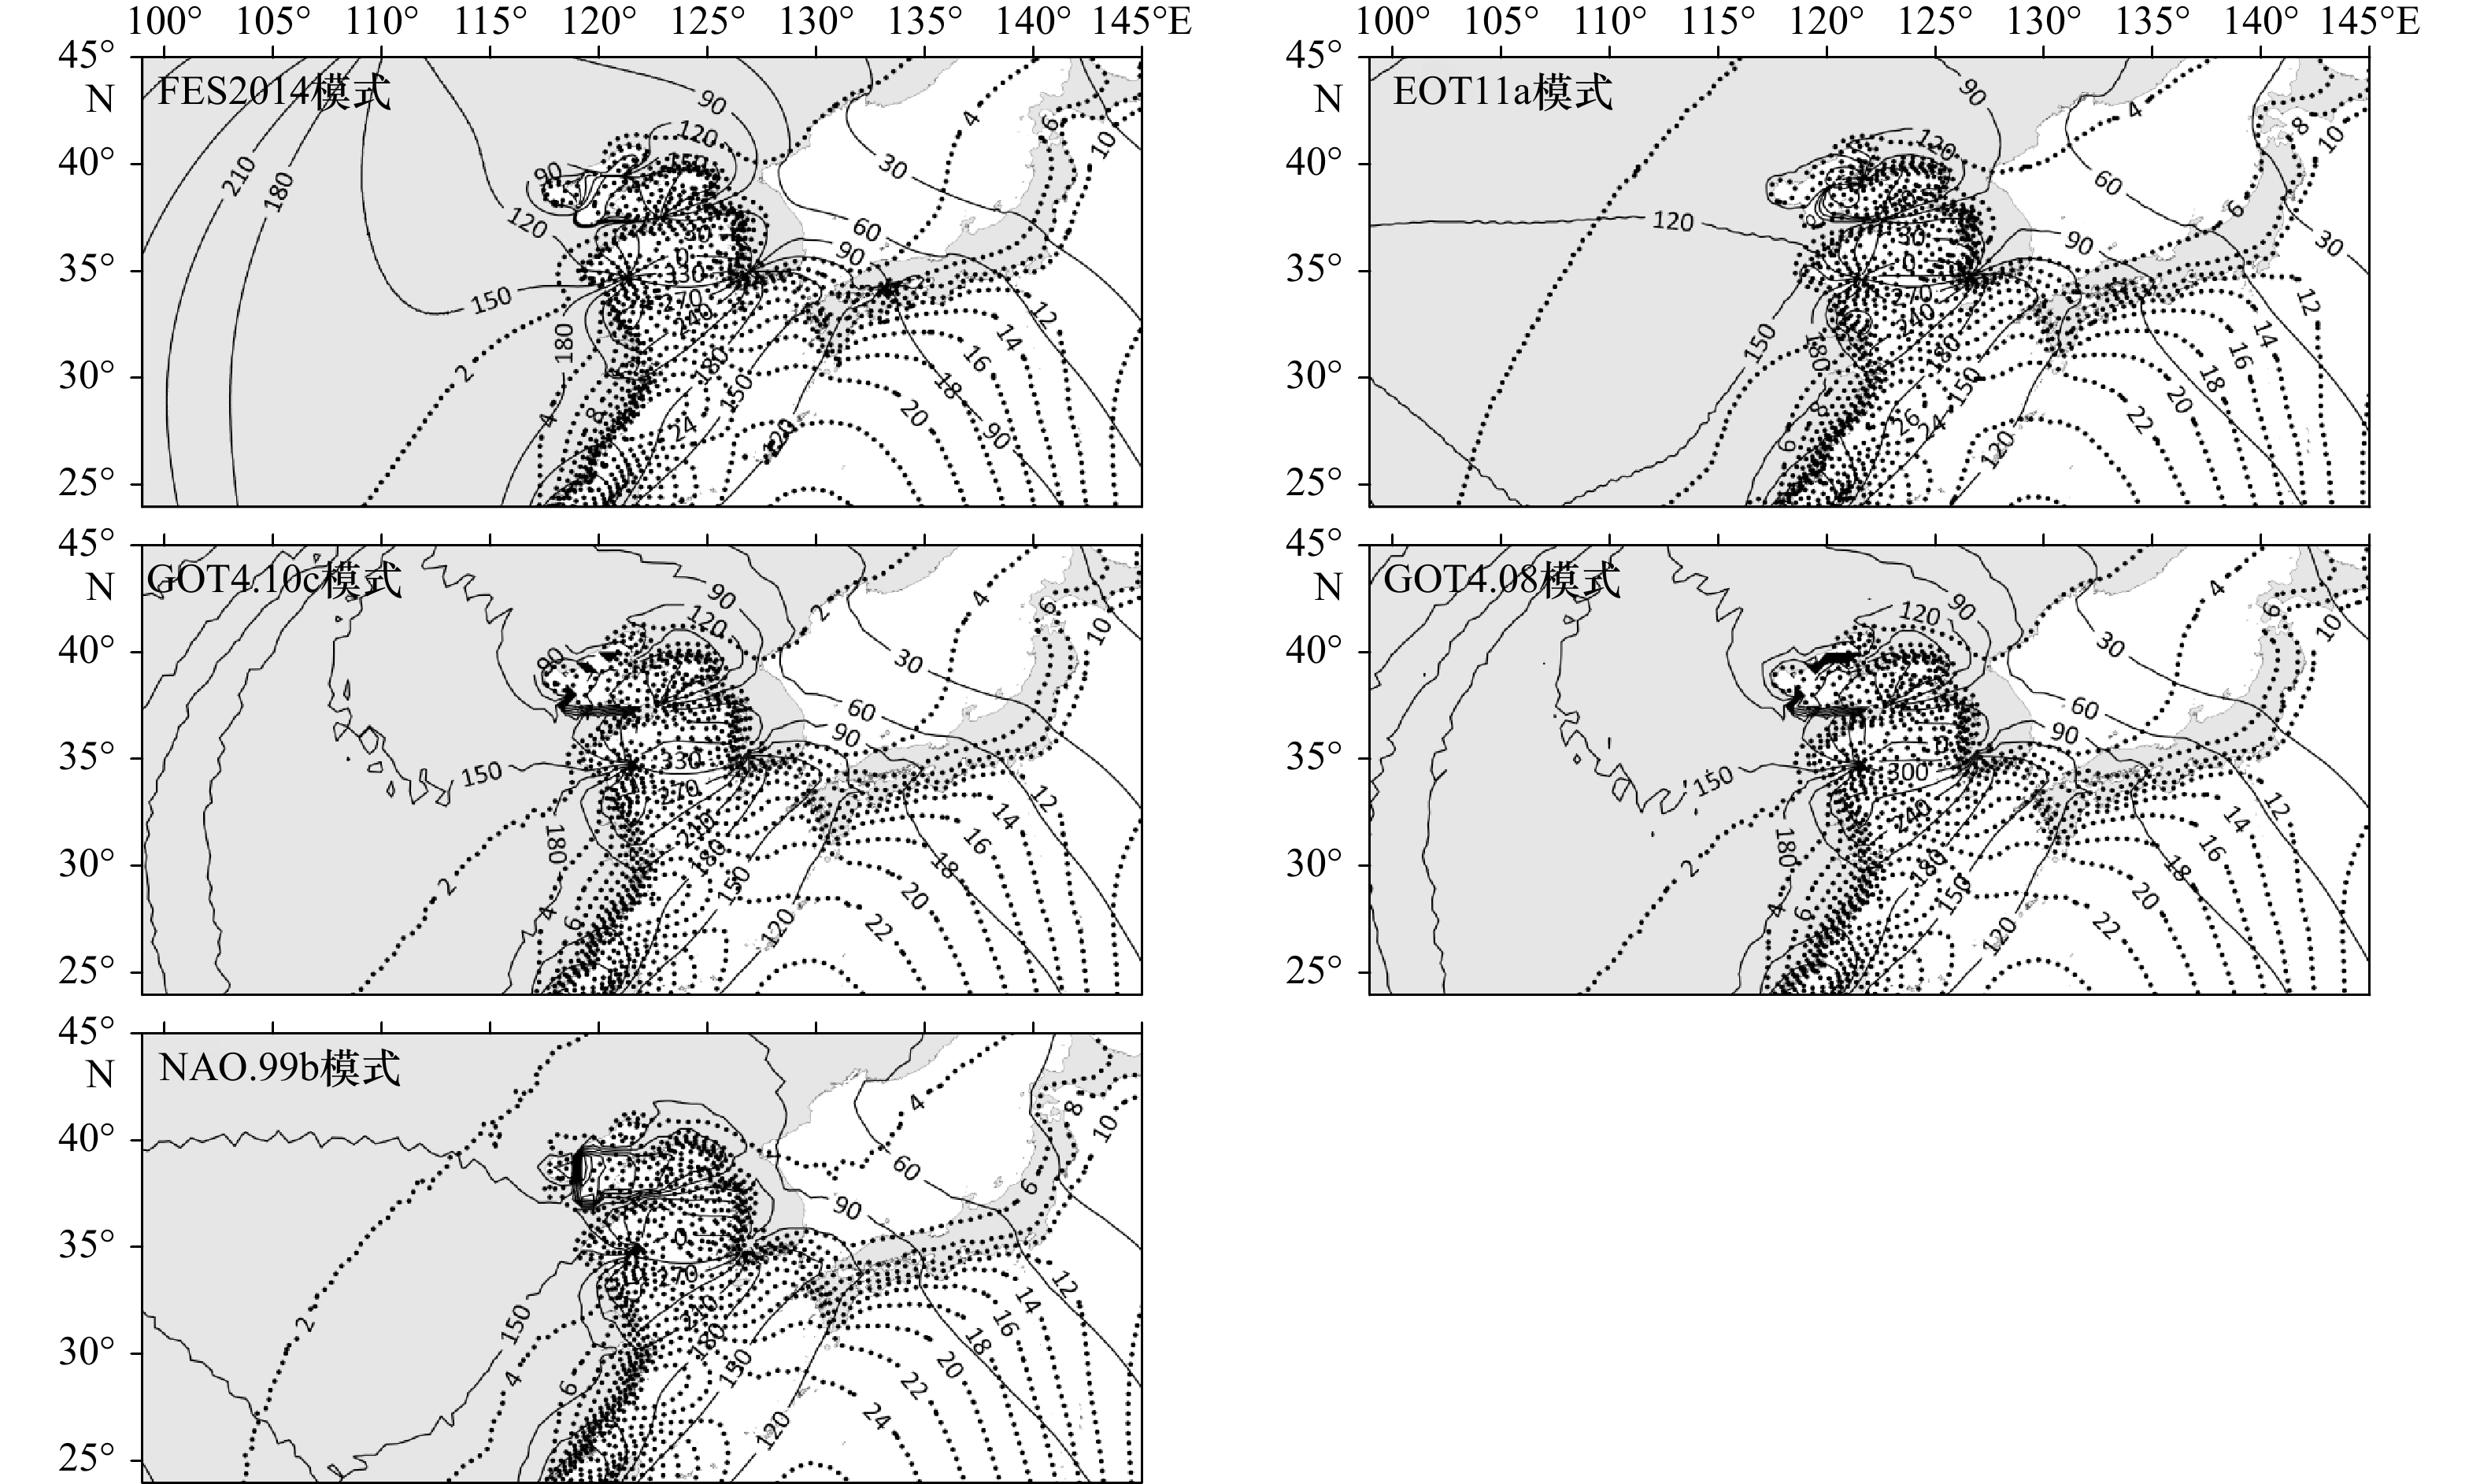
图 2 不同全球垂向位移负荷潮模式下M2分潮在渤海、黄海、东海及周边区域的同潮图
虚线为振幅(mm),实线为格林威治迟角(°)
Fig. 2 Co-tidal charts of M2 for different global vertical displacement loading tide models in the Bohai Sea, Yellow Sea, East China Sea and surrounding areas
Dashed lines indicate amplitude (mm), solid lines indicate Greenwich phase-lag (°)
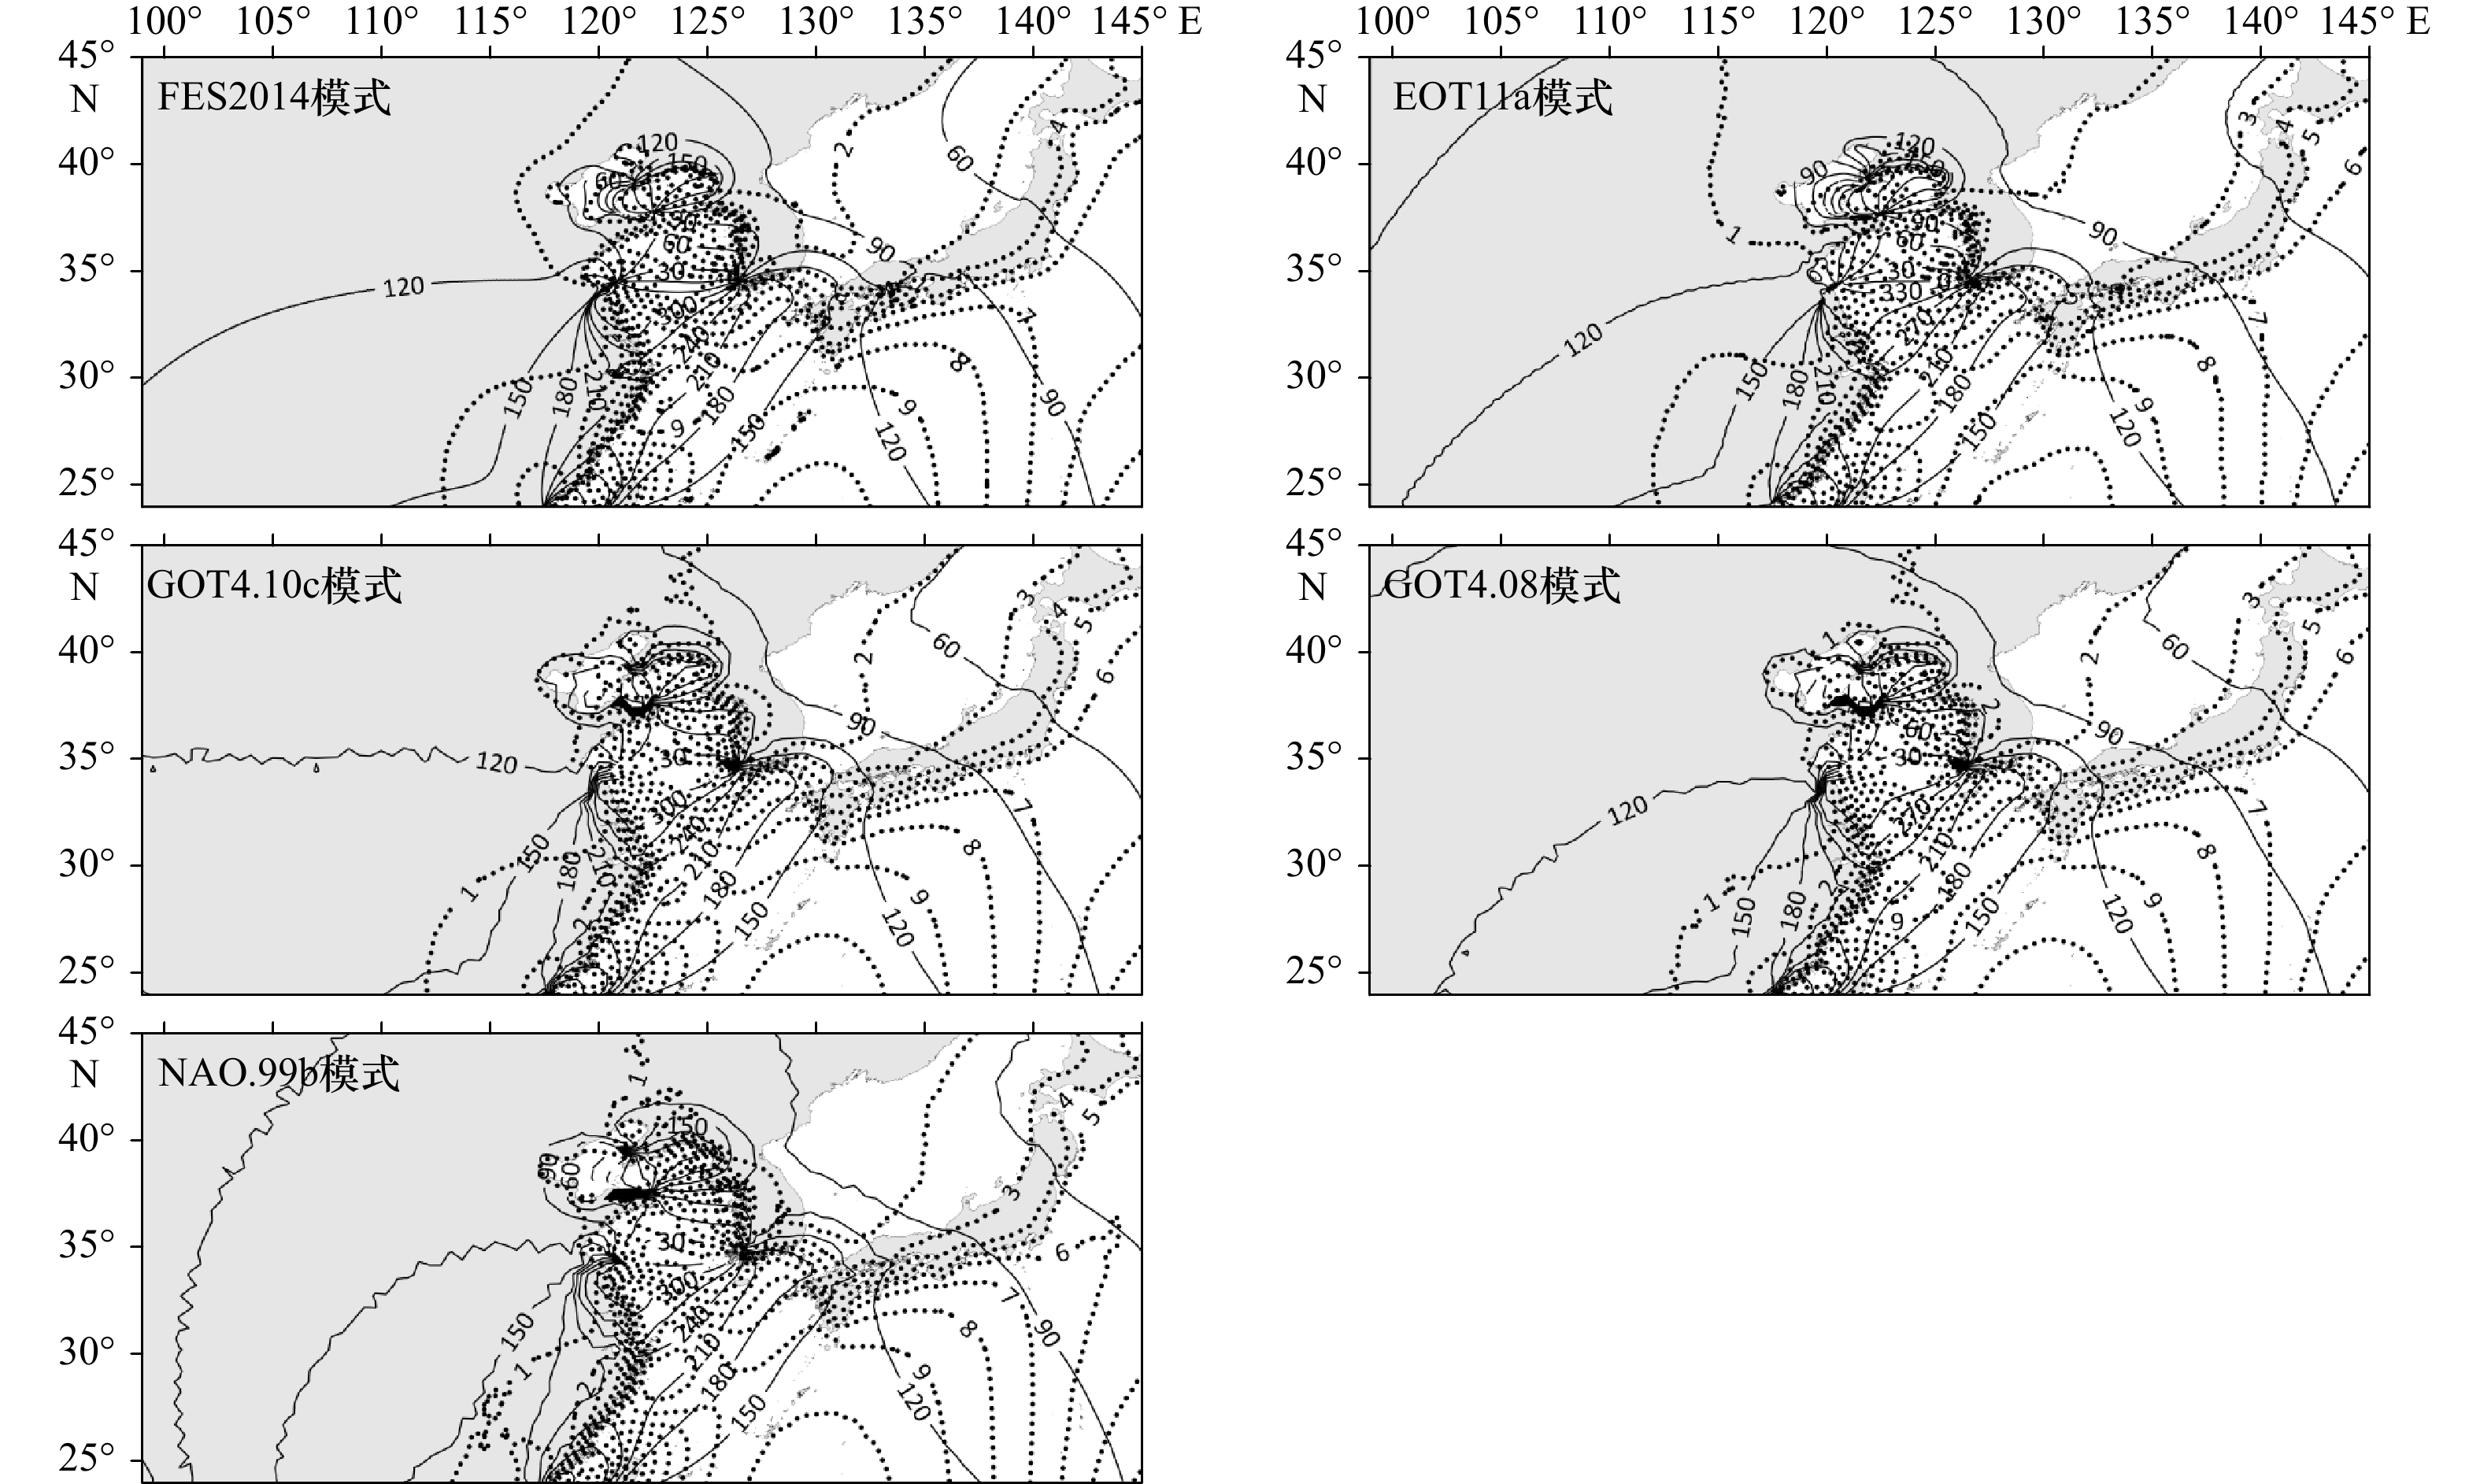
图 3 不同全球垂向位移负荷潮模式下S2分潮在渤海、黄海、东海及周边区域的同潮图
虚线为振幅(mm),实线为格林威治迟角(°)
Fig. 3 Co-tidal charts of S2 for different global vertical displacement loading tide models in the Bohai Sea, Yellow Sea, East China Sea and surrounding areas
Dashed lines indicate amplitude (mm), solid lines indicate Greenwich phase-lag (°)

图 4 不同全球垂向位移负荷潮模式下N2分潮在渤海、黄海、东海及周边区域的同潮图
虚线为振幅(mm),实线为格林威治迟角(°)
Fig. 4 Co-tidal charts of N2 for different global vertical displacement loading tide models in the Bohai Sea, Yellow Sea, East China Sea and surrounding areas
Dashed lines indicate amplitude (mm), solid lines indicate Greenwich phase-lag (°)
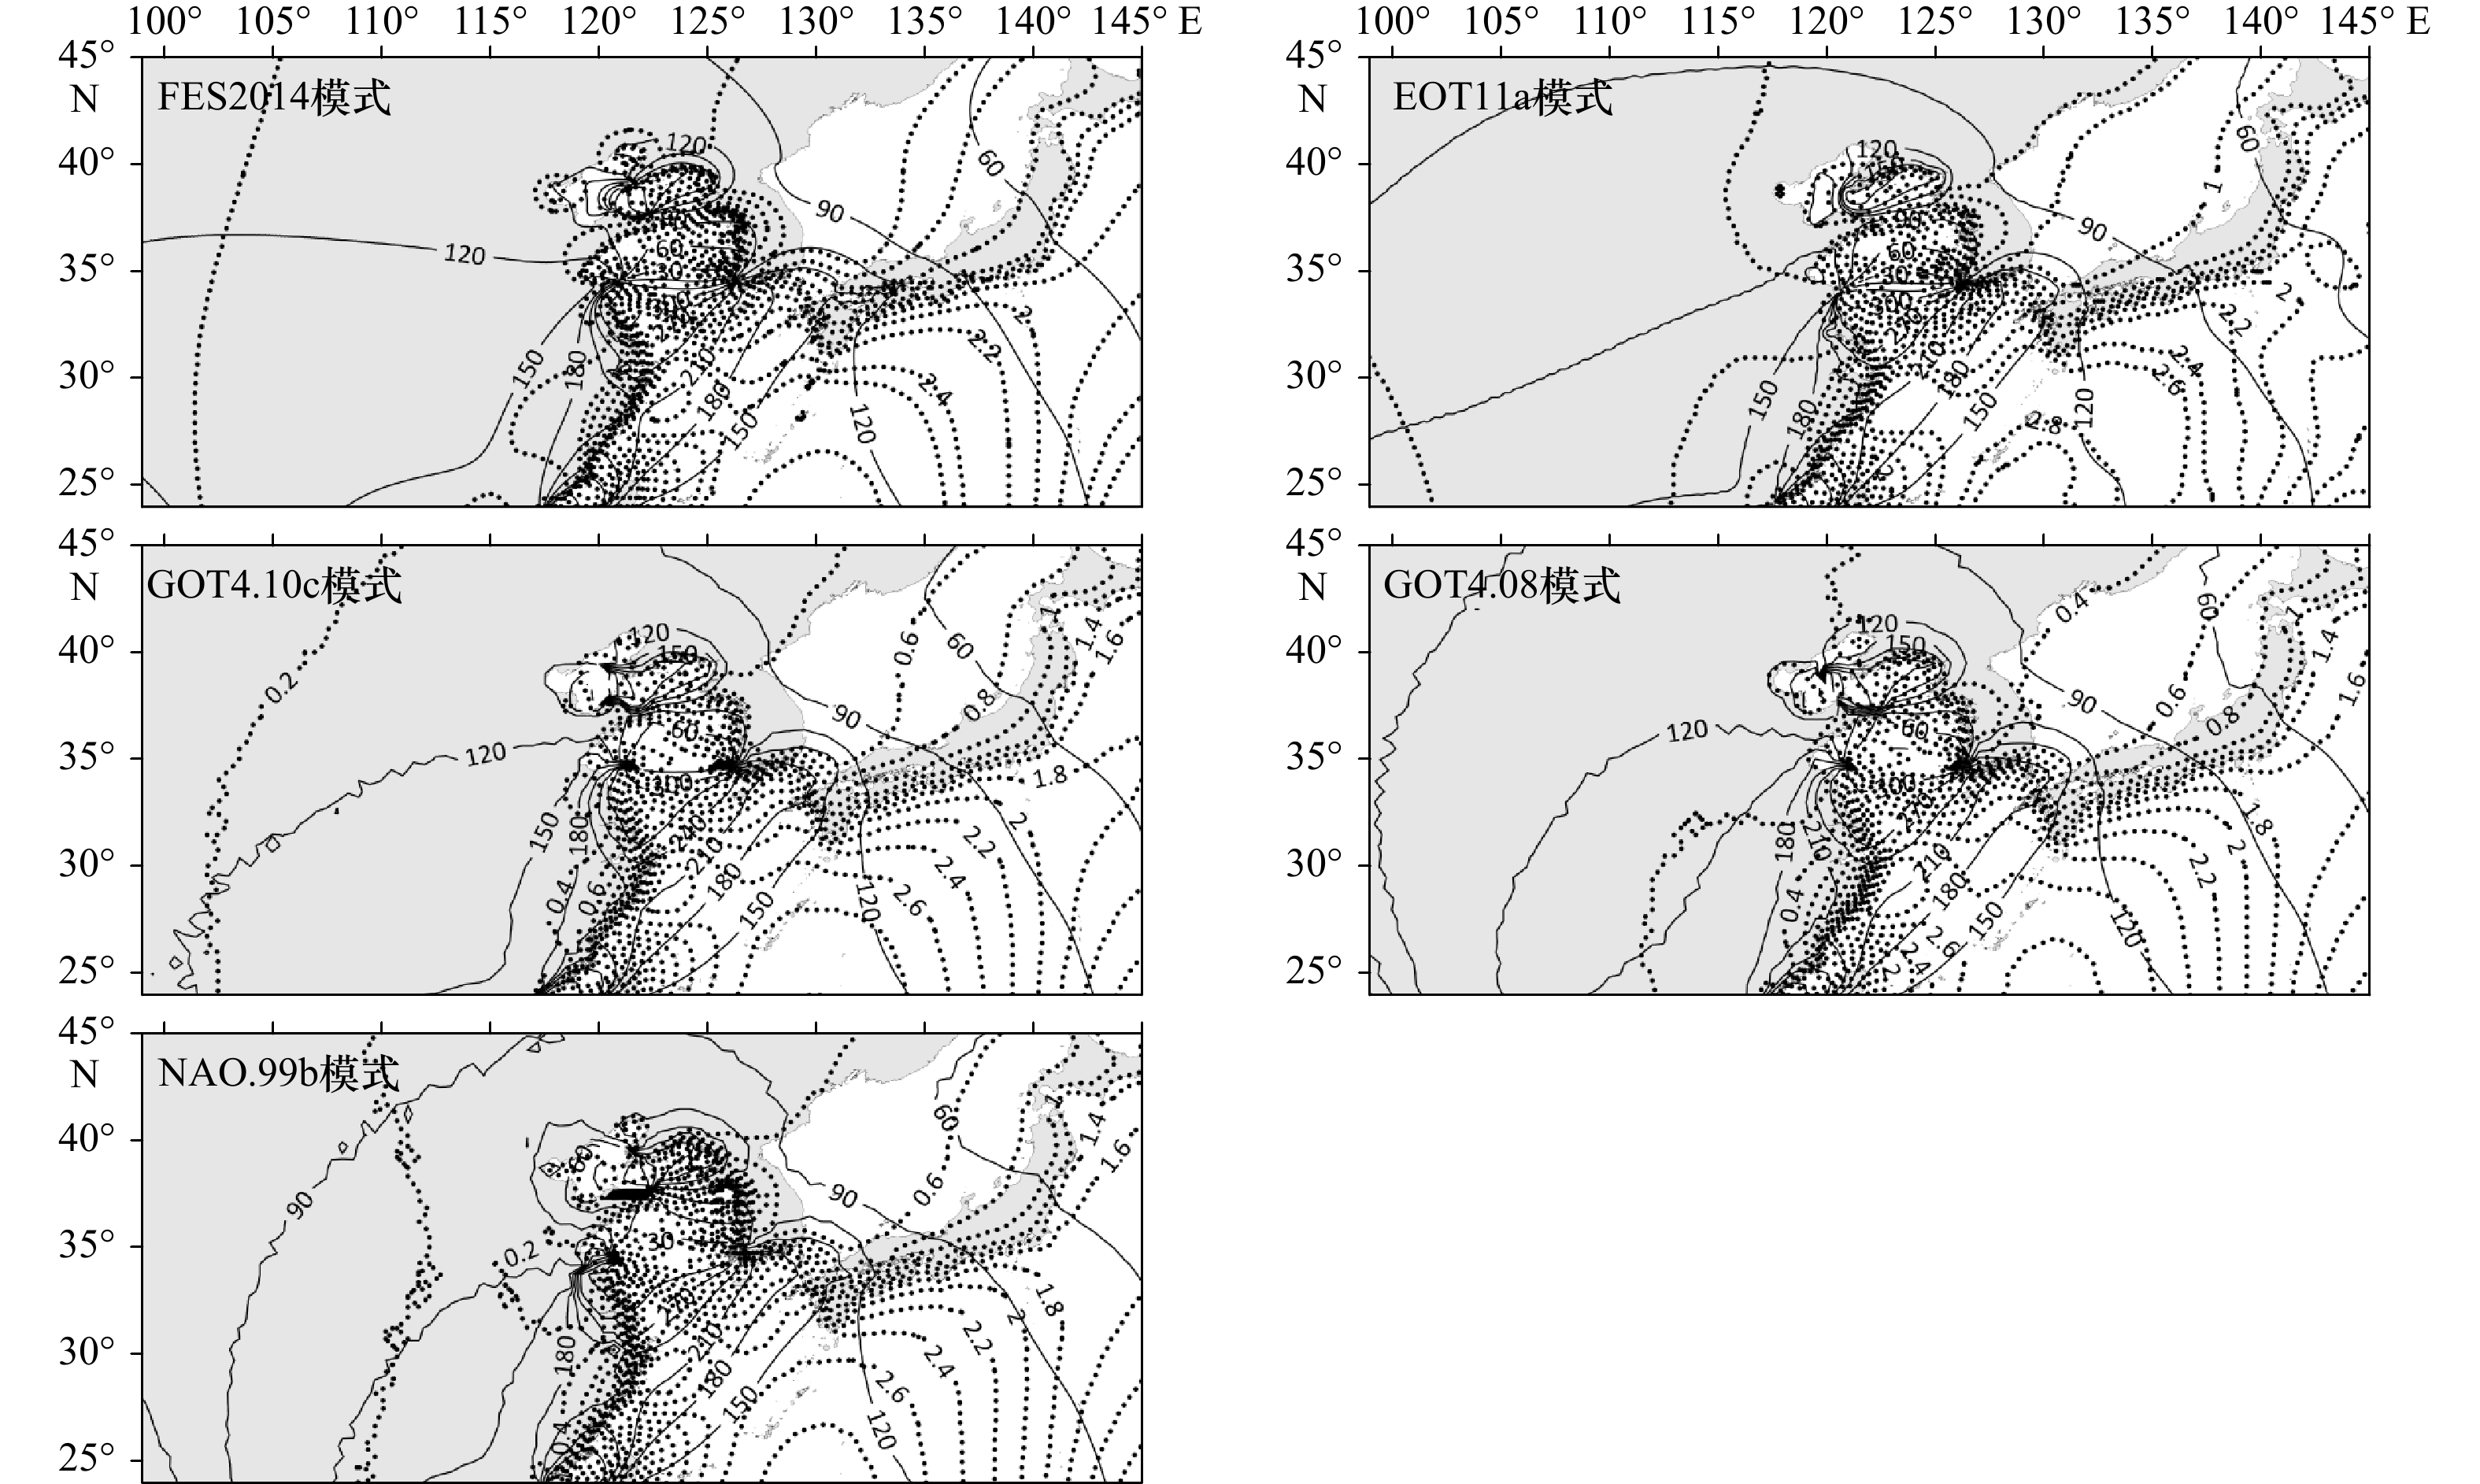
图 5 不同全球垂向位移负荷潮模式下K2分潮在渤海、黄海、东海及周边区域的同潮图
虚线为振幅(mm),实线为格林威治迟角(°)
Fig. 5 Co-tidal charts of K2 for different global vertical displacement loading tide models in the Bohai Sea, Yellow Sea, East China Sea and surrounding areas
Dashed lines indicate amplitude (mm), solid lines indicate Greenwich phase-lag (°)
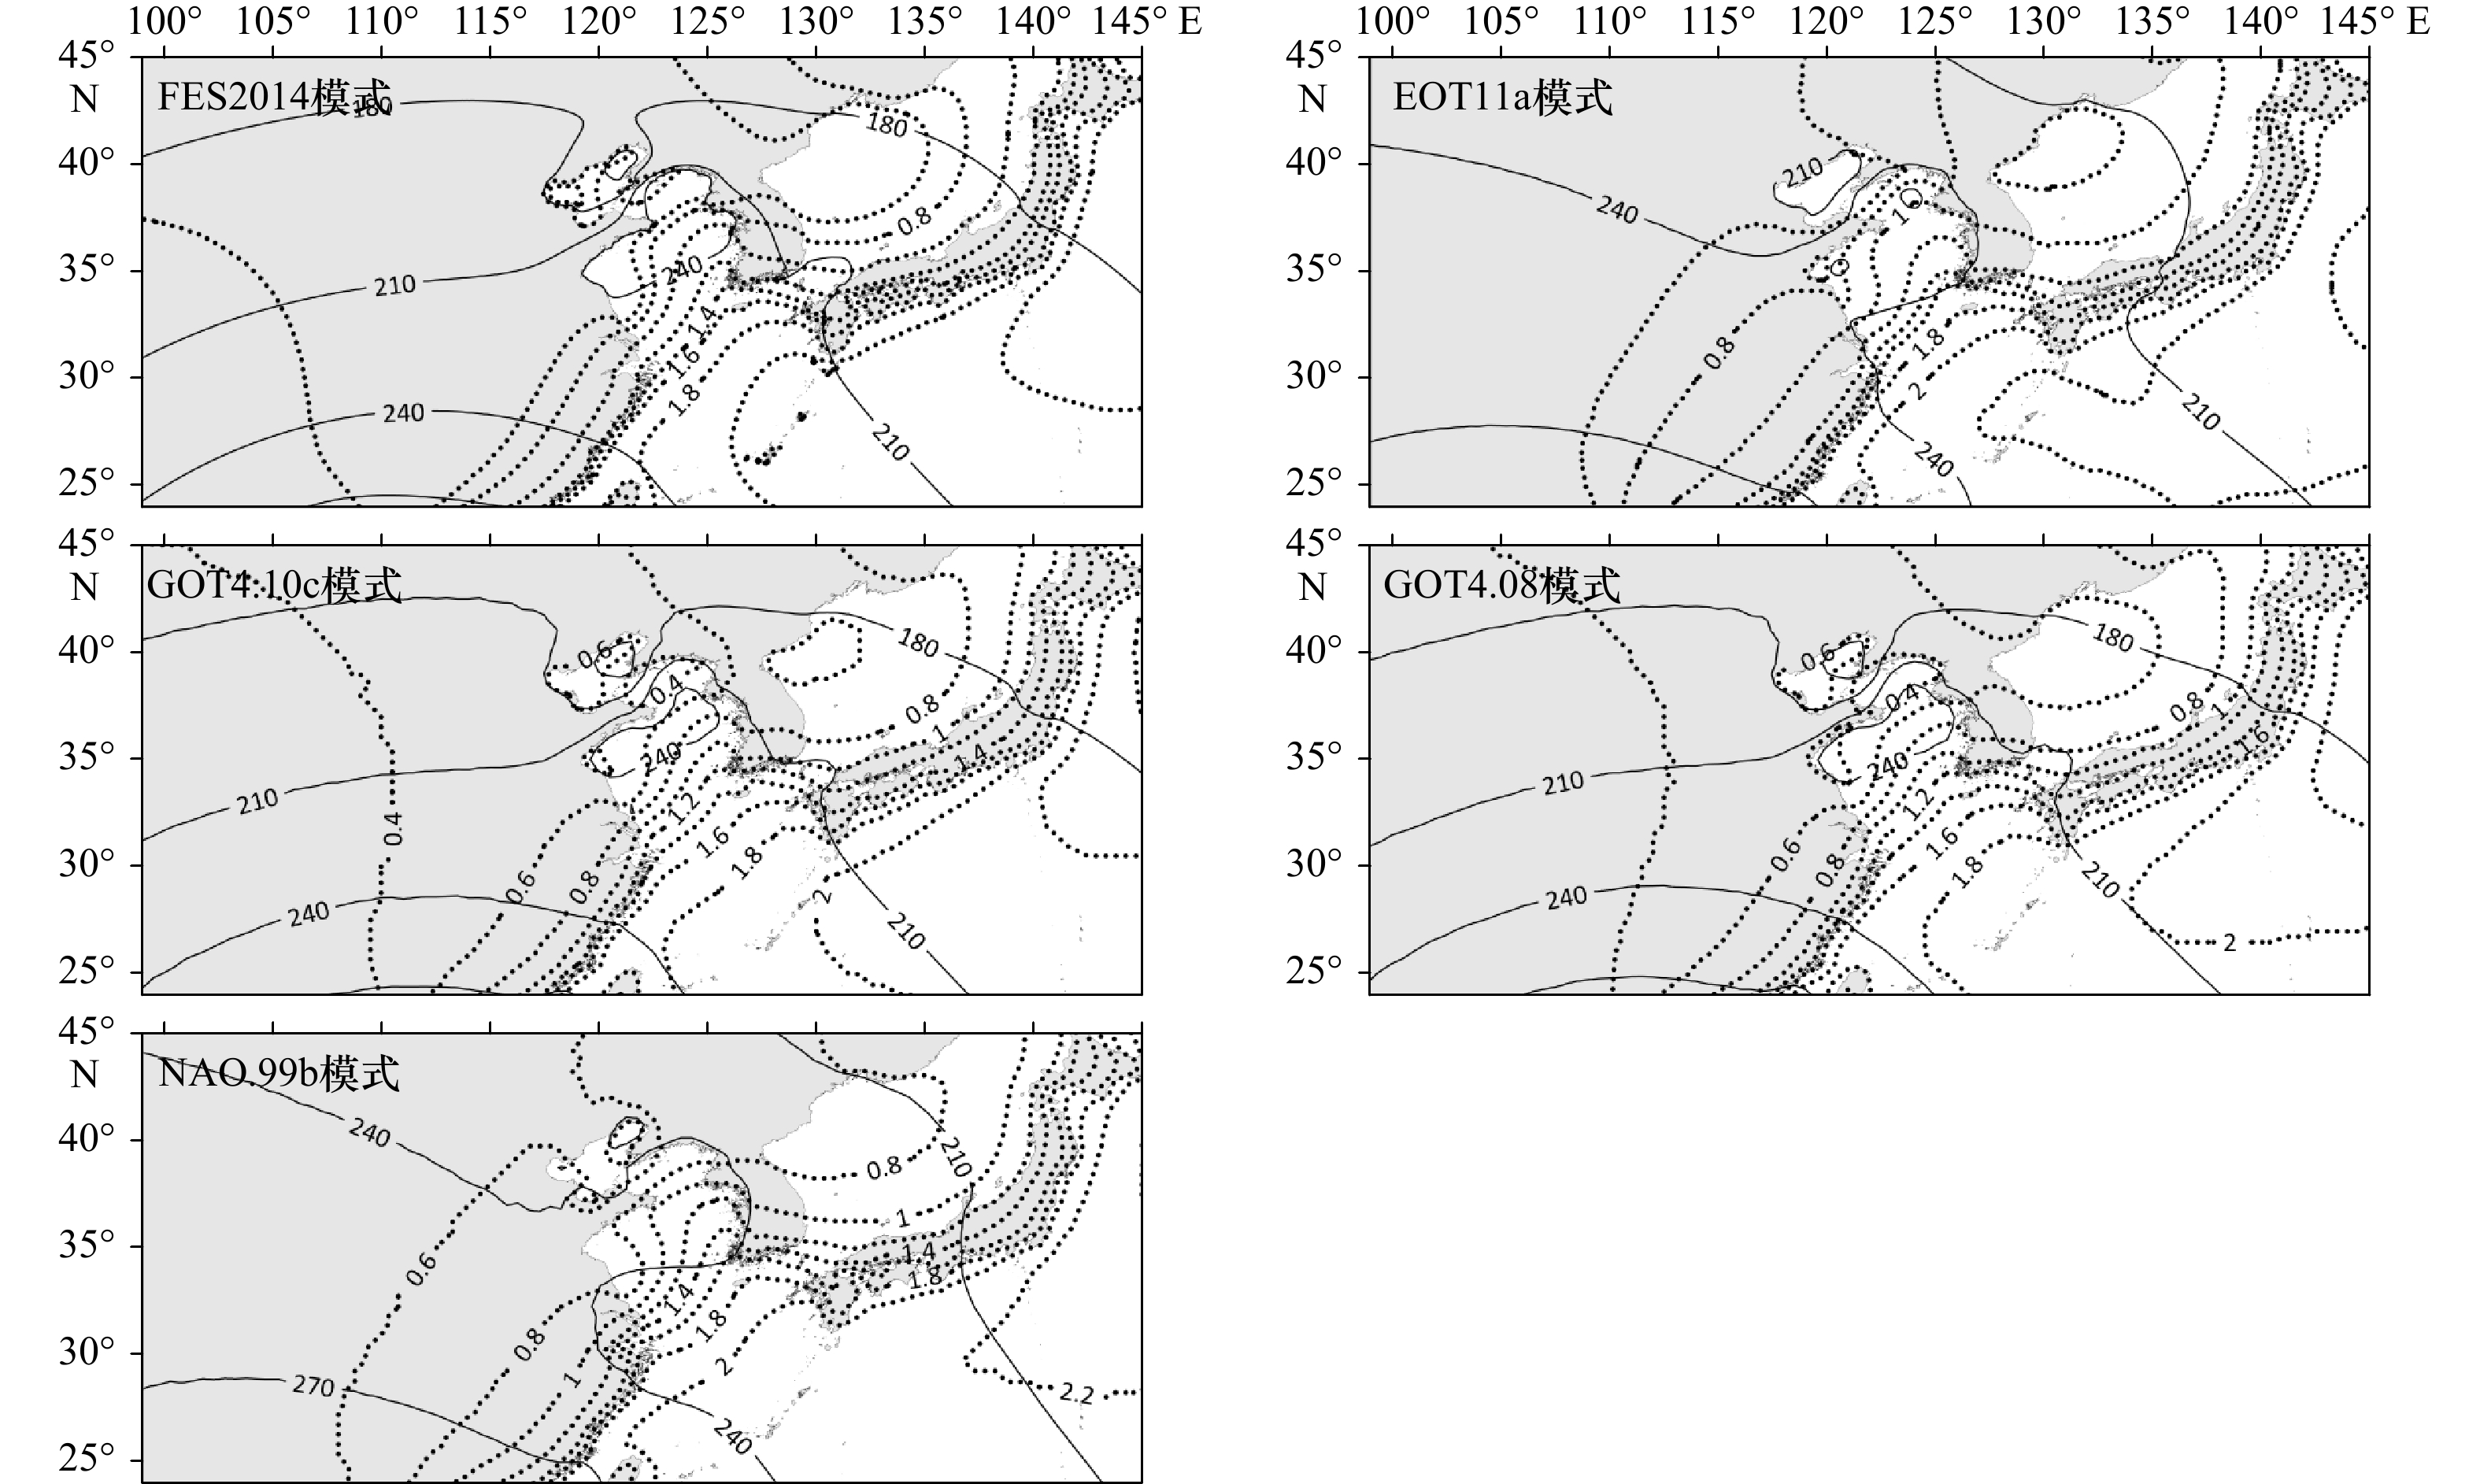
图 9 不同全球垂向位移负荷潮模式下Q1分潮在渤海、黄海、东海及周边区域的同潮图
虚线为振幅(mm),实线为格林威治迟角(°)
Fig. 9 Co-tidal charts of Q1 for different global vertical displacement loading tide models in the Bohai Sea, Yellow Sea, East China Sea and surrounding areas
Dashed lines indicate amplitude (mm), solid lines indicate Greenwich phase-lag (°)
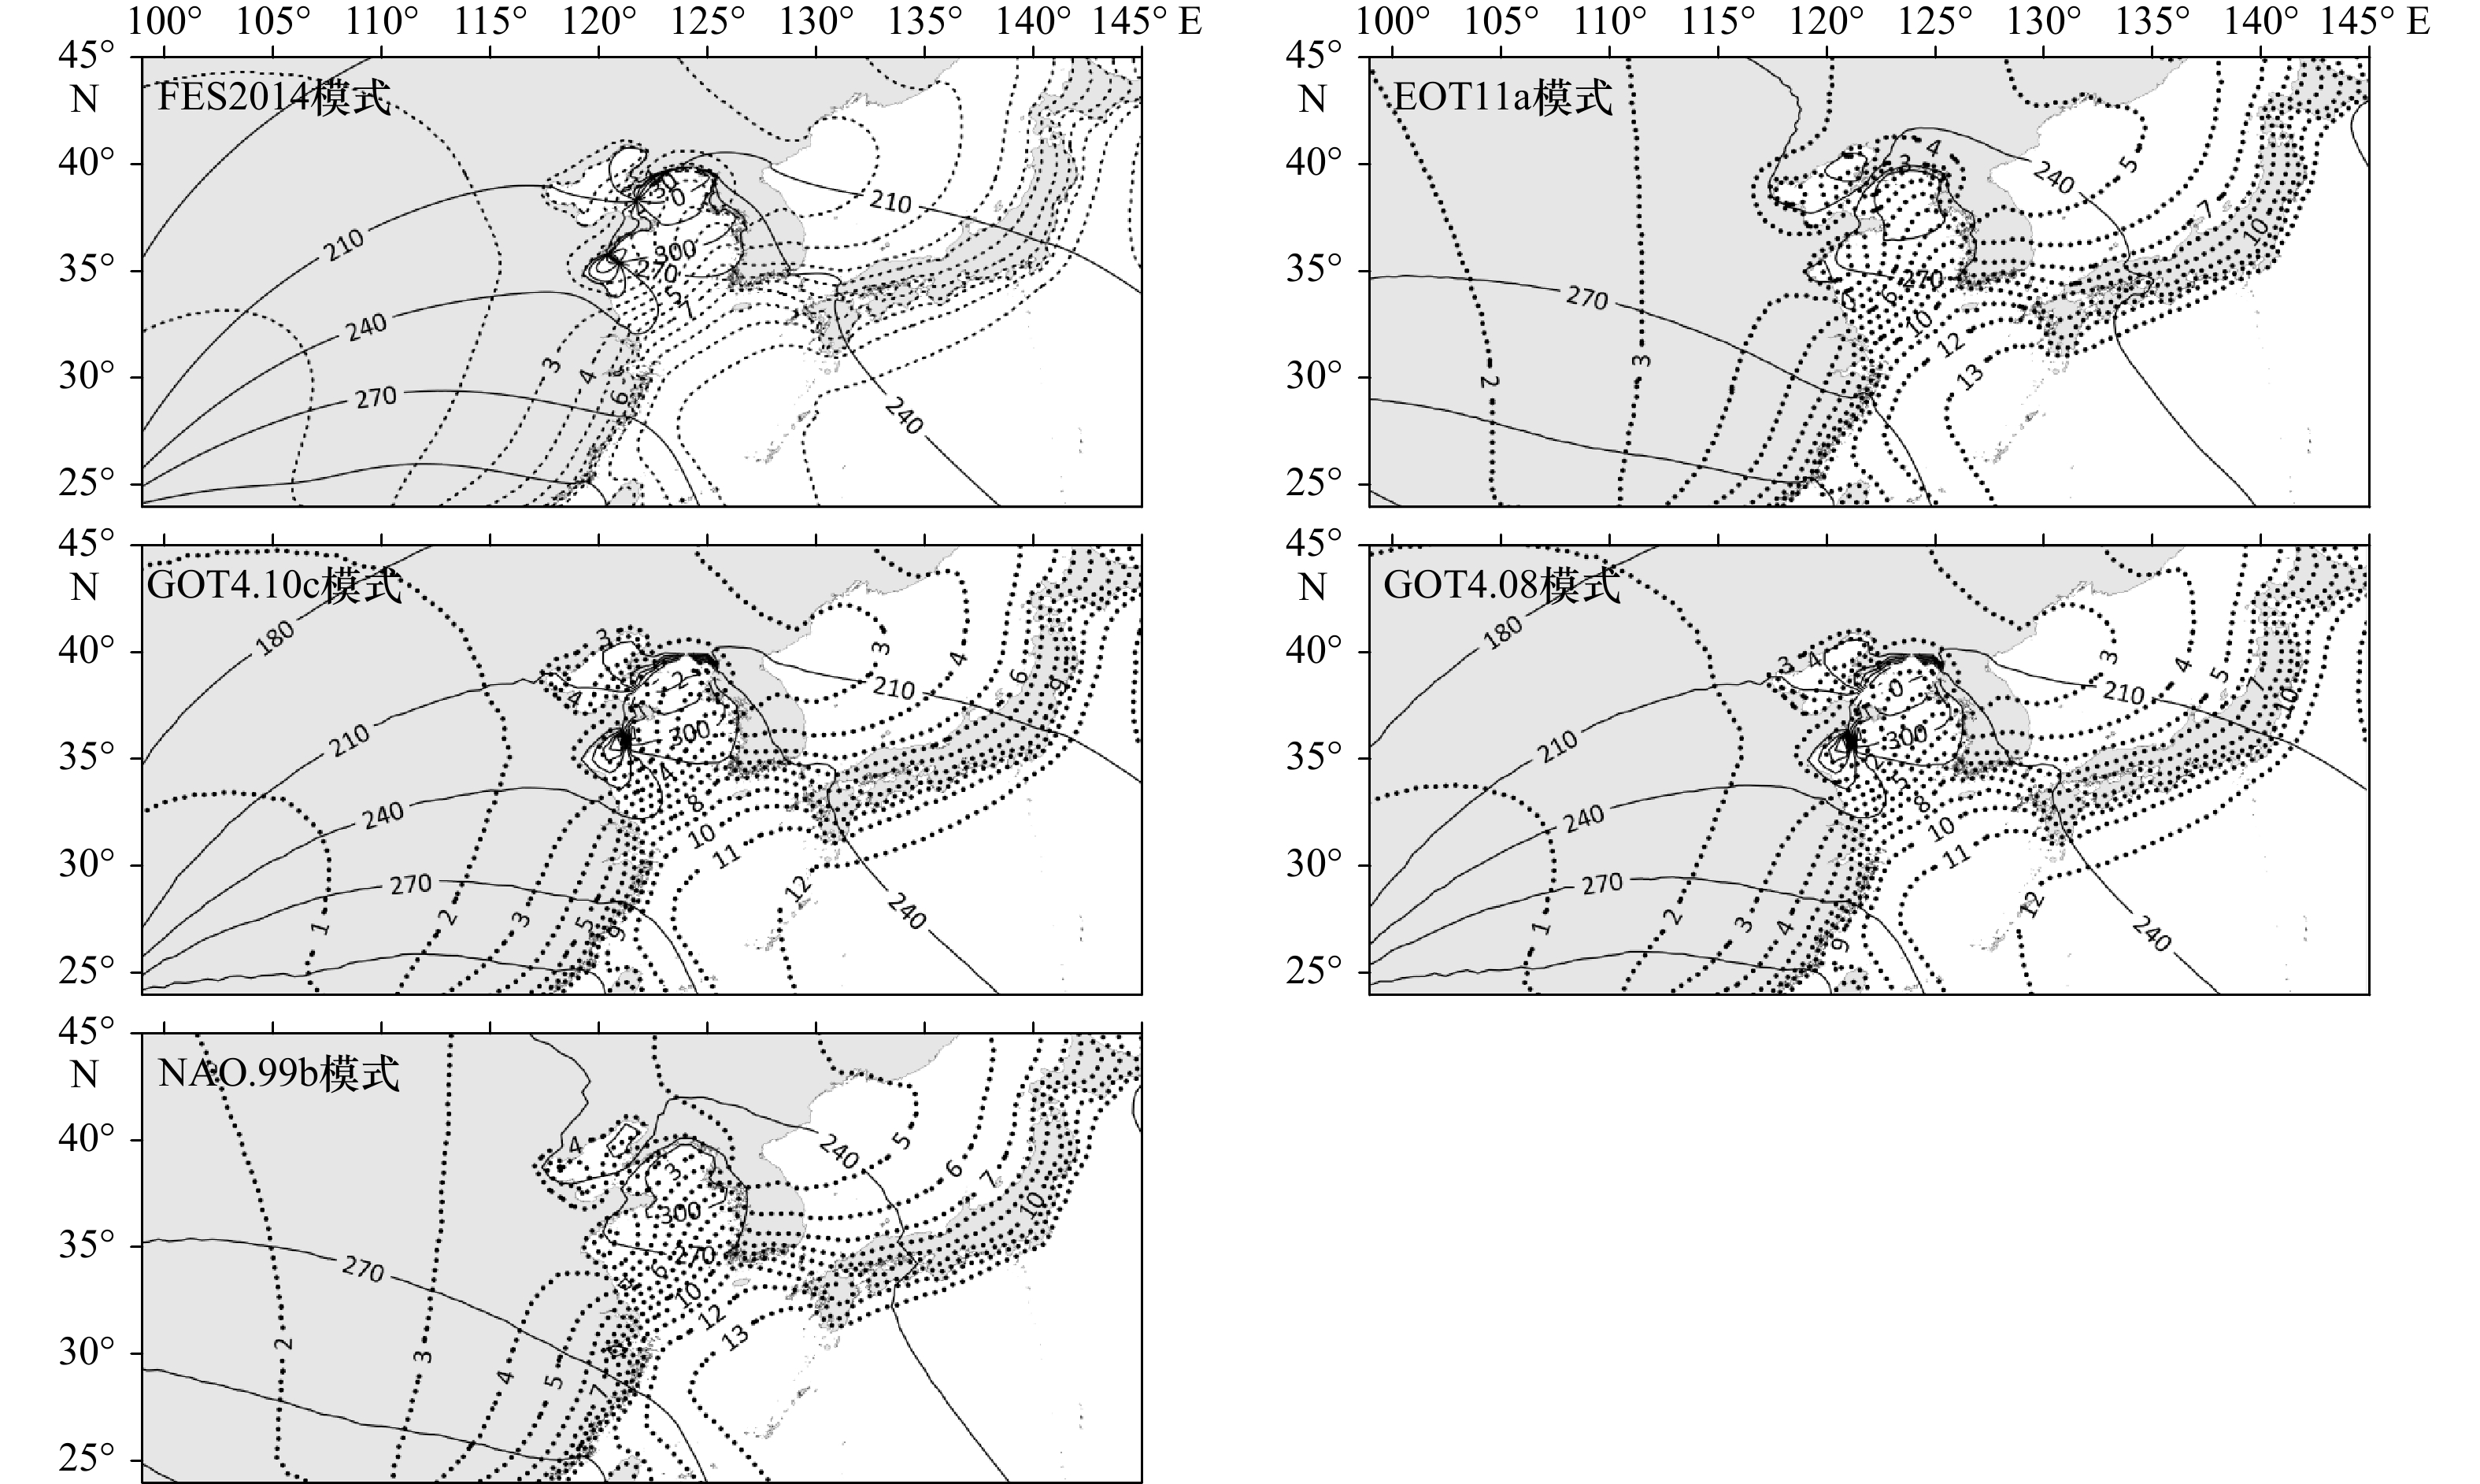
图 6 不同全球垂向位移负荷潮模式下K1分潮在渤海、黄海、东海及周边区域的同潮图
虚线为振幅(mm),实线为格林威治迟角(°)
Fig. 6 Co-tidal charts of K1 for different global vertical displacement loading tide models in the Bohai Sea, Yellow Sea, East China Sea and surrounding areas
Dashed lines indicate amplitude (mm), solid lines indicate Greenwich phase-lag (°)

图 7 不同全球垂向位移负荷潮模式下O1分潮在渤海、黄海、东海及周边区域的同潮图
虚线为振幅(mm),实线为格林威治迟角(°)
Fig. 7 Co-tidal charts of O1 for different global vertical displacement loading tide models in the Bohai Sea, Yellow Sea, East China Sea and surrounding areas
Dashed lines indicate amplitude (mm), solid lines indicate Greenwich phase-lag (°)

图 8 不同全球垂向位移负荷潮模式下P1分潮在渤海、黄海、东海及周边区域的同潮图
虚线为振幅(mm),实线为格林威治迟角(°)
Fig. 8 Co-tidal charts of P1 for different global vertical displacement loading tide models in the Bohai Sea, Yellow Sea, East China Sea and surrounding areas
Dashed lines indicate amplitude (mm), solid lines indicate Greenwich phase-lag (°)
表 1 全球垂向位移负荷潮模式介绍
Tab. 1 Introduction of global vertical displacement loading tide models
模式名称 研制机构 分辨率 构建方法 分潮 FES2014 法国潮汐小组
(FTG)(1/16)°×(1/16)° 同化模型 M2、S2、K1、O1、N2、P1、K2、Q1、J1、2N2、L2、T2、R2、Mu2、Nu2、La2、MKS2、E2、M3、N4、S4、M4、MN4、MS4、M6、M8、Mf、Mm、MSf、Msqm、Mtm、Sa、Ssa(共33个) EOT11a 德国地理学会(DGFI) (1/8)°×(1/8)° 经验模型 M2、S2、N2、K2、K1、O1、P1、Q1、S1、2N2、Mf、Mm、M4 (共13个) GOT4.10c 美国戈达德太空飞行中心(GSFC) (1/2)°×(1/2)° 经验模型 M2、S2、K1、O1、N2、P1、K2、Q1、S1、M4(共10个) GOT4.8 美国戈达德太空飞行中心(GSFC) (1/2)°×(1/2)° 经验模型 M2、S2、K1、O1、N2、P1、K2、Q1(共8个) NAO.99b 日本国立天文观测台(NAO) (1/2)°×(1/2)° 同化模型 M2、S2、K1、O1、N2、P1、K2、Q1、M1、J1、OO1、2N2、Mu2、Nu2、L2、T2、Mf、Mm、MSf、Msm、Mtm、Sa、Ssa (共23个)  下载: 导出CSV
表 2 渤海、黄海、东海及周边区域GPS站在CM参考系下8个主要分潮的调和常数
Tab. 2 Harmonic constants of eight principal tidal constituents under the CM reference frame in the Bohai Sea, Yellow Sea, East China Sea and surrounding areas
纬度 经度 观测时间长度/d M2 S2 N2 K2 K1 O1 P1 Q1 振幅 迟角 振幅 迟角 振幅 迟角 振幅 迟角 振幅 迟角 振幅 迟角 振幅 迟角 振幅 迟角 31.82°N 130.60°E 4 879 14.51 122.7 8.33 146.6 3.01 118.0 2.70 115.2 9.85 228.4 7.71 224.7 3.24 242.4 1.66 211.4 39.61°N 115.89°E 4 183 1.10 108.7 0.82 96.5 0.21 130.6 0.61 169.7 4.08 225.2 2.07 200.5 0.87 201.5 0.44 201.4 27.07°N 142.20°E 1 320 12.15 76.1 5.85 96.9 2.30 79.3 1.70 67.8 12.51 228.0 9.96 211.2 4.75 230.5 2.20 192.5 27.10°N 142.18°E 4 712 12.31 76.3 6.24 97.0 2.29 80.4 1.46 69.6 12.69 228.1 9.95 208.9 4.50 230.1 2.17 201.0 43.79°N 125.44°E 2 375 1.25 85.0 0.52 92.3 0.24 126.2 1.10 110.6 4.02 227.4 2.88 190.1 1.60 177.0 0.64 189.3 36.40°N 127.37°E 4 398 4.52 53.3 2.90 97.1 0.57 53.4 0.76 98.9 4.43 260.9 3.69 233.4 2.14 242.3 0.85 222.4 30.56°N 131.02°E 2 248 19.89 110.9 9.55 138.2 3.92 106.2 3.87 117.8 10.47 257.9 9.70 222.9 4.15 234.3 1.92 210.0 35.71°N 139.49°E 3 274 7.39 49.4 3.39 75.0 0.94 60.1 1.33 52.4 8.80 213.0 7.51 197.3 2.58 216.1 1.45 187.7 35.96°N 140.66°E 3 205 8.69 38.8 5.80 65.7 1.09 33.2 1.39 29.0 8.87 204.1 8.73 193.3 3.69 211.1 1.97 187.8 25.03°N 102.80°E 4 027 1.26 168.2 1.49 107.8 0.17 170.9 1.47 34.2 4.50 284.6 1.39 287.3 0.37 19.6 0.30 232.5 39.14°N 141.13°E 3 316 6.75 18.3 3.07 58.9 0.65 16.6 0.56 25.2 9.44 205.0 7.28 185.8 3.31 206.2 1.43 181.9 35.68°N 139.56°E 3 239 7.64 48.7 3.67 74.5 1.08 55.1 0.61 105.3 9.69 214.0 7.56 197.1 2.93 217.8 1.62 191.3 37.08°N 127.02°E 3 505 7.59 52.3 3.66 99.9 0.97 41.1 1.05 92.9 4.25 255.7 3.31 238.3 1.43 256.0 0.73 221.9 31.10°N 121.20°E 4 373 7.39 225.3 1.73 242.6 1.57 206.9 1.25 305.2 6.79 247.7 4.51 237.6 2.27 246.6 0.91 219.3 43.53°N 141.84°E 3 095 5.21 8.3 2.39 50.5 0.34 337.7 0.50 92.8 7.40 204.4 6.69 182.8 2.85 204.5 1.32 176.3 37.28°N 127.05°E 4 618 7.06 55.9 3.60 102.4 0.98 42.4 1.10 82.3 4.00 243.9 3.30 234.3 1.70 232.7 0.75 227.2 36.11°N 140.09°E 5 768 7.44 42.5 4.20 66.6 0.96 52.1 0.89 49.5 9.55 217.0 7.63 193.9 3.41 213.7 1.61 190.3 36.13°N 138.36°E 5 508 5.99 51.1 3.17 90.5 0.92 63.9 0.78 84.3 8.47 228.6 6.31 196.3 2.96 229.5 1.36 189.1 30.53°N 114.36°E 5 471 2.64 150.3 1.91 127.5 0.63 146.3 0.19 317.0 4.35 257.6 2.26 253.2 0.92 267.6 0.46 239.2 34.37°N 109.22°E 3 041 1.26 144.0 1.04 117.7 0.22 156.9 0.73 184.0 2.08 254.2 1.38 228.2 0.86 163.7 0.41 195.8 24.80°N 120.99°E 3 150 12.53 216.5 4.04 221.3 3.02 192.9 1.02 178.8 7.14 287.2 7.52 268.3 2.53 290.8 1.54 250.0 注:振幅单位为mm,迟角是格林威治迟角,单位为(°)。
下载: 导出CSV
表 3 渤海、黄海、东海及周边区域GPS站在CF参考系下8个主要分潮的调和常数
Tab. 3 Harmonic constants of eight principal tidal constituents under the CF reference frame in the Bohai Sea, Yellow Sea, East China Sea and surrounding areas
纬度 经度 观测时间长度/d M2 S2 N2 K2 K1 O1 P1 Q1 振幅 迟角 振幅 迟角 振幅 迟角 振幅 迟角 振幅 迟角 振幅 迟角 振幅 迟角 振幅 迟角 31.82°N 130.60°E 4 879 15.87 123.4 8.48 147.5 3.40 117.8 2.69 115.3 11.05 234.8 8.69 230.0 3.73 247.1 1.81 216.8 39.61°N 115.89°E 4 183 2.22 113.1 0.91 99.2 0.55 114.9 0.57 167.7 5.22 245.6 2.76 232.4 1.10 238.7 0.57 227.8 27.07°N 142.20°E 1 320 13.00 81.9 5.80 100.0 2.61 85.2 1.68 68.5 13.95 231.7 10.91 215.2 5.25 233.6 2.33 196.7 27.10°N 142.18°E 4 712 13.16 82.0 6.19 100.0 2.61 86.1 1.44 70.5 14.14 231.7 10.87 213.1 5.00 233.4 2.33 204.7 43.79°N 125.44°E 2 375 2.44 98.1 0.65 100.4 0.61 111.7 1.12 108.3 5.75 247.6 3.55 218.6 1.58 206.4 0.76 211.5 36.40°N 127.37°E 4 398 5.10 67.2 2.95 99.9 0.84 76.0 0.76 97.7 6.29 266.8 4.90 243.2 2.68 250.8 1.05 231.6 30.56°N 131.02°E 2 248 21.17 112.3 9.67 139.2 4.30 107.2 3.86 117.9 12.00 260.0 10.62 227.1 4.57 238.6 2.06 214.6 35.71°N 139.49°E 3 274 7.89 59.5 3.34 78.9 1.23 74.6 1.34 53.1 10.15 223.4 8.32 206.5 3.07 227.2 1.58 196.4 35.96°N 140.66°E 3 205 8.94 48.1 5.72 67.9 1.23 51.4 1.39 29.8 10.01 215.8 9.48 201.8 4.13 219.9 2.10 194.4 25.03°N 102.80°E 4 027 2.16 158.7 1.45 108.6 0.46 138.0 1.47 31.6 5.24 292.8 2.25 295.9 0.65 356.4 0.40 259.0 39.14°N 141.13°E 3 316 6.65 30.6 3.01 63.0 0.75 47.8 0.58 28.1 10.67 217.1 7.90 197.6 3.73 217.6 1.54 192.0 35.68°N 139.56°E 3 239 8.13 58.6 3.62 78.2 1.33 69.3 0.63 105.2 11.05 223.4 8.38 206.3 3.42 227.5 1.76 198.8 37.08°N 127.02°E 3 505 8.11 60.9 3.72 102.0 1.17 59.0 1.06 91.9 6.10 263.6 4.59 247.8 2.05 263.7 0.93 232.7 31.10°N 121.20°E 4 373 7.46 215.8 1.83 239.2 1.61 193.3 1.27 305.1 7.94 254.2 5.44 245.1 2.66 253.4 1.04 228.6 43.53°N 141.84°E 3 095 5.08 24.2 2.36 55.7 0.34 46.0 0.56 91.2 8.79 221.2 7.27 197.2 3.29 219.3 1.42 188.7 37.28°N 127.05°E 4 618 7.66 64.8 3.67 104.5 1.18 59.8 1.11 81.4 5.72 256.0 4.55 245.0 2.20 245.7 0.97 236.5 36.11°N 140.09°E 5 768 7.80 53.0 4.12 69.6 1.21 68.3 0.90 50.5 11.04 226.2 8.39 203.4 3.87 222.9 1.75 198.0 36.13°N 138.36°E 5 508 6.56 63.0 3.19 94.5 1.22 77.6 0.80 84.5 10.18 236.9 7.11 207.4 3.54 237.3 1.49 198.3 30.53°N 114.36°E 5 471 3.74 145.7 1.95 129.8 0.96 135.5 0.22 315.7 5.41 266.7 3.23 263.5 1.32 277.3 0.63 252.3 34.37°N 109.22°E 3 041 2.25 136.2 1.08 117.9 0.52 128.4 0.69 185.3 3.35 274.5 2.27 256.9 0.58 200.7 0.47 225.3 24.80°N 120.99°E 3 150 12.98 211.0 4.23 220.9 3.17 186.4 1.02 181.6 8.08 287.5 8.34 269.3 2.85 290.6 1.69 252.5 注:振幅单位为mm,迟角是格林威治迟角,单位为(°)。
下载: 导出CSV
表 4 各模式与渤海、黄海、东海及周边区域GPS站调和常数的标准差及拟合度
Tab. 4 The standard deviations and fitting degrees of the harmonic constants between each model values and GPS observations in Bohai Sea, Yellow Sea, East China Sea and surrounding areas
FES2014 EOT11a GOT4.10c GOT4.8 NAO.99b M2 ${ \Delta H }$/mm 0.47 0.56 0.88 0.85 0.94 ${ \Delta g }$/(°) 19.71 2.94 5.74 5.65 10.22 ${ \sigma }$/mm 0.71 0.90 1.71 1.69 1.88 ${ {r^2} }$/% 99.12 98.62 94.85 95.01 93.81 S2 ${ \Delta H }$/mm 0.70 0.69 0.75 0.76 0.53 ${ \Delta g }$/(°) 7.20 6.95 9.39 8.24 6.14 ${ \sigma }$/mm 1.09 1.08 1.12 1.13 0.83 ${ {r^2} }$/% 89.16 89.22 88.51 88.28 93.66 K1 ${ \Delta H }$/mm 1.06 1.03 1.06 1.08 1.63 ${ \Delta g }$/(°) 9.58 6.44 10.13 10.41 12.18 ${ \sigma }$/mm 1.79 1.75 1.84 1.85 2.53 ${ {r^2} }$/% 81.13 83.63 80.11 79.86 62.39 O1 ${ \Delta H }$/mm 0.24 0.18 0.13 0.17 1.02 ${ \Delta g }$/(°) 5.51 1.49 6.02 4.90 11.36 ${ \sigma }$/mm 0.52 0.31 0.49 0.43 1.55 ${ {r^2} }$/% 97.95 99.34 98.20 98.61 81.99 N2 ${ \Delta H }$/mm 0.16 0.10 0.18 0.17 0.35 ${ \Delta g }$/(°) 9.28 4.43 13.37 12.17 16.23 ${ \sigma }$/mm 0.23 0.17 0.31 0.30 0.47 ${ {r^2} }$/% 97.37 98.67 95.18 95.51 89.01 K2 ${ \Delta H }$/mm 0.43 0.45 0.47 0.47 0.38 ${ \Delta g }$/(°) 37.74 38.45 37.88 37.77 38.06 ${ \sigma }$/mm 0.78 0.80 0.80 0.82 0.78 ${ {r^2} }$/% 56.18 53.71 54.06 52.03 56.84 P1 ${ \Delta H }$/mm 0.41 0.30 0.41 0.37 0.28 ${ \Delta g }$/(°) 13.19 10.24 13.02 13.04 19.39 ${ \sigma }$/mm 0.58 0.50 0.58 0.55 0.72 ${ {r^2} }$/% 86.98 91.24 86.94 88.17 79.71 Q1 ${ \Delta H }$/mm 0.06 0.08 0.05 0.07 0.16 ${ \Delta g }$/(°) 6.52 5.14 8.34 8.16 18.24 ${ \sigma }$/mm 0.15 0.16 0.17 0.16 0.39 ${ {r^2} }$/% 95.77 95.31 94.55 94.73 69.98
下载: 导出CSV
表 5 EOT11a垂向位移负荷潮模式分区域准确度分析
Tab. 5 Accuracy analysis of EOT11a vertical displacement loading tide model in different regions
中国大陆 日本岛 朝鲜半岛 M2 ${ \Delta H }$/mm 0.31 0.70 1.04 ${ \Delta g }$/(°) 4.69 1.68 2.47 ${ \sigma }$/mm 0.82 0.91 1.10 S2 ${ \Delta H }$/mm 0.70 0.99 0.07 ${ \Delta g }$/(°) 10.83 4.66 3.33 ${ \sigma }$/mm 0.94 1.35 0.21 K1 ${ \Delta H }$/mm 1.60 0.84 0.60 ${ \Delta g }$/(°) 9.19 6.18 4.67 ${ \sigma }$/mm 1.97 1.94 0.84 O1 ${ \Delta H }$/mm 0.17 0.25 0.08 ${ \Delta g }$/(°) 1.47 1.57 1.60 ${ \sigma }$/mm 0.23 0.39 0.17 N2 ${ \Delta H }$/mm 0.08 0.12 0.11 ${ \Delta g }$/(°) 3.69 6.18 2.40 ${ \sigma }$/mm 0.14 0.20 0.12 K2 ${ \Delta H }$/mm 0.50 0.59 0.07 ${ \Delta g }$/(°) 77.81 23.43 6.07 ${ \sigma }$/mm 0.91 0.88 0.18 P1 ${ \Delta H }$/mm 0.19 0.30 0.51 ${ \Delta g }$/(°) 22.30 3.58 7.37 ${ \sigma }$/mm 0.52 0.46 0.60 Q1 ${ \Delta H }$/mm 0.08 0.07 0.06 ${ \Delta g }$/(°) 9.50 2.36 3.70 ${ \sigma }$/mm 0.18 0.13 0.10
下载: 导出CSV
-
[1] Shum C K, Woodworth P L, Andersen O B, et al. Accuracy assessment of recent ocean tide models[J]. Journal of Geophysical Research: Oceans, 1997, 102(C11): 25173−25194. doi: 10.1029/97JC00445 [2] Seifi F, Deng Xiaoli, Andersen O B. Assessment of the accuracy of recent empirical and assimilated tidal models for the great barrier reef, Australia, using satellite and coastal data[J]. Remote Sensing, 2019, 11(10): 1211. doi: 10.3390/rs11101211 [3] Fang Guohong, Xu Xiaoqing, Wei Zexun, et al. Vertical displacement loading tides and self-attraction and loading tides in the Bohai, Yellow, and East China Seas[J]. Science China Earth Sciences, 2013, 56(1): 63−70. doi: 10.1007/s11430-012-4518-9 [4] 徐晓庆, 魏泽勋, 滕飞, 等. 南海及邻近海峡垂向位移负荷潮和自吸−负荷潮[J]. 海洋学报, 2022, 44(7): 44−51.Xu Xiaoqing, Wei Zexun, Teng Fei, et al. Vertical displacement loading tides and self-attraction and loading tides in the South China Sea and adjacent straits[J]. Haiyang Xuebao, 2022, 44(7): 44−51. [5] Fu L L, Cazenave A. Satellite altimetry and earth sciences: a handbook of techniques and applications[R]. San Diego: Academic Press, 2001: 1−463. [6] Visser P N A M, Sneeuw N, Reubelt T, et al. Space-borne gravimetric satellite constellations and ocean tides: aliasing effects[J]. Geophysical Journal International, 2010, 181(2): 789−805. [7] Iliffe J C, Ziebart M K, Turner J F, et al. Accuracy of vertical datum surfaces in coastal and offshore zones[J]. Survey Review, 2013, 45(331): 254−262. doi: 10.1179/1752270613Y.0000000040 [8] Keysers J H, Quadros N D, Collier P A. Vertical datum transformations across the Australian littoral zone[J]. Journal of Coastal Research, 2015, 31(1): 119−128. doi: 10.2112/JCOASTRES-D-12-00228.1 [9] Ito T, Okubo M, Sagiya T. High resolution mapping of Earth tide response based on GPS data in Japan[J]. Journal of Geodynamics, 2009, 48(3/5): 253−259. [10] Khan S A, Tscherning C C. Determination of semi-diurnal ocean tide loading constituents using GPS in Alaska[J]. Geophysical Research Letters, 2001, 28(11): 2249−2252. doi: 10.1029/2000GL011890 [11] King M A, Penna N T, Clarke P J, et al. Validation of ocean tide models around Antarctica using onshore GPS and gravity data[J]. Journal of Geophysical Research, 2005, 110(B8): B08401. [12] Vergnolle M, Bouin M N, Morel L, et al. GPS estimates of ocean tide loading in NW-France: determination of ocean tide loading constituents and comparison with a recent ocean tide model[J]. Geophysical Journal of the Royal Astronomical Society, 2010, 173(2): 444−458. [13] Yeh T K, Hwang C, Huang Jiufu, et al. Vertical displacement due to ocean tidal loading around Taiwan based on GPS observations[J]. Terrestrial, Atmospheric and Oceanic Sciences, 2011, 22(4): 373−382. doi: 10.3319/TAO.2011.01.27.01(T) [14] Yuan Linguo, Chao B F, Ding Xiaoli, et al. The tidal displacement field at Earth’s surface determined using global GPS observations[J]. Journal of Geophysical Research: Solid Earth, 2013, 118(5): 2618−2632. doi: 10.1002/jgrb.50159 [15] Lyard F H, Allain D J, Cancet M, et al. FES2014 global ocean Tide Atlas: design and performance[J]. Ocean Science, 2020, 17(3): 615−649. [16] Savcenko R, Bosch W. EOT11A-empirical ocean tide model from multi-mission satellite altimetry[R]. Munich, Germany: Deutsches Geodätisches Forschungsinstitut, 2012: 49. [17] Ray R D. Precise comparisons of bottom-pressure and Altimetric Ocean tides[J]. Journal of Geophysical Research: Oceans, 2013, 118(9): 4570−4584. doi: 10.1002/jgrc.20336 [18] Matsumoto K, Takanezawa T, Ooe M. Ocean tide models developed by assimilating TOPEX/POSEIDON altimeter data into hydrodynamical model: a global model and a regional model around Japan[J]. Journal of Oceanography, 2000, 56(5): 567−581. doi: 10.1023/A:1011157212596 -

计量
- 文章访问数: 679
- HTML全文浏览量: 160
- PDF下载量: 49
- 被引次数: 0
