

Analysis on the characteristics of the temporal and spatial variation of near-surface meteorological parameters affecting the navigation in Arctic passage in summer
-
摘要: 本文利用ERA5再分析数据和我国北极科学考察期间获取的走航气象观测数据,分析了夏季影响船舶通航北极航道的关键近地面气象要素的时空变化特征。结果表明,7–8月的天气条件最适宜船舶在北极航道航行,9月低温、大风和大浪天气显著增多,对船舶航行影响较大,10月的天气更加恶劣,对船舶航行的挑战更大。低温天气主要出现在各航道的中段,大风和大浪天气集中在航道两端的海域。除北极中心区和10月的挪威海和巴伦支海以外,其余时间的海域出现大风和大浪天气的概率以增加趋势为主,但具有较大的年际变化。根据现有北极航道气象观测数据分析发现,东北航道能见度最差,西北航道能见度最好,中央航道居中。Abstract: Based on the ERA5 reanalysis data and the meteorological observation data obtained during Chinese Arctic Research Expeditions, the temporal and spatial variation characteristics of the key near-surface meteorological parameters that influence ship navigation in the Arctic passages in summer are analyzed. The results show that the weather conditions in July and August are the most suitable for ship navigation in the Arctic passages. The low temperature, strong wind and huge wave weather increase significantly in September, which impacts ship navigation greatly. The weather in October is even worse, posing a quit challenge to ship navigation. Low temperature mainly occurs in the middle of each passage, and strong wind and huge wave are concentrated in the areas at both ends of the passages. Both the strong wind probability and huge wave probability show a decreasing tendency in the entire Arctic passages in summer with large interannual changes except for the Norwegian Sea and Barents Sea in October and the central Arctic in summer. According to the observation data, it is found that the northeast passage has the poorest visibility, the northwest passage has the best visibility, and the trans-Arctic passage has moderate visibility.
-
Key words:
- Arctic passage /
- temperature /
- wind speed /
- significant wave height /
- visibility
-
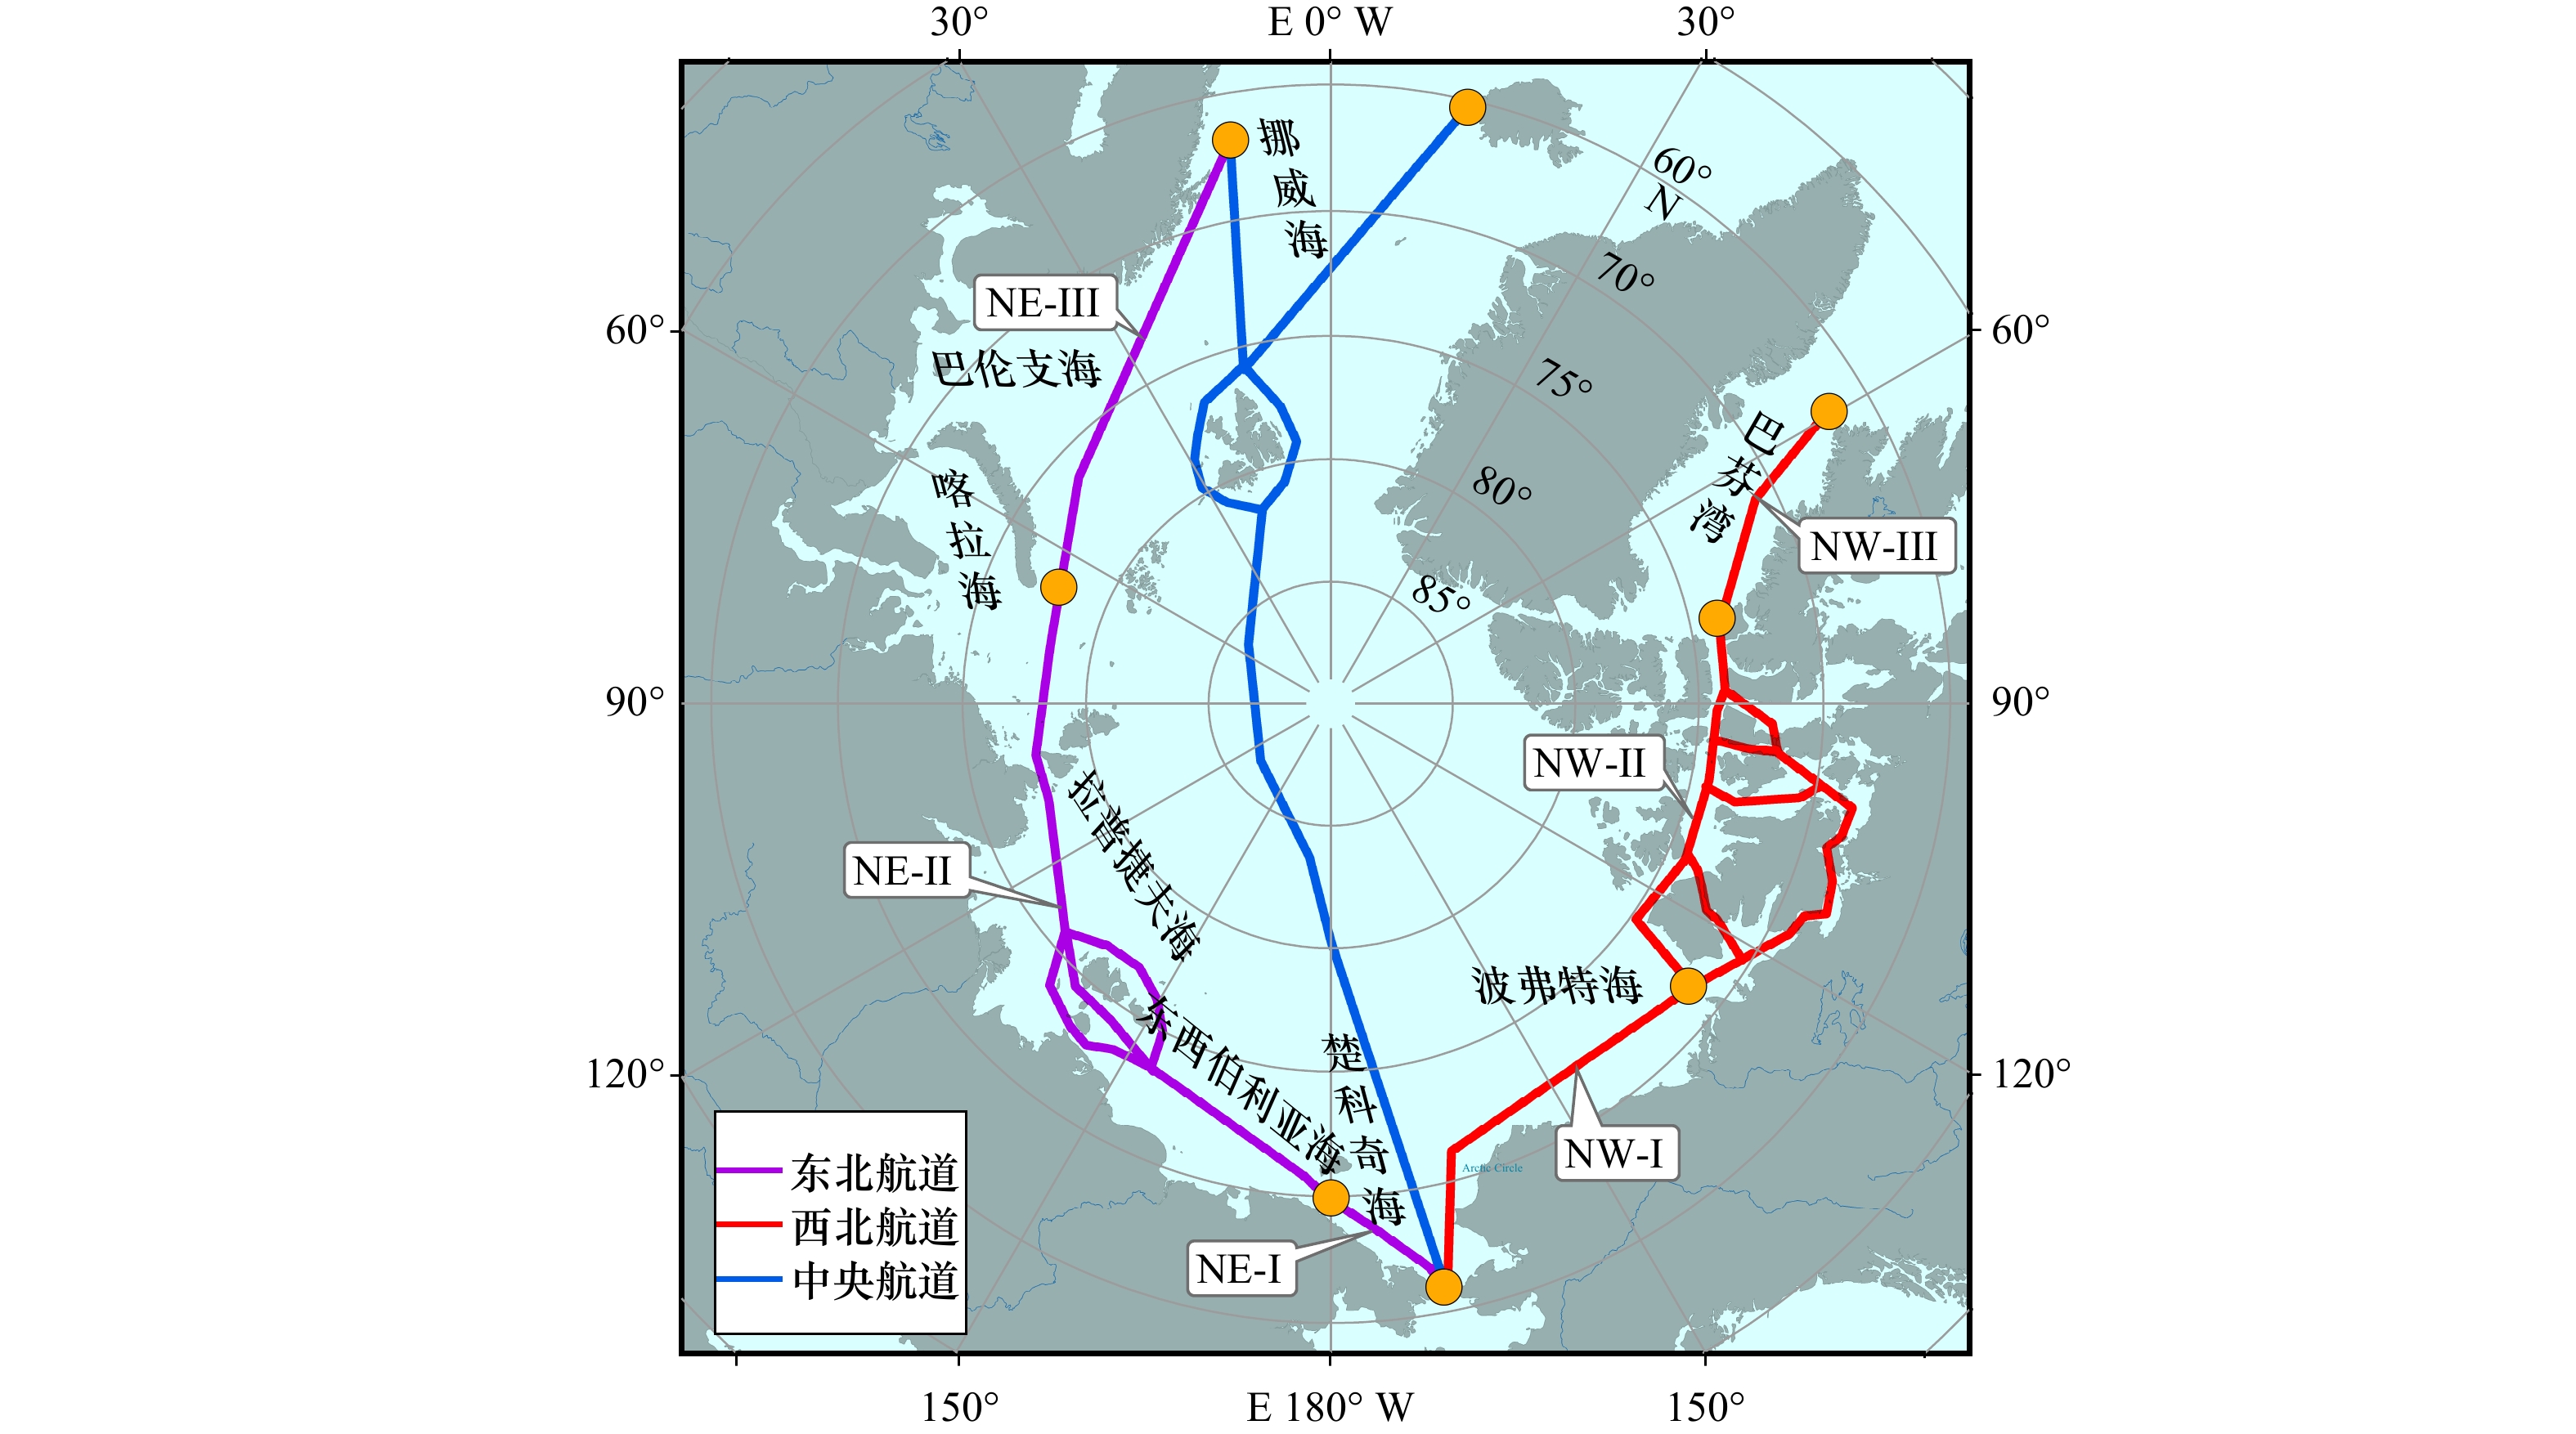
图 1 北极东北航道(紫色实线)、西北航道(红色实线)和中央航道(蓝色实线)
NE-I、NE-II和NE-III分别为北极东北航道的3个航段,NW-I、NW-II和NW-III分别为北极西北航道的3个航段,橙色圆点表示相应航段的起止点
Fig. 1 Arctic northeast passage (purple solid line), northwest passage (red solid line) and trans-Arctic passage (blue solid line)
NE-I, NE-II and NE-III denote the three segments of the Arctic northeast passage, respectively. NW-I, NW-II and NW-III denote the three segments of the Arctic northwest passage, respectively. The orange dots denote the starting and ending locations of the corresponding segments of the three passages
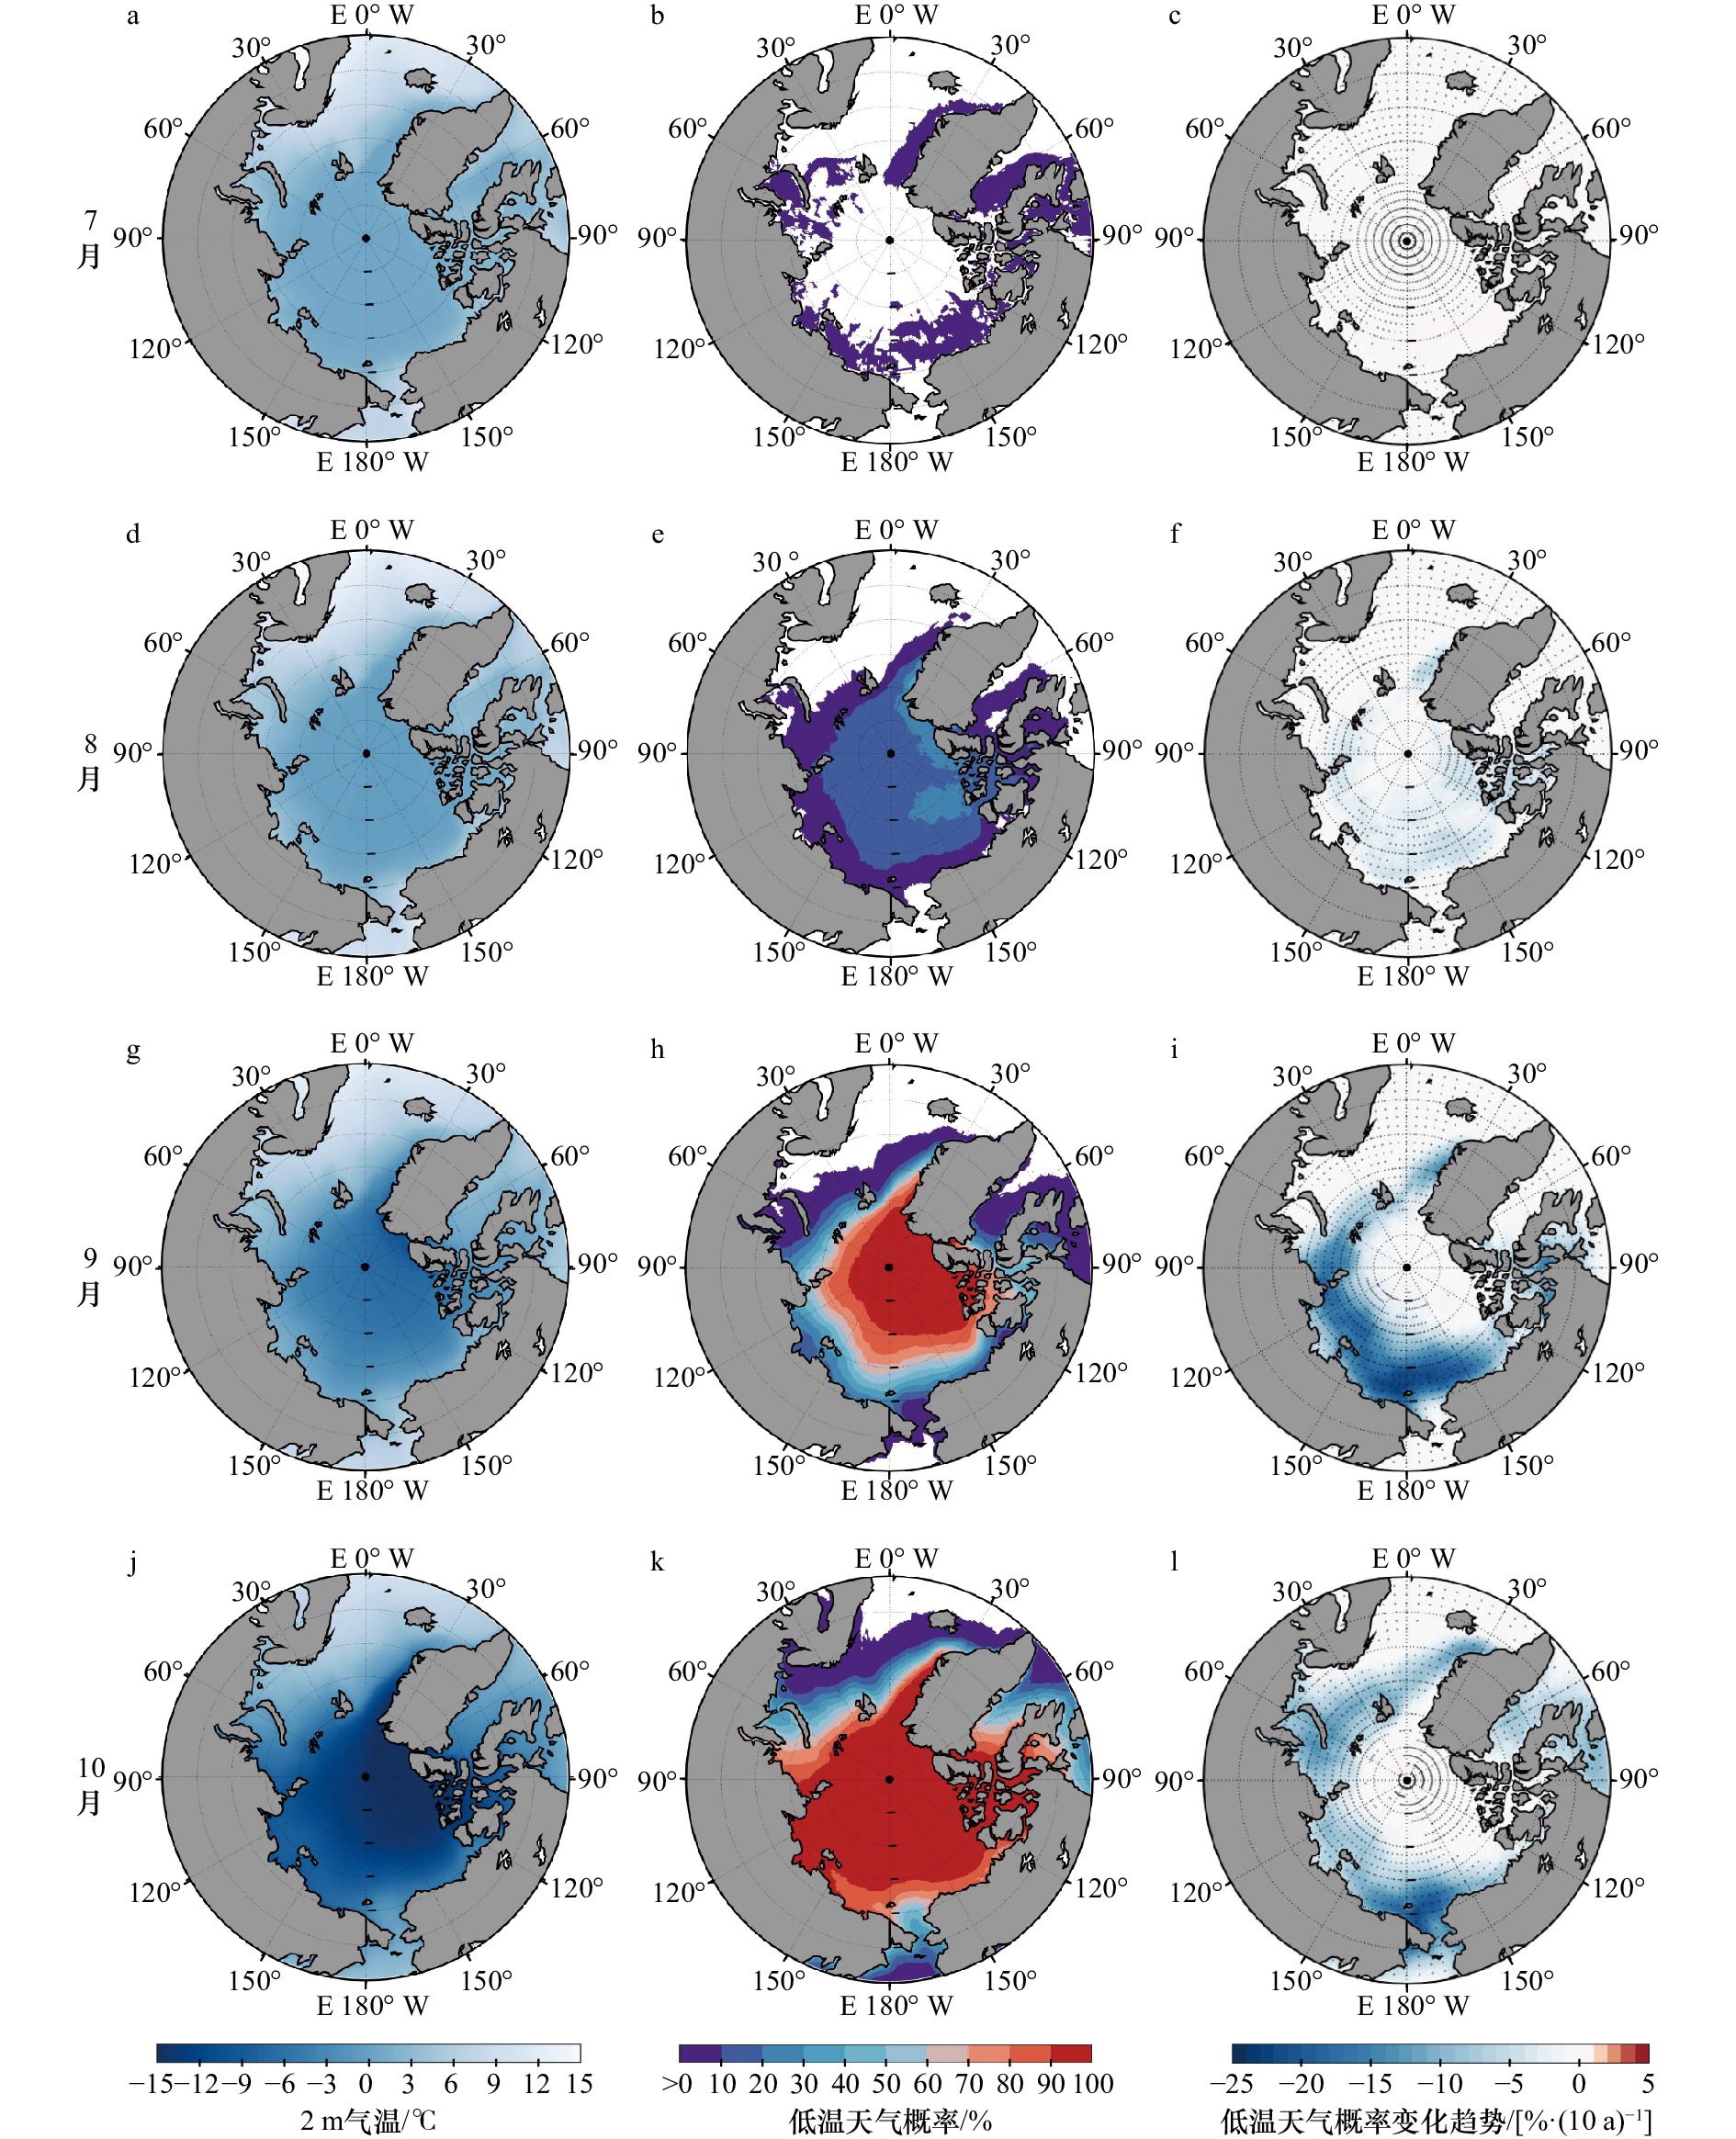
图 3 1979–2020年7–10月平均2 m气温分布(a, d, g, j)、平均低温天气概率分布(b, e, h, k)和低温天气概率变化趋势(c, f, i, l)
低温天气概率分布图中的白色区域为低温概率等于0的区域,低温天气概率变化趋势图中打点的区域为显著性超过95%的区域
Fig. 3 Spatial distribution of the average of 2 m air temperature (a, d, g, j), the average of the low temperature weather probability (b, e, h, k) and the tendency of the low temperature weather probability (c, f, i, l) in July to October from 1979 to 2020
The areas shaded with white in the maps of the low temperature weather probability represent zero low temperature weather probability. The areas with a significance of more than 95% in the maps of the tendency of the low temperature probability are dotted

图 4 1979–2020年7–10月平均10 m风速分布(a, d, g, j)、平均大风天气概率分布(b, e, h, k)和大风天气概率变化趋势(c, f, i, l)
大风天气概率变化趋势图中黑色实线内的区域为显著性超过95%的区域
Fig. 4 Spatial distribution of the average of 10 m wind speed (a, d, g, j), the average of the strong wind weather probability (b, e, h, k) and the tendency of the strong wind weather probability (c, f, i, l) in July to October from 1979 to 2020
The areas with a significance of more than 95% in the maps of the tendency of the low temperature weather probability are surrounded by solid black lines
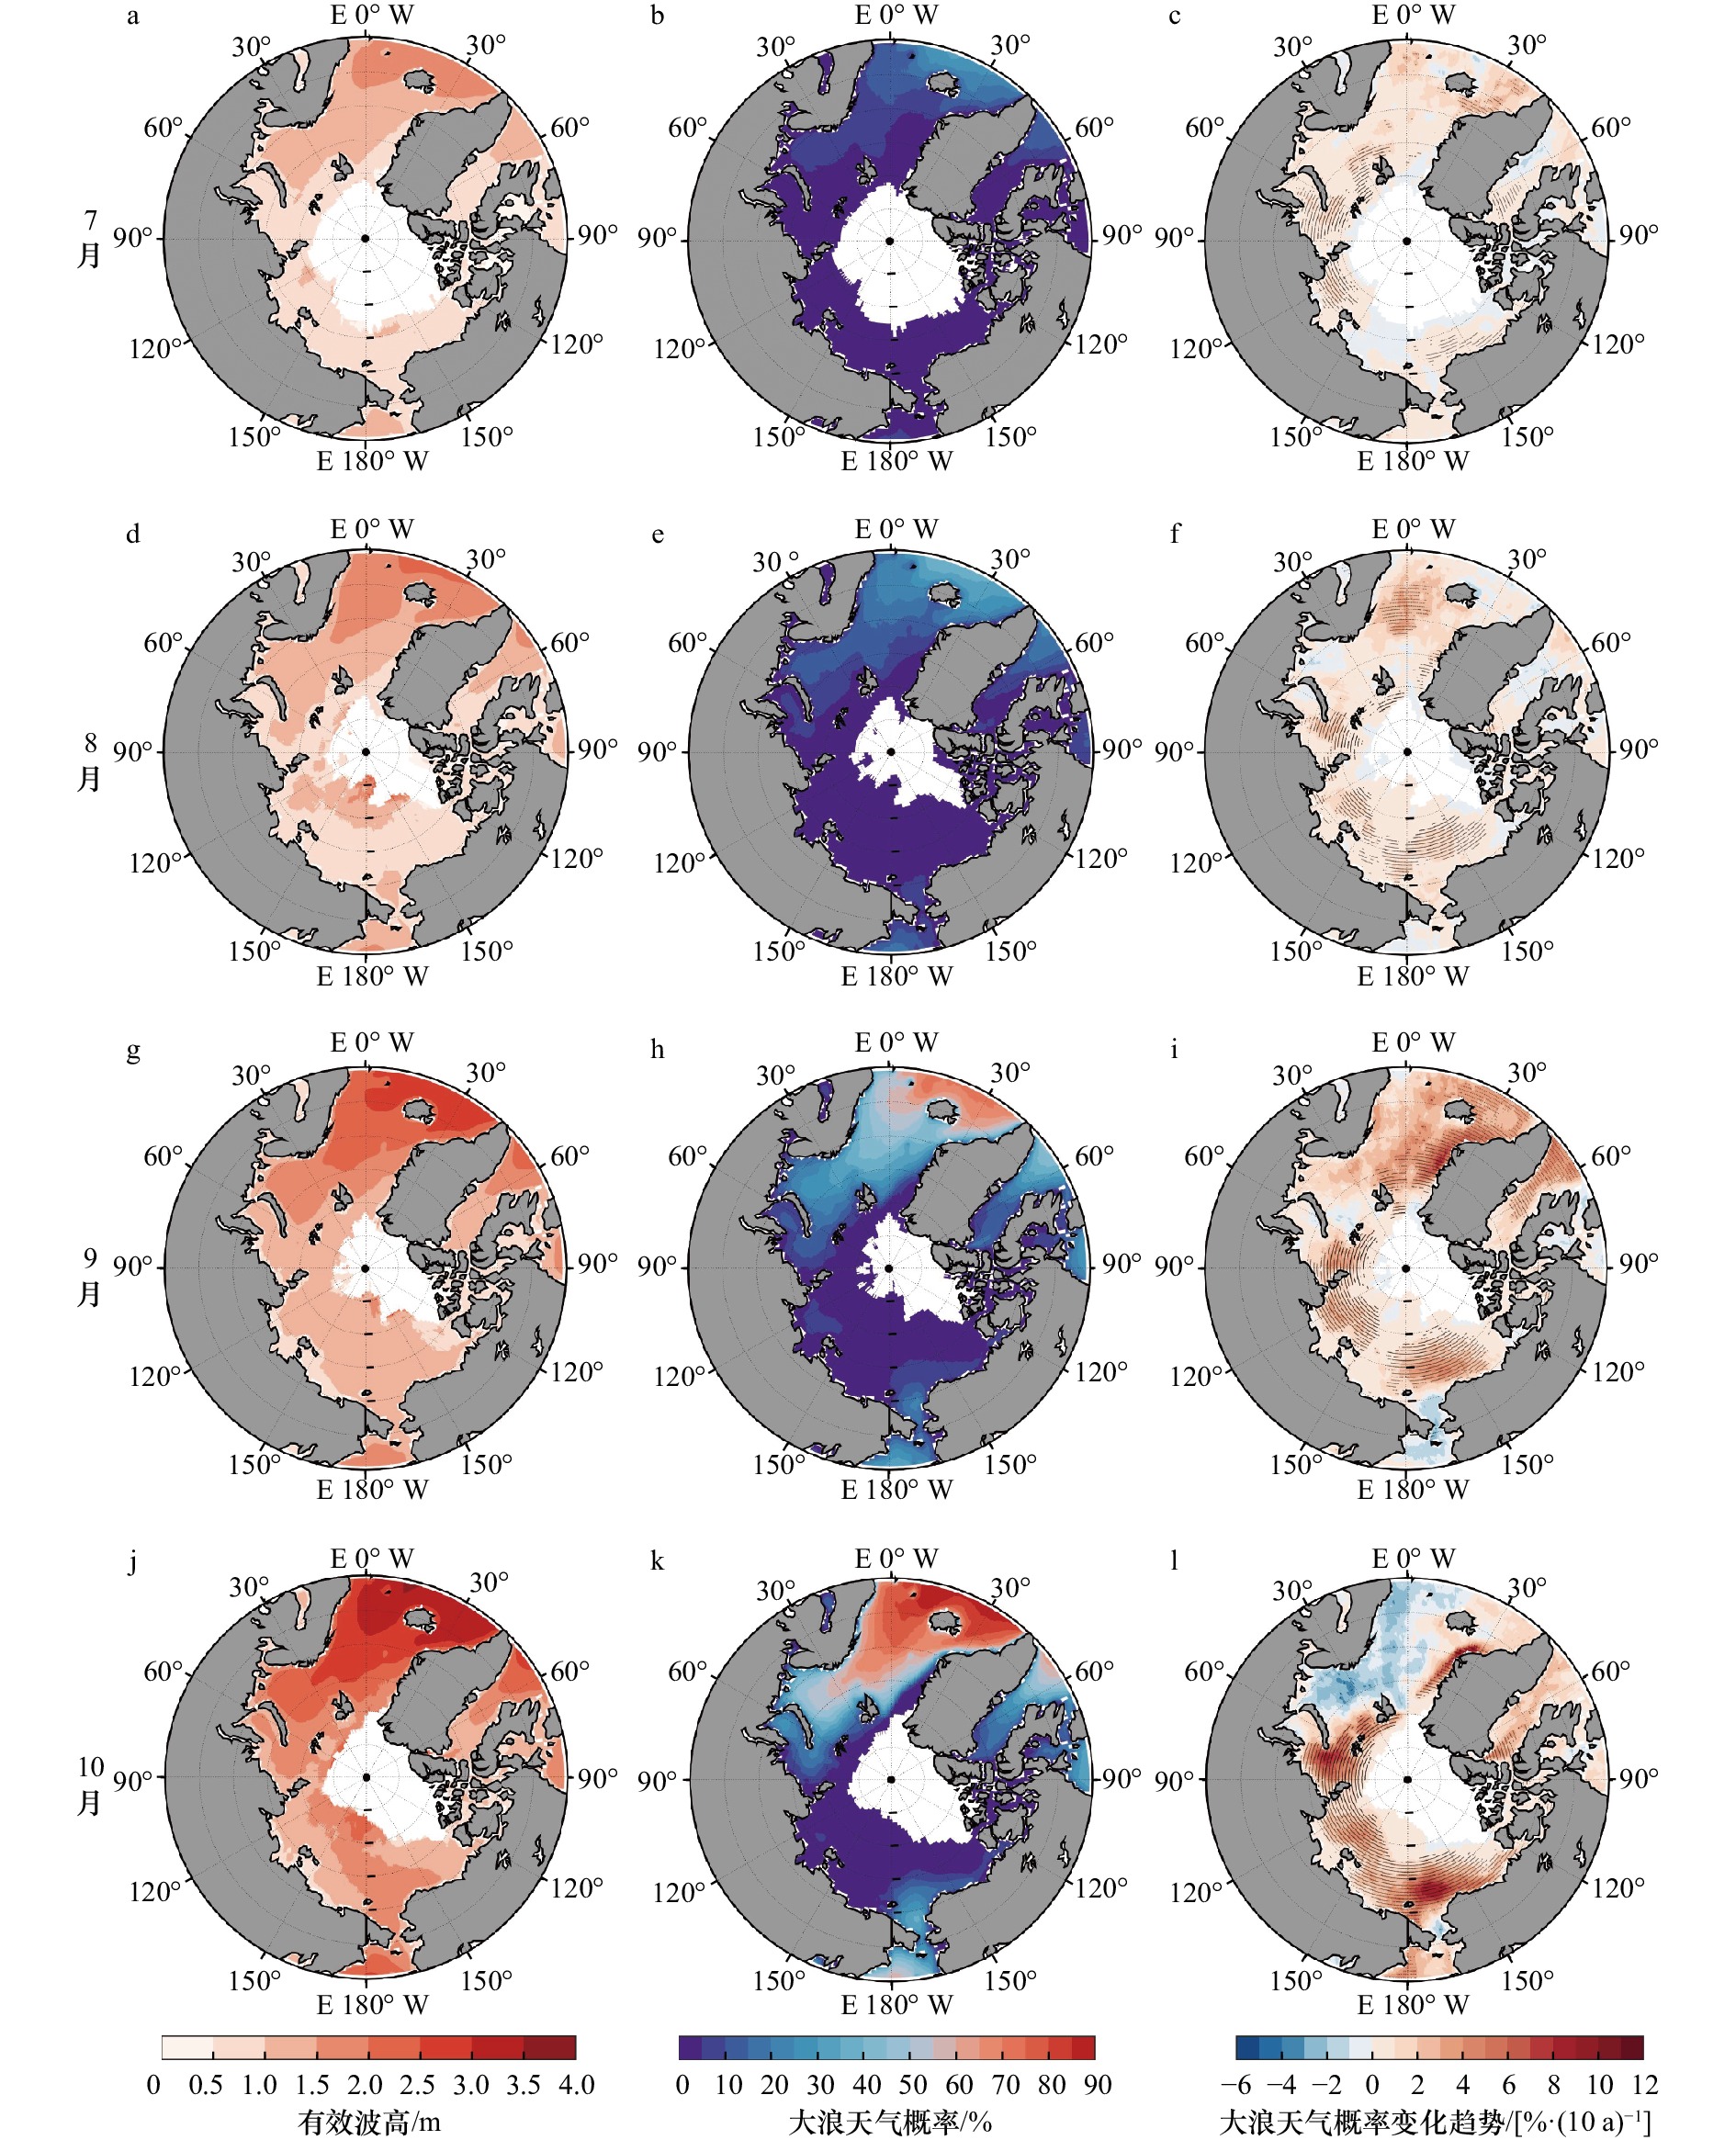
图 5 1979–2020年7–10月平均有效波高空间分布(a, d, g, j)、平均大浪天气概率空间分布(b, e, h, k)和大浪天气概率变化趋势(c, f, i, l)
白色区域为海冰覆盖区域,大浪天气概率变化趋势图中的打点区域为显著性超过95%的区域
Fig. 5 Spatial distribution of the average of the significant wave height (a, d, g, j), the average of the huge wave weather probability (b, e, h, k) and the tendency of the huge wave weather probability (c, f, i, l) in July to October from 1979 to 2020
The region covered by sea ice is shaded with white, the areas with a significance of more than 95% in the maps of the tendency of the low temperature probability are dotted

图 7 1979–2020年区域A(a)、B(b)、C(c)和D(d)内7月平均低温天气概率、大风天气概率和大浪天气概率距平(实线)及线性变化趋势(虚线)。图中给出了显著性超过90%的线性拟合变化速率
Fig. 7 The anomaly (solid lines) and the tendency (dashed lines) of the average of the low temperature weather probability, strong wind weather probability and the huge wave weather probability within region A (a), B (b), C (c) and D (d) in July during 1979–2020. These tendencies with a significance of more than 90% are given
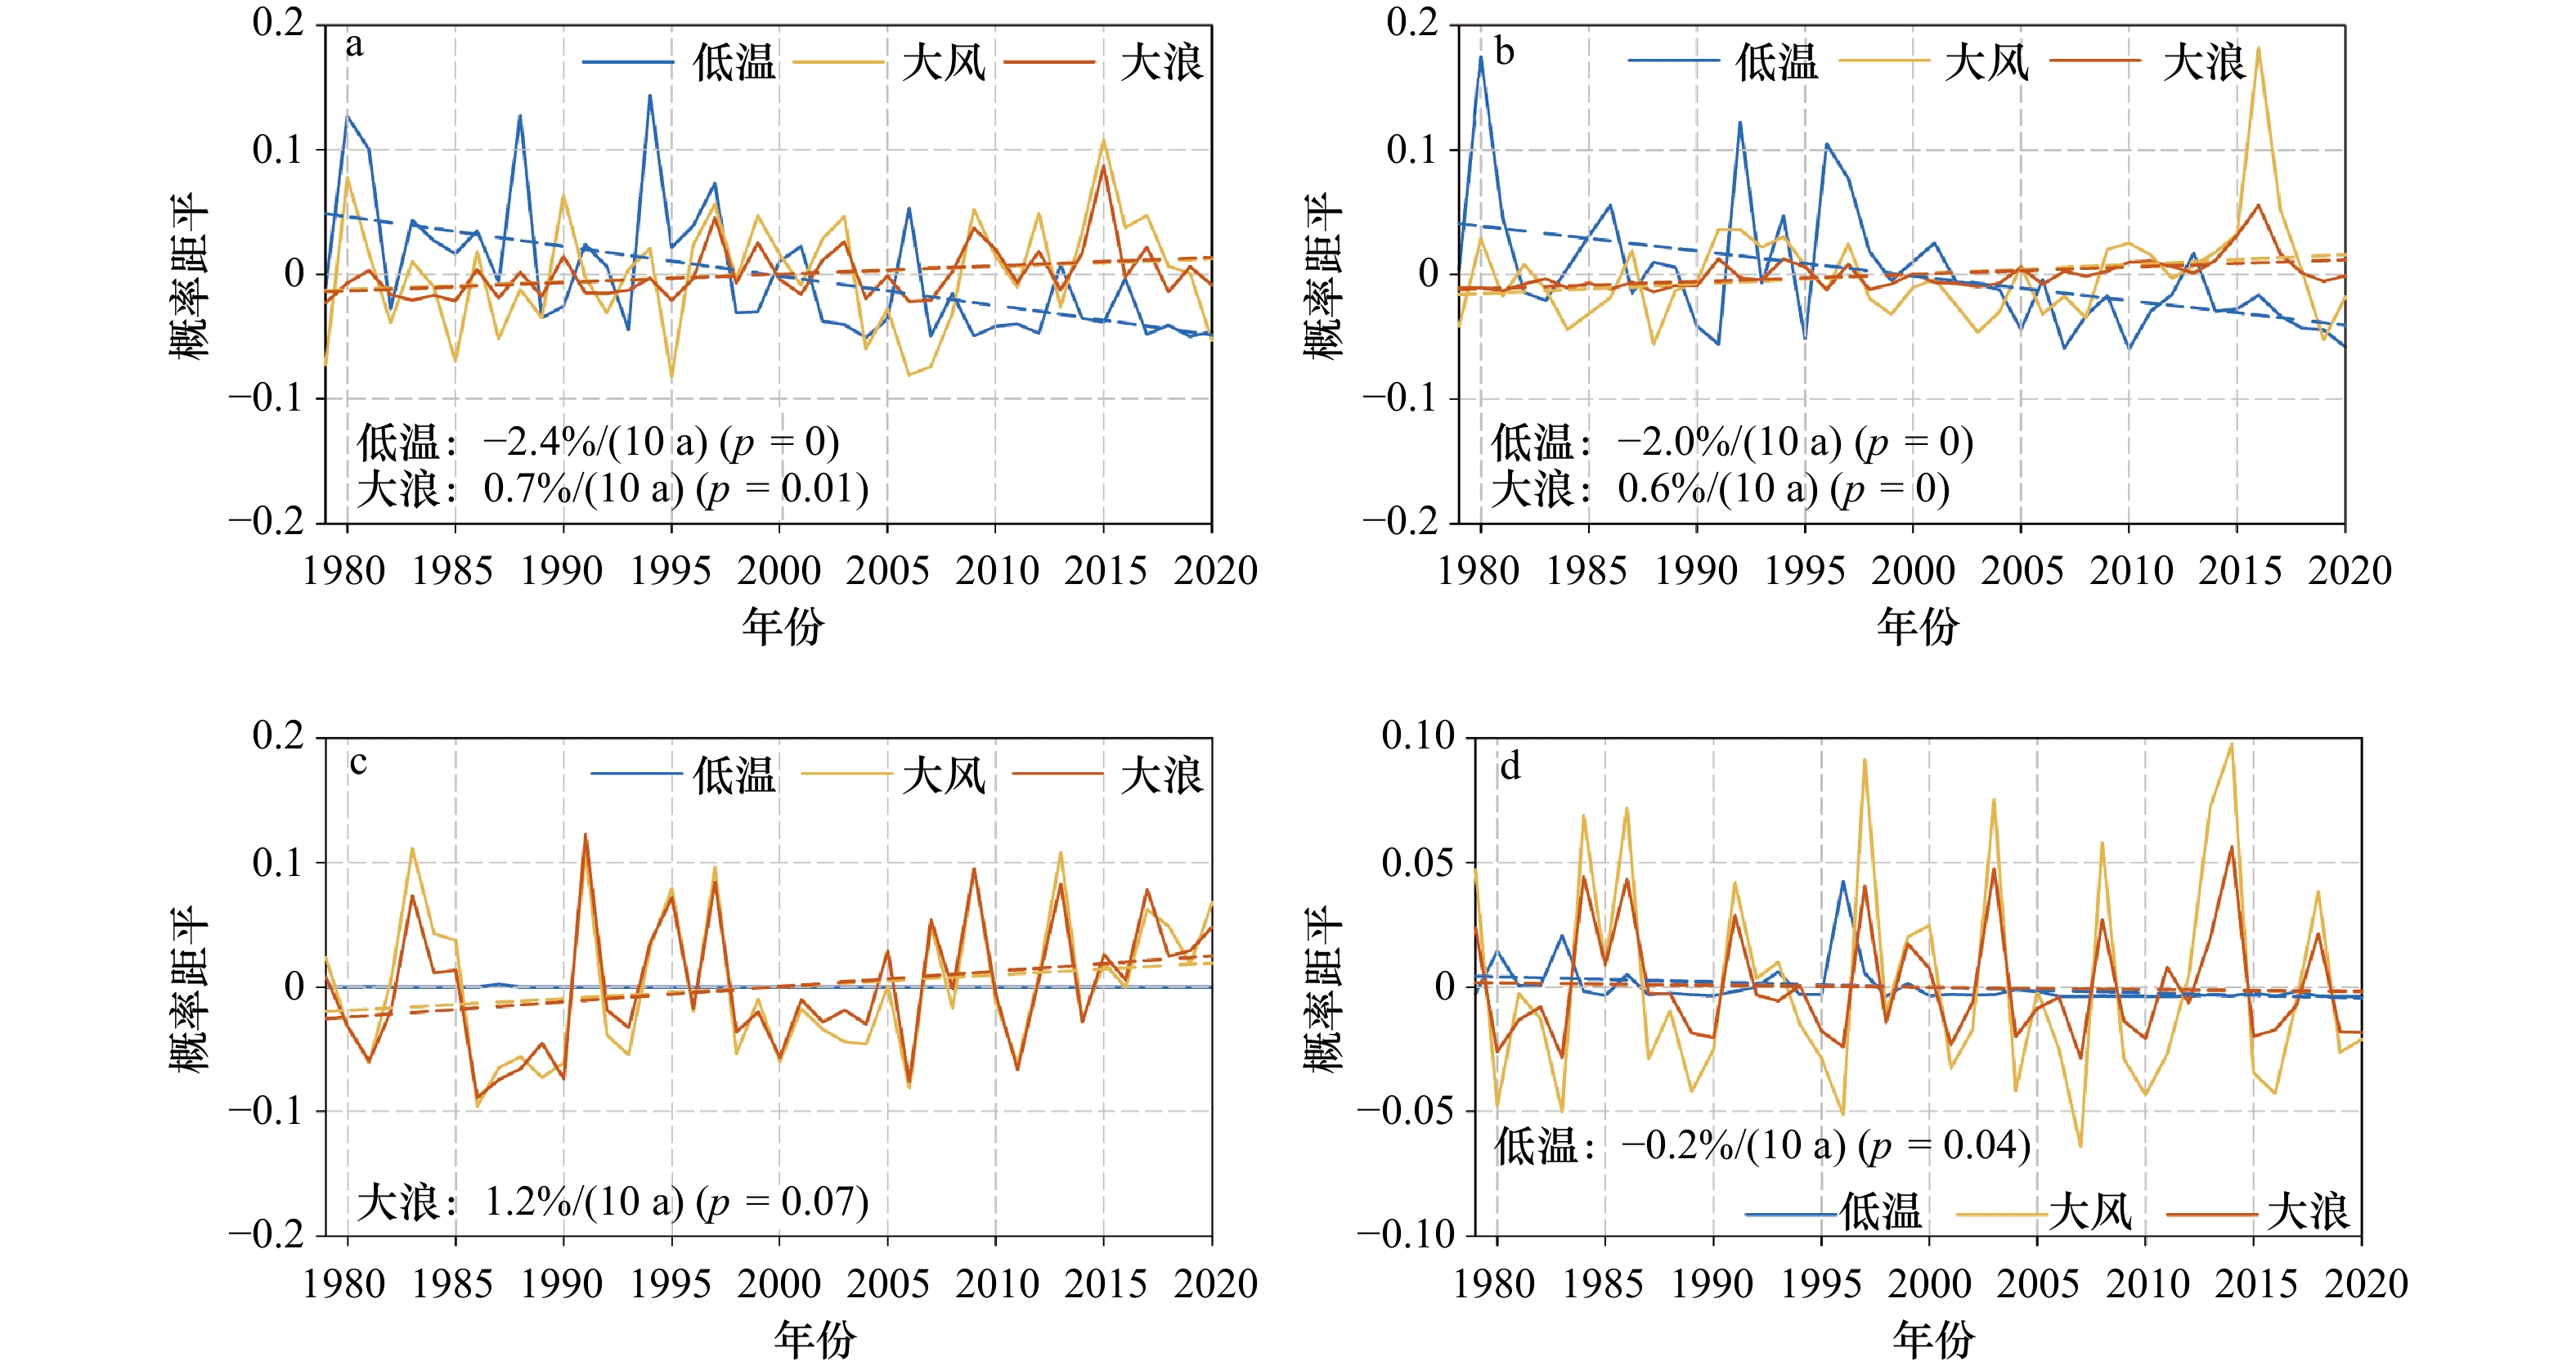
图 8 1979–2020年区域A(a)、B(b)、C(c)和D(d)内8月平均低温天气概率、大风天气概率和大浪天气概率距平(实线)及变化趋势(虚线)。图中给出了显著性超过90%的线性拟合变化速率
Fig. 8 The anomaly (solid lines) and the tendency (dashed lines) of the average of the low temperature weather probability, strong wind weather probability and the huge wave weather probability within region A (a), B (b), C (c) and D (d) in August during 1979–2020. These tendencies with a significance of more than 90% are given

图 9 1979–2020年区域A(a)、B(b)、C(c)和D(d)内9月平均低温天气概率、大风天气概率和大浪天气概率距平(实线)及变化趋势(虚线)。图中给出了显著性超过90%的线性拟合变化速率
Fig. 9 The anomaly (solid lines) and the tendency (dashed lines) of the average of the low temperature weather probability, strong wind weather probability and the huge wave weather probability within region A (a), B (b), C (c) and D (d) in September during 1979–2020. These tendencies with a significance of more than 90% are given
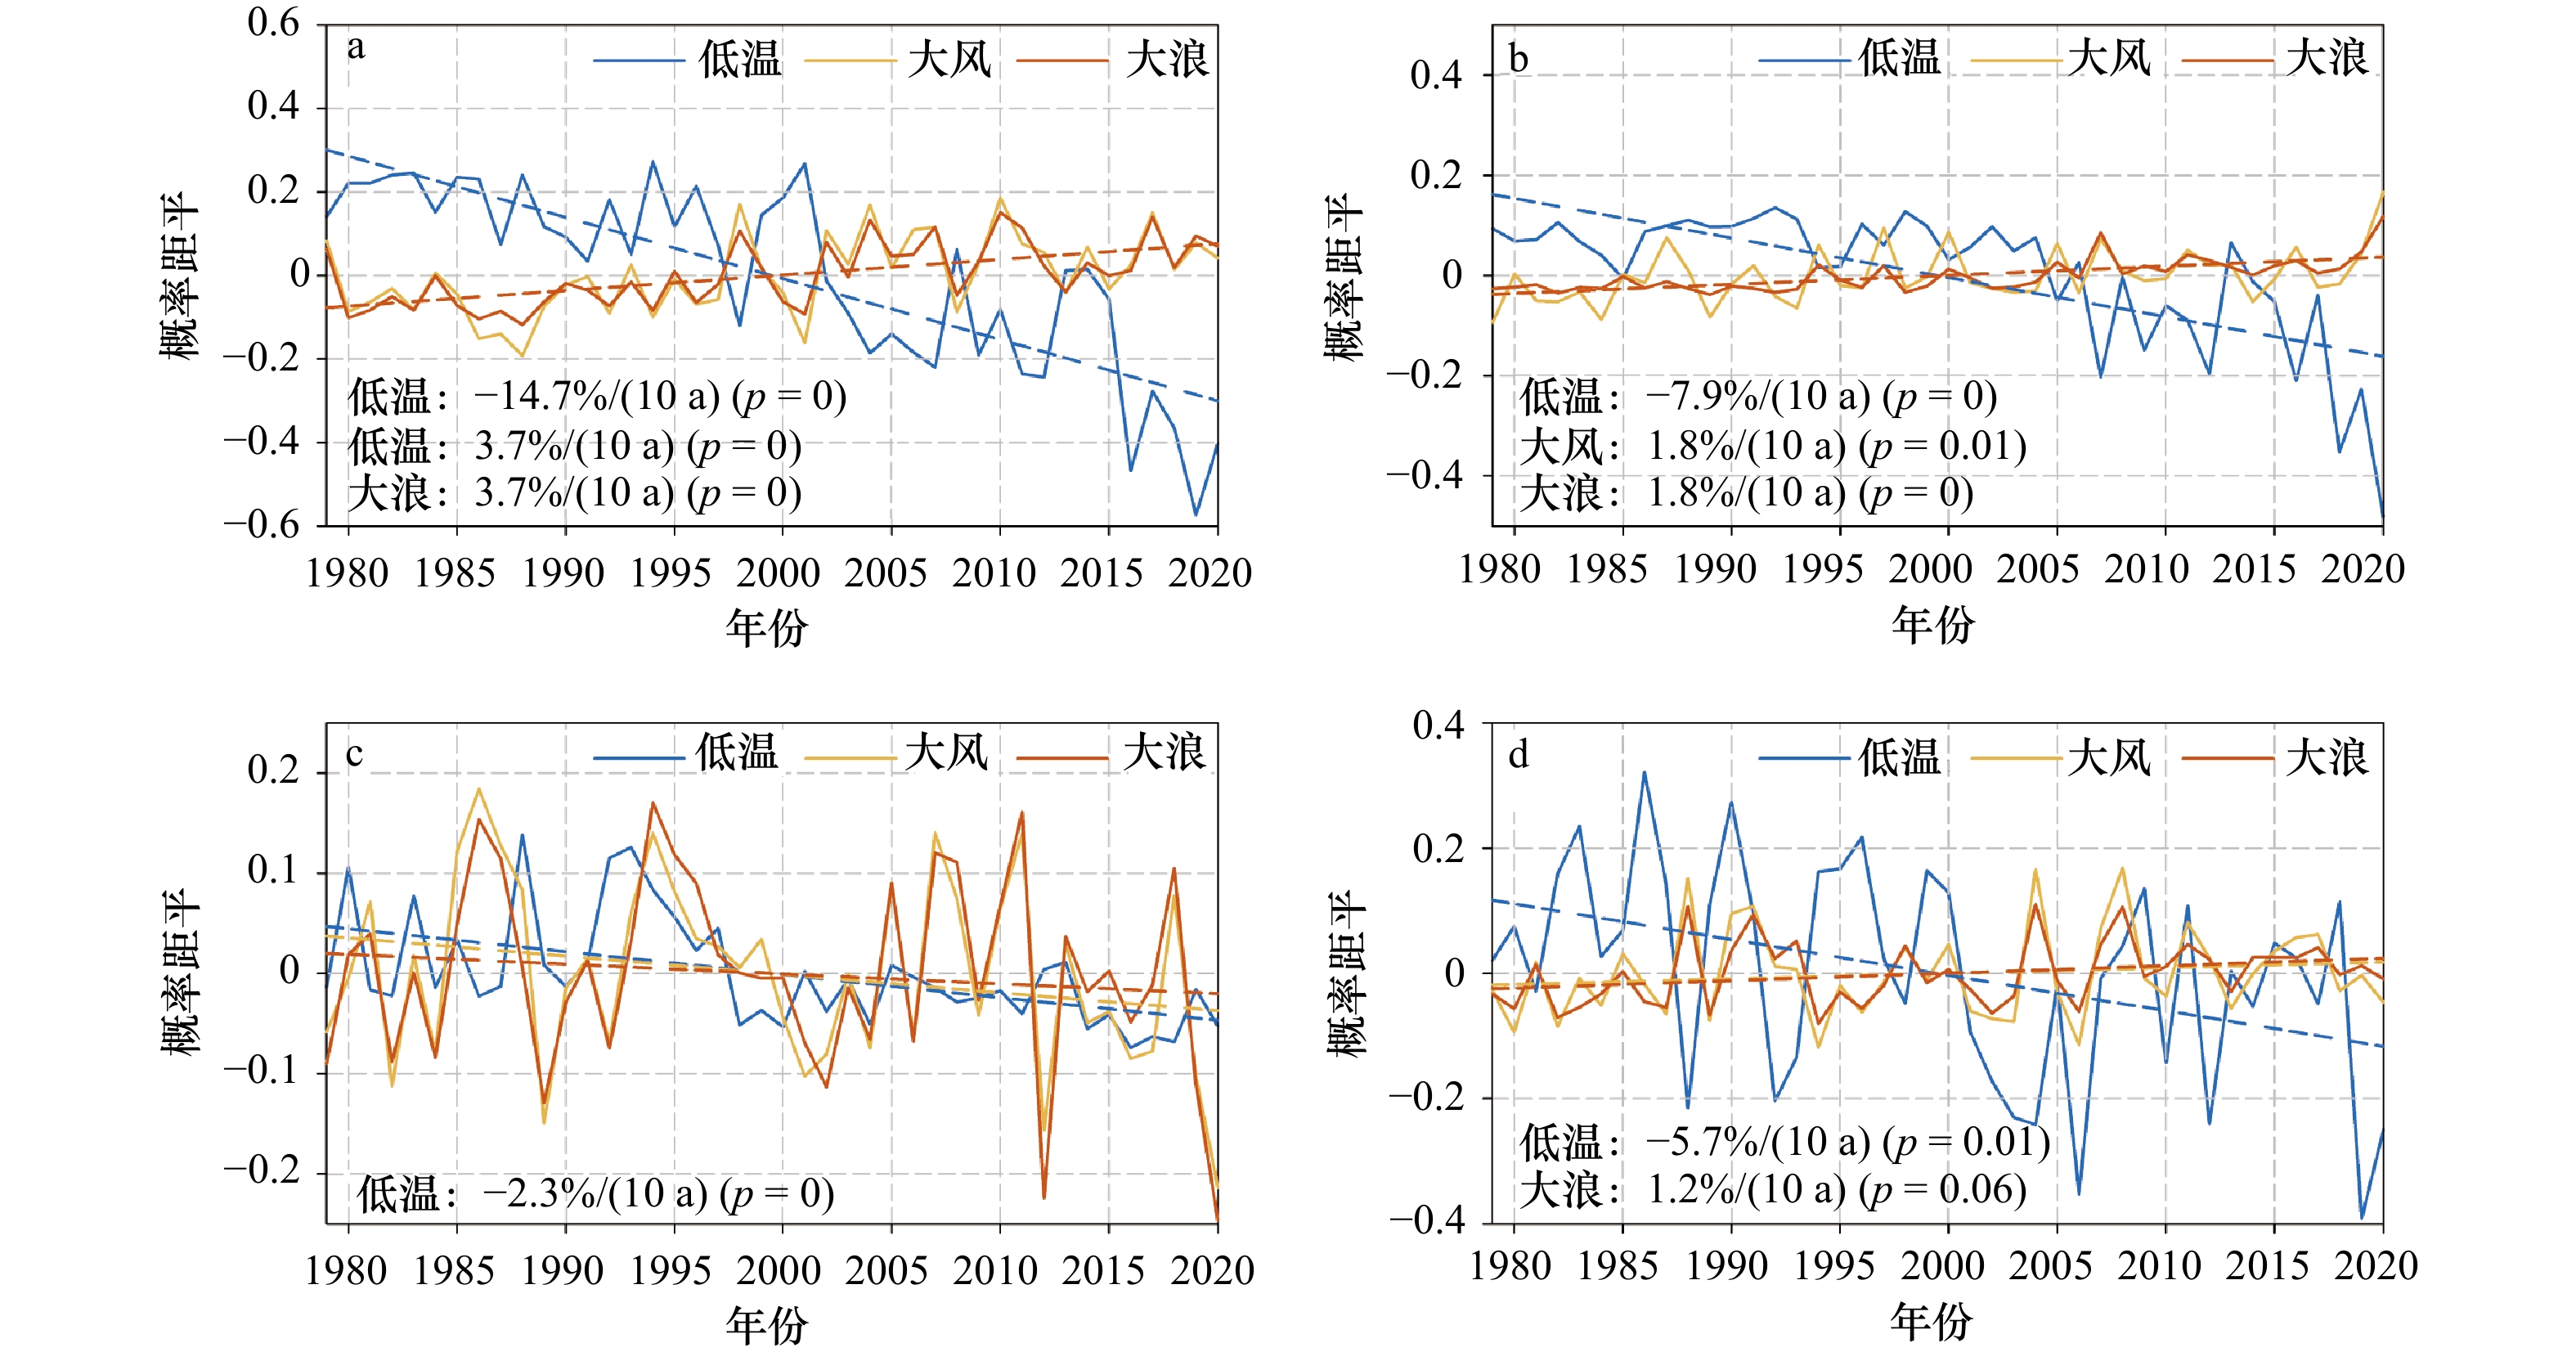
图 10 1979–2020年海域A(a)、B(b)、C(c)和D(d)内10月平均低温天气概率、大风天气概率和大浪天气概率距平(实线)及变化趋势(虚线)。图中给出了显著性超过90%的线性拟合变化速率
Fig. 10 The anomaly (solid lines) and the tendency (dashed lines) of the average of the low temperature weather probability, strong wind weather probability and the huge wave weather probability within region A (a), B (b), C (c) and D (d) in October during 1979–2020. These tendencies with a significance of more than 90% are given
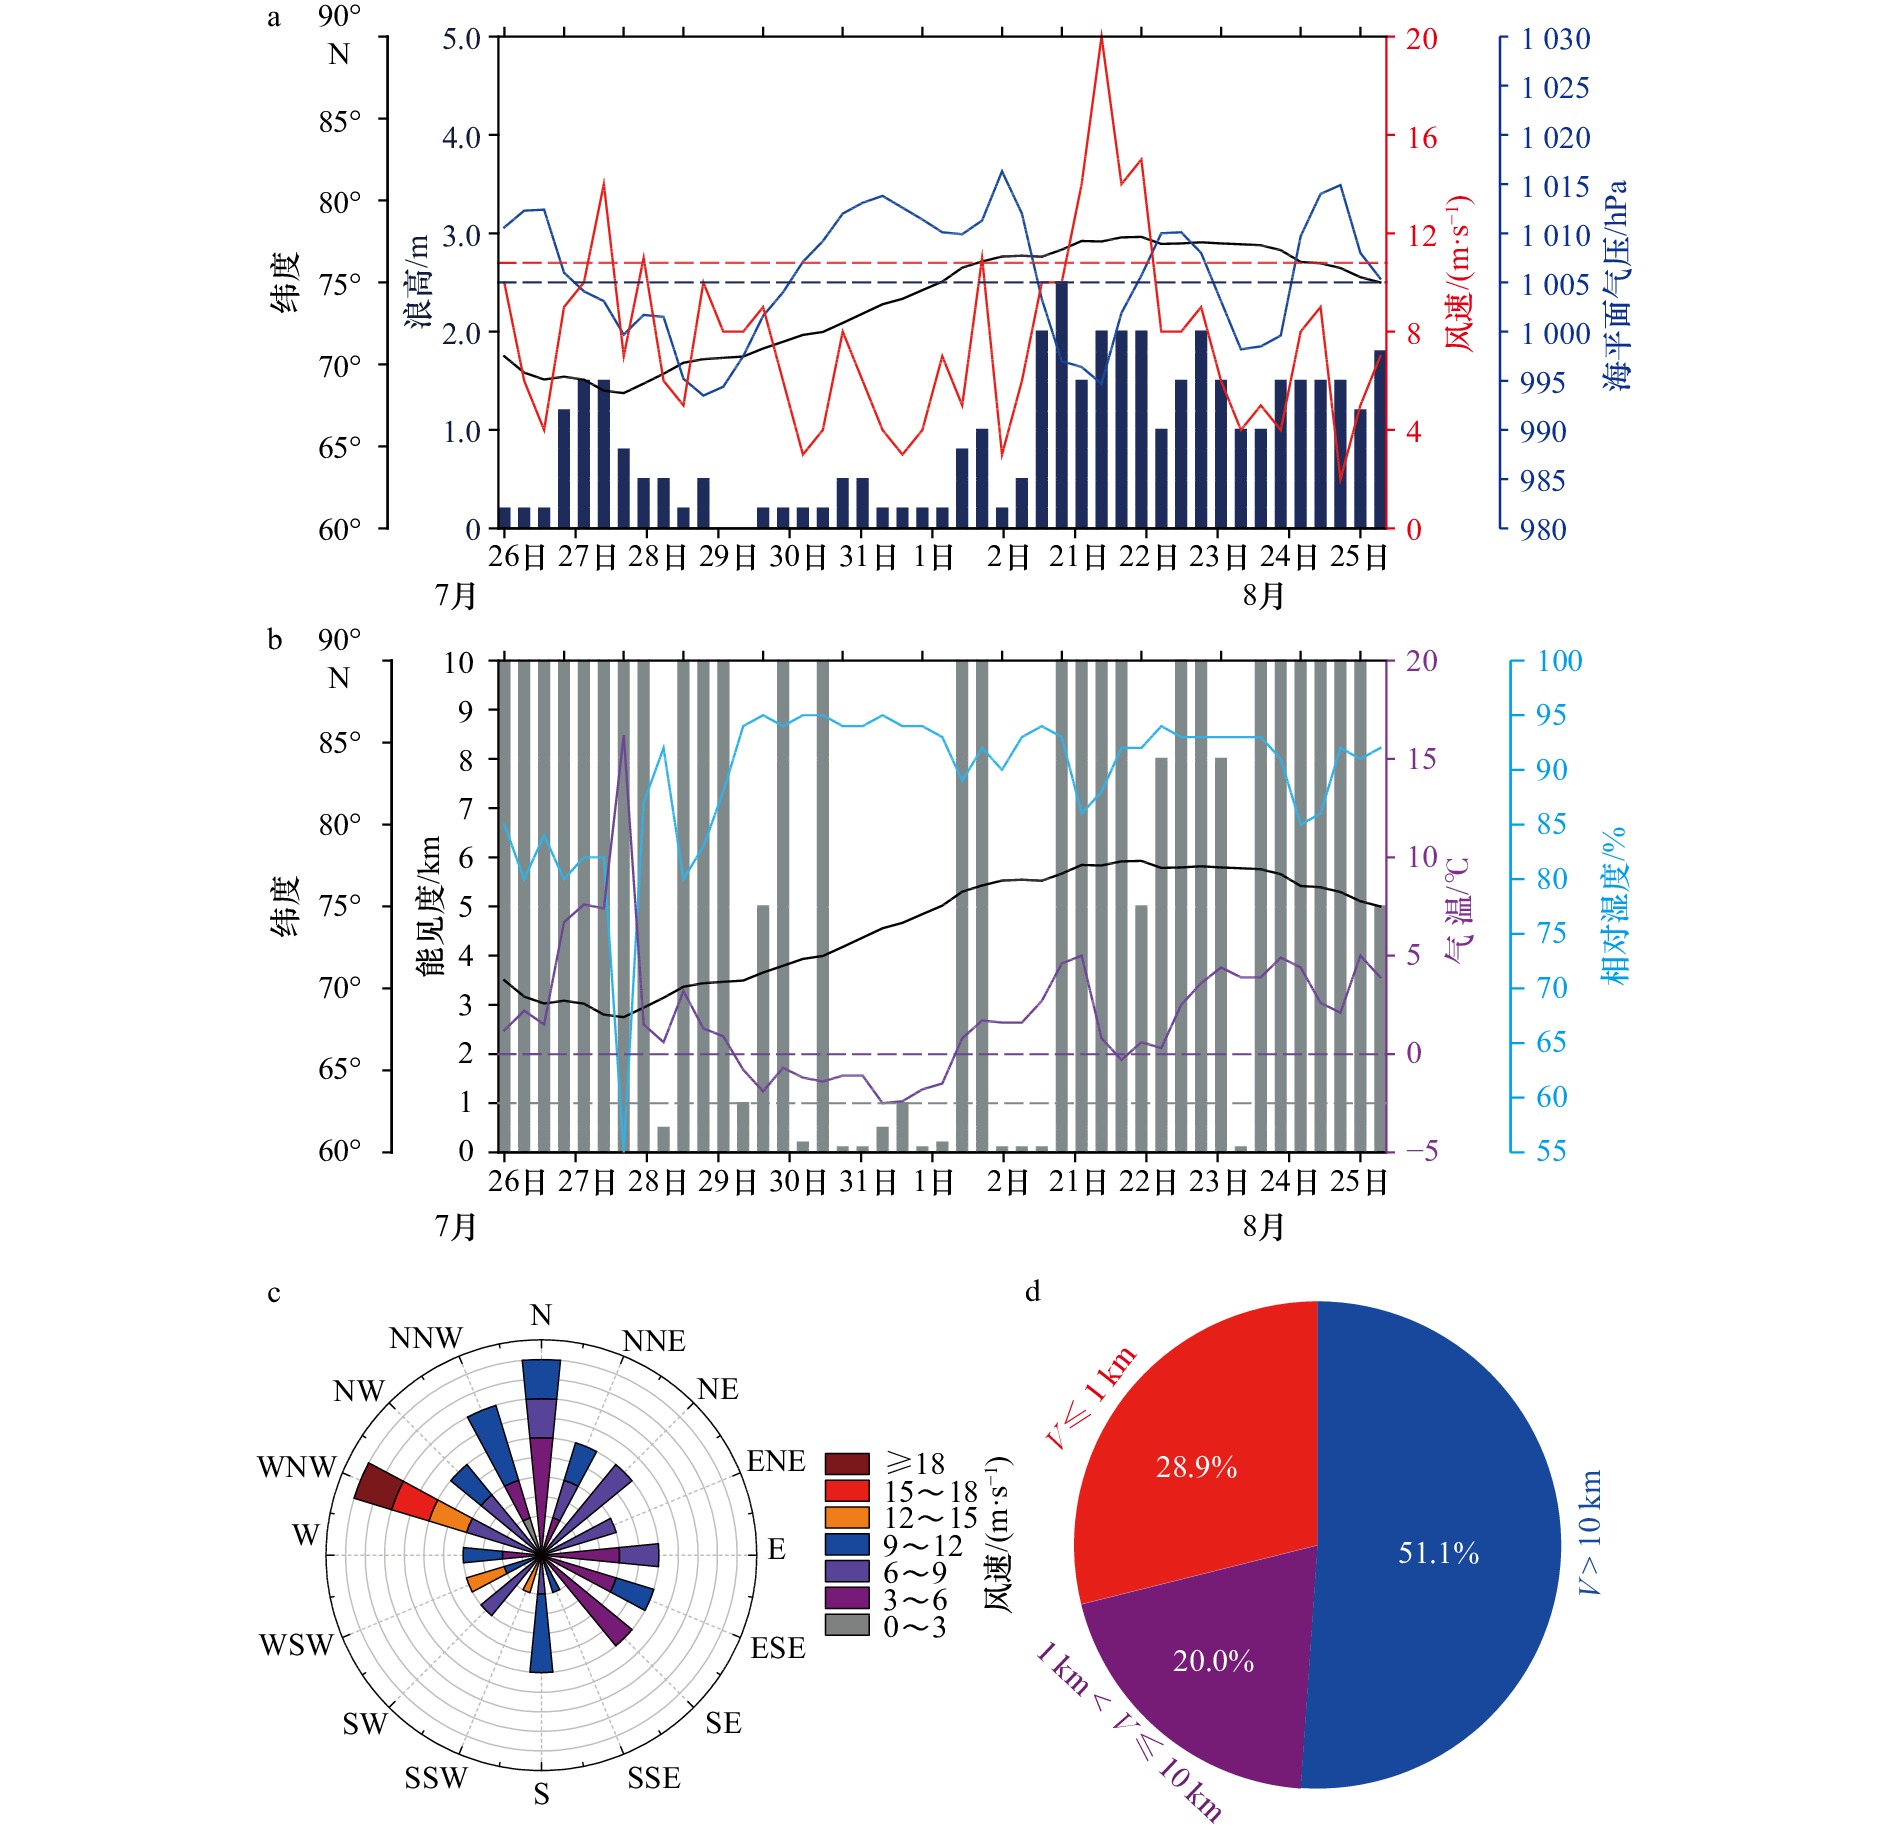
图 11 2012年“雪龙”号穿越东北航道期间近地面气象要素走航观测结果
a. 海平面气压、风速、浪高及纬度时间序列;b. 气温、相对湿度、能见度及纬度时间序列;c. 风玫瑰图;d. 能见度(V)概率分布
Fig. 11 The results of the near-surface meteorological parameters obtained during Xuelong vessel crossing the Arctic northeast passage in 2012
a. The time series of sea level pressure, wind speed, wave height and the latitude; b. the time series of air temperature, relative humidity, visibility and the latitude; c. wind rose plot; d. the percentage distribution of different visibility (V)
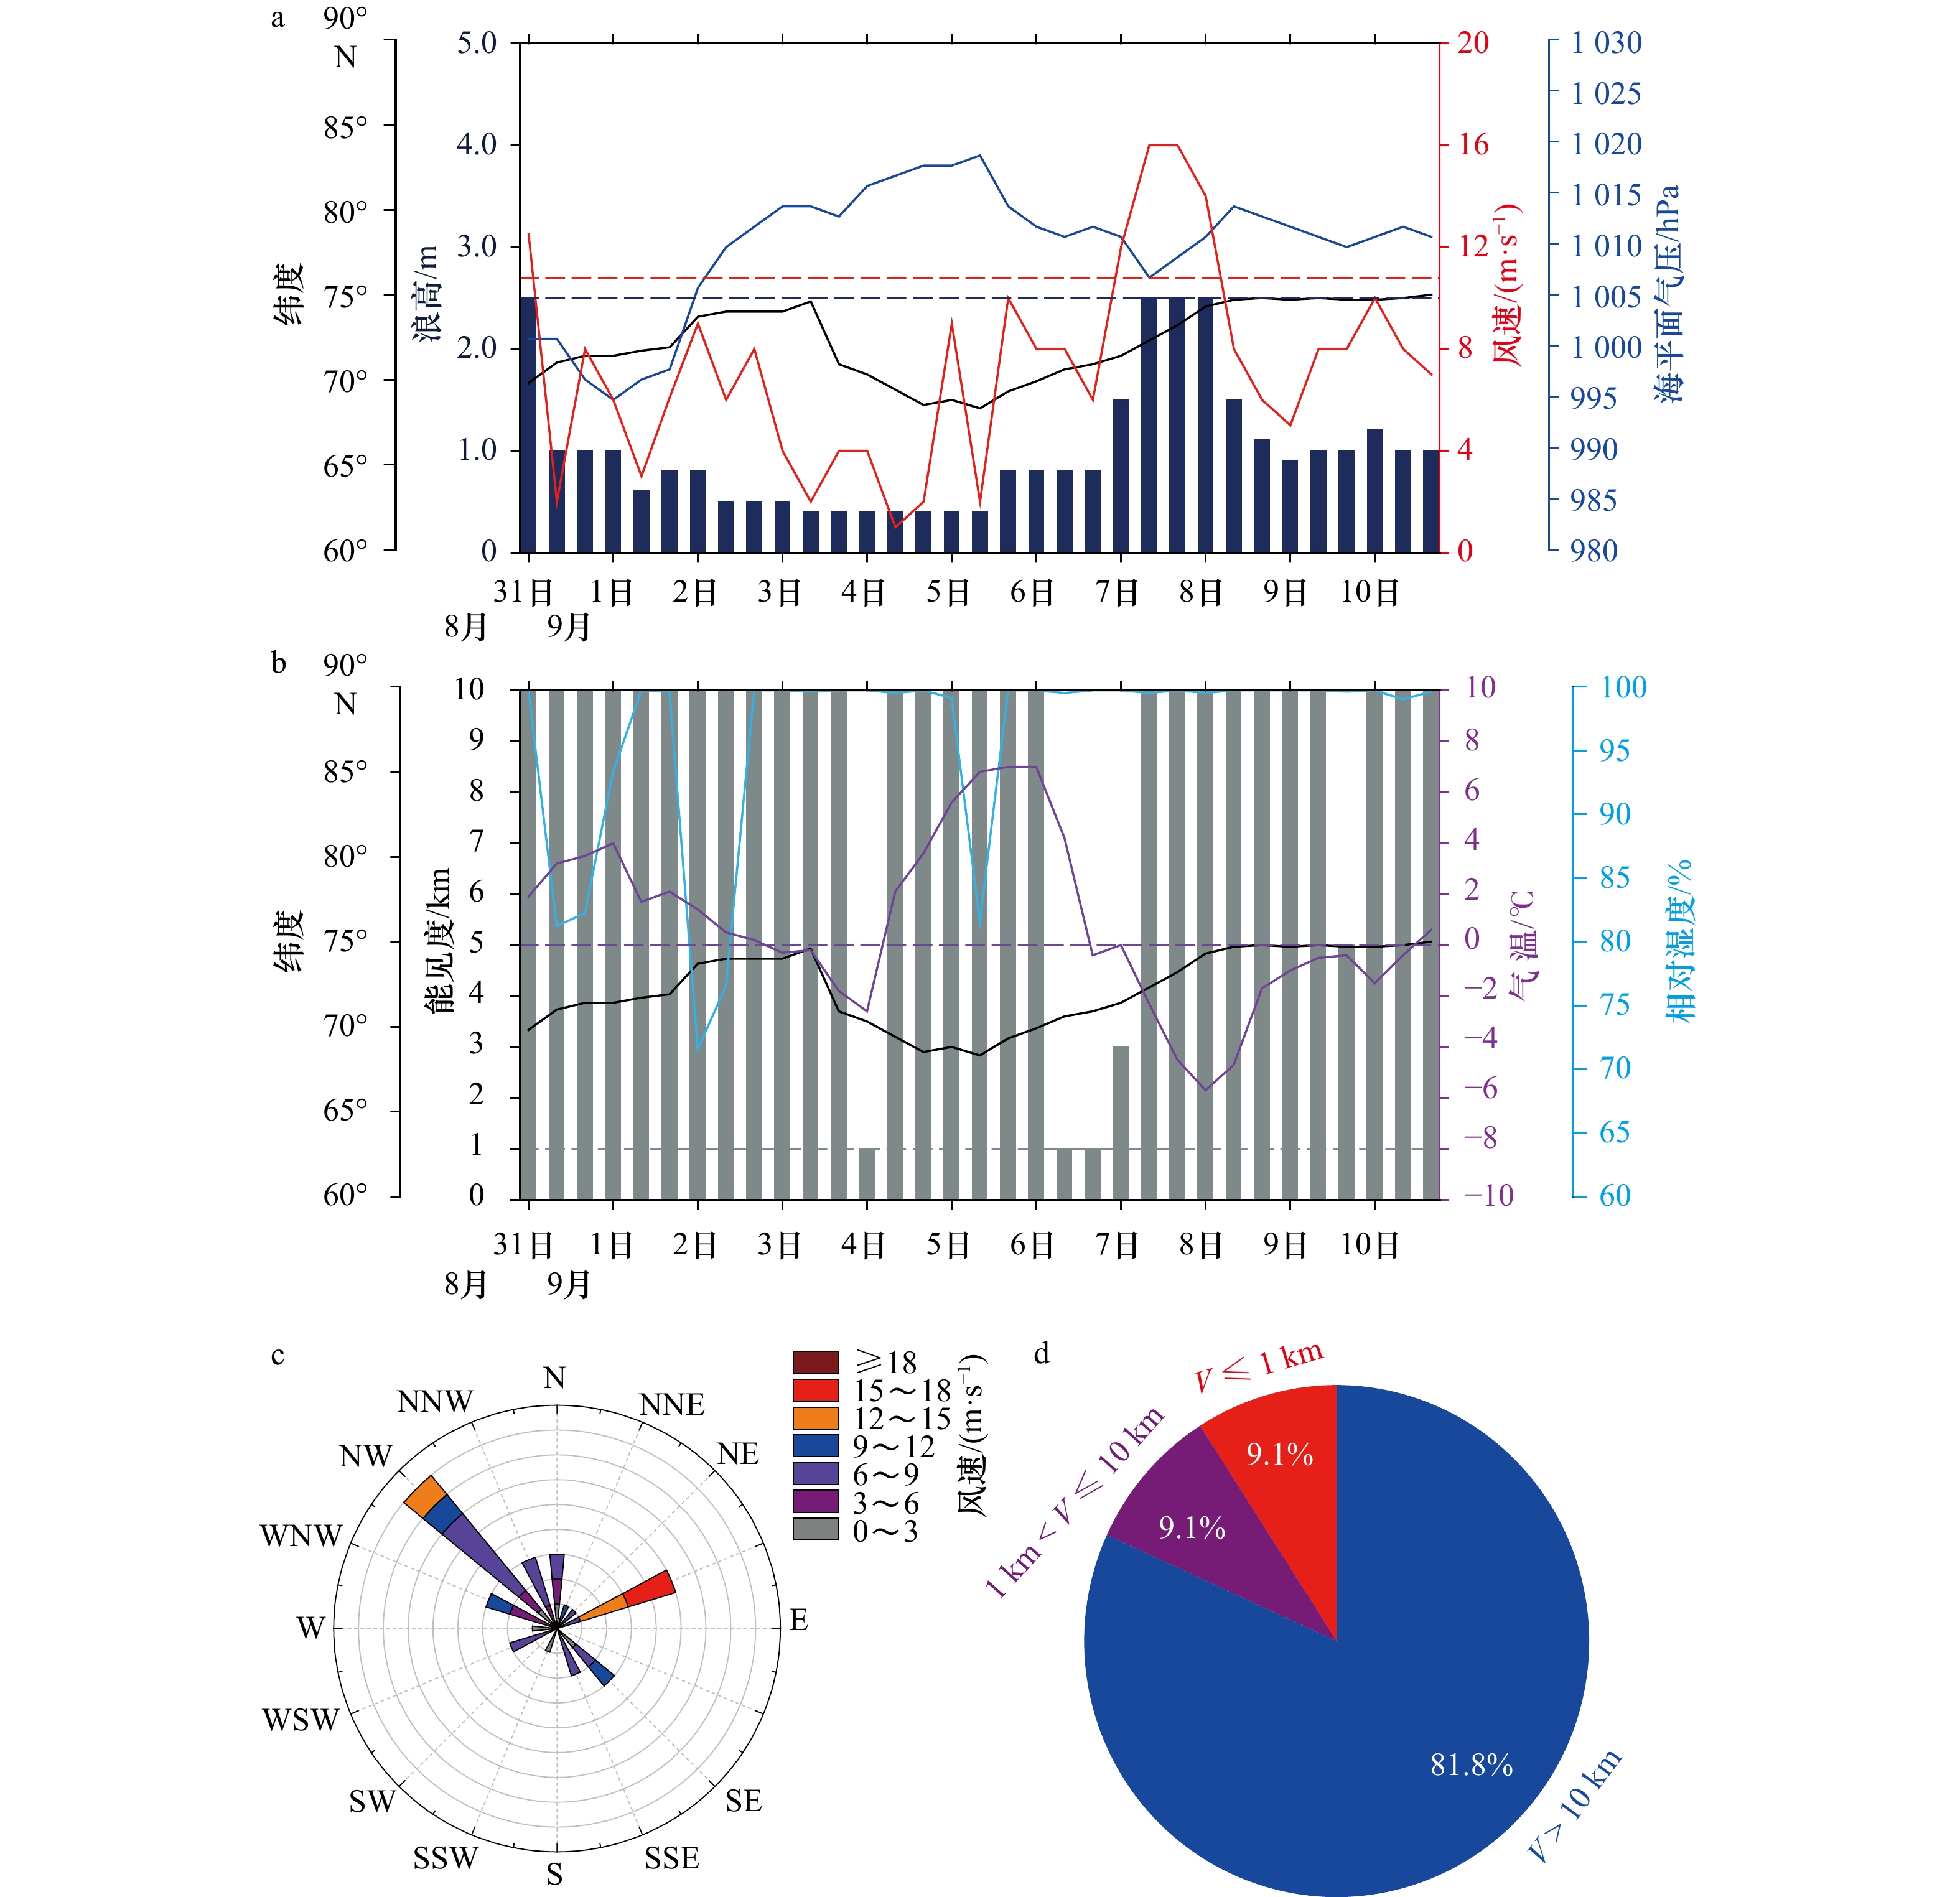
图 12 2017年“雪龙”号穿越西北航道期间近地面气象要素走航观测结果
a. 海平面气压、风速、浪高及纬度时间序列;b. 气温、相对湿度、能见度及纬度时间序列;c. 风玫瑰图;d. 能见度(V)概率分布
Fig. 12 The results of the near-surface meteorological parameters obtained during Xuelong vessel crossing the Arctic northwest passage in 2017
a. The time series of sea level pressure, wind speed, wave height and the latitude; b. the time series of air temperature, relative humidity, visibility and the latitude; c. wind rose plot; d. the percentage distribution of different visibility (V)

图 13 2012年“雪龙”号穿越中央航道期间近地面气象要素走航观测结果
a. 海平面气压、风速、浪高及纬度时间序列;b. 气温、相对湿度、能见度及纬度时间序列;c. 风玫瑰图;d. 能见度(V)概率分布
Fig. 13 The results of the near-surface meteorological parameters obtained during Xuelong vessel crossing the trans-Arctic northwest passage in 2012
a. The time series of sea level pressure, wind speed, wave height and the latitude; b. the time series of air temperature, relative humidity, visibility and the latitude; c. wind rose plot; d. the percentage of distribution different visibility (V)
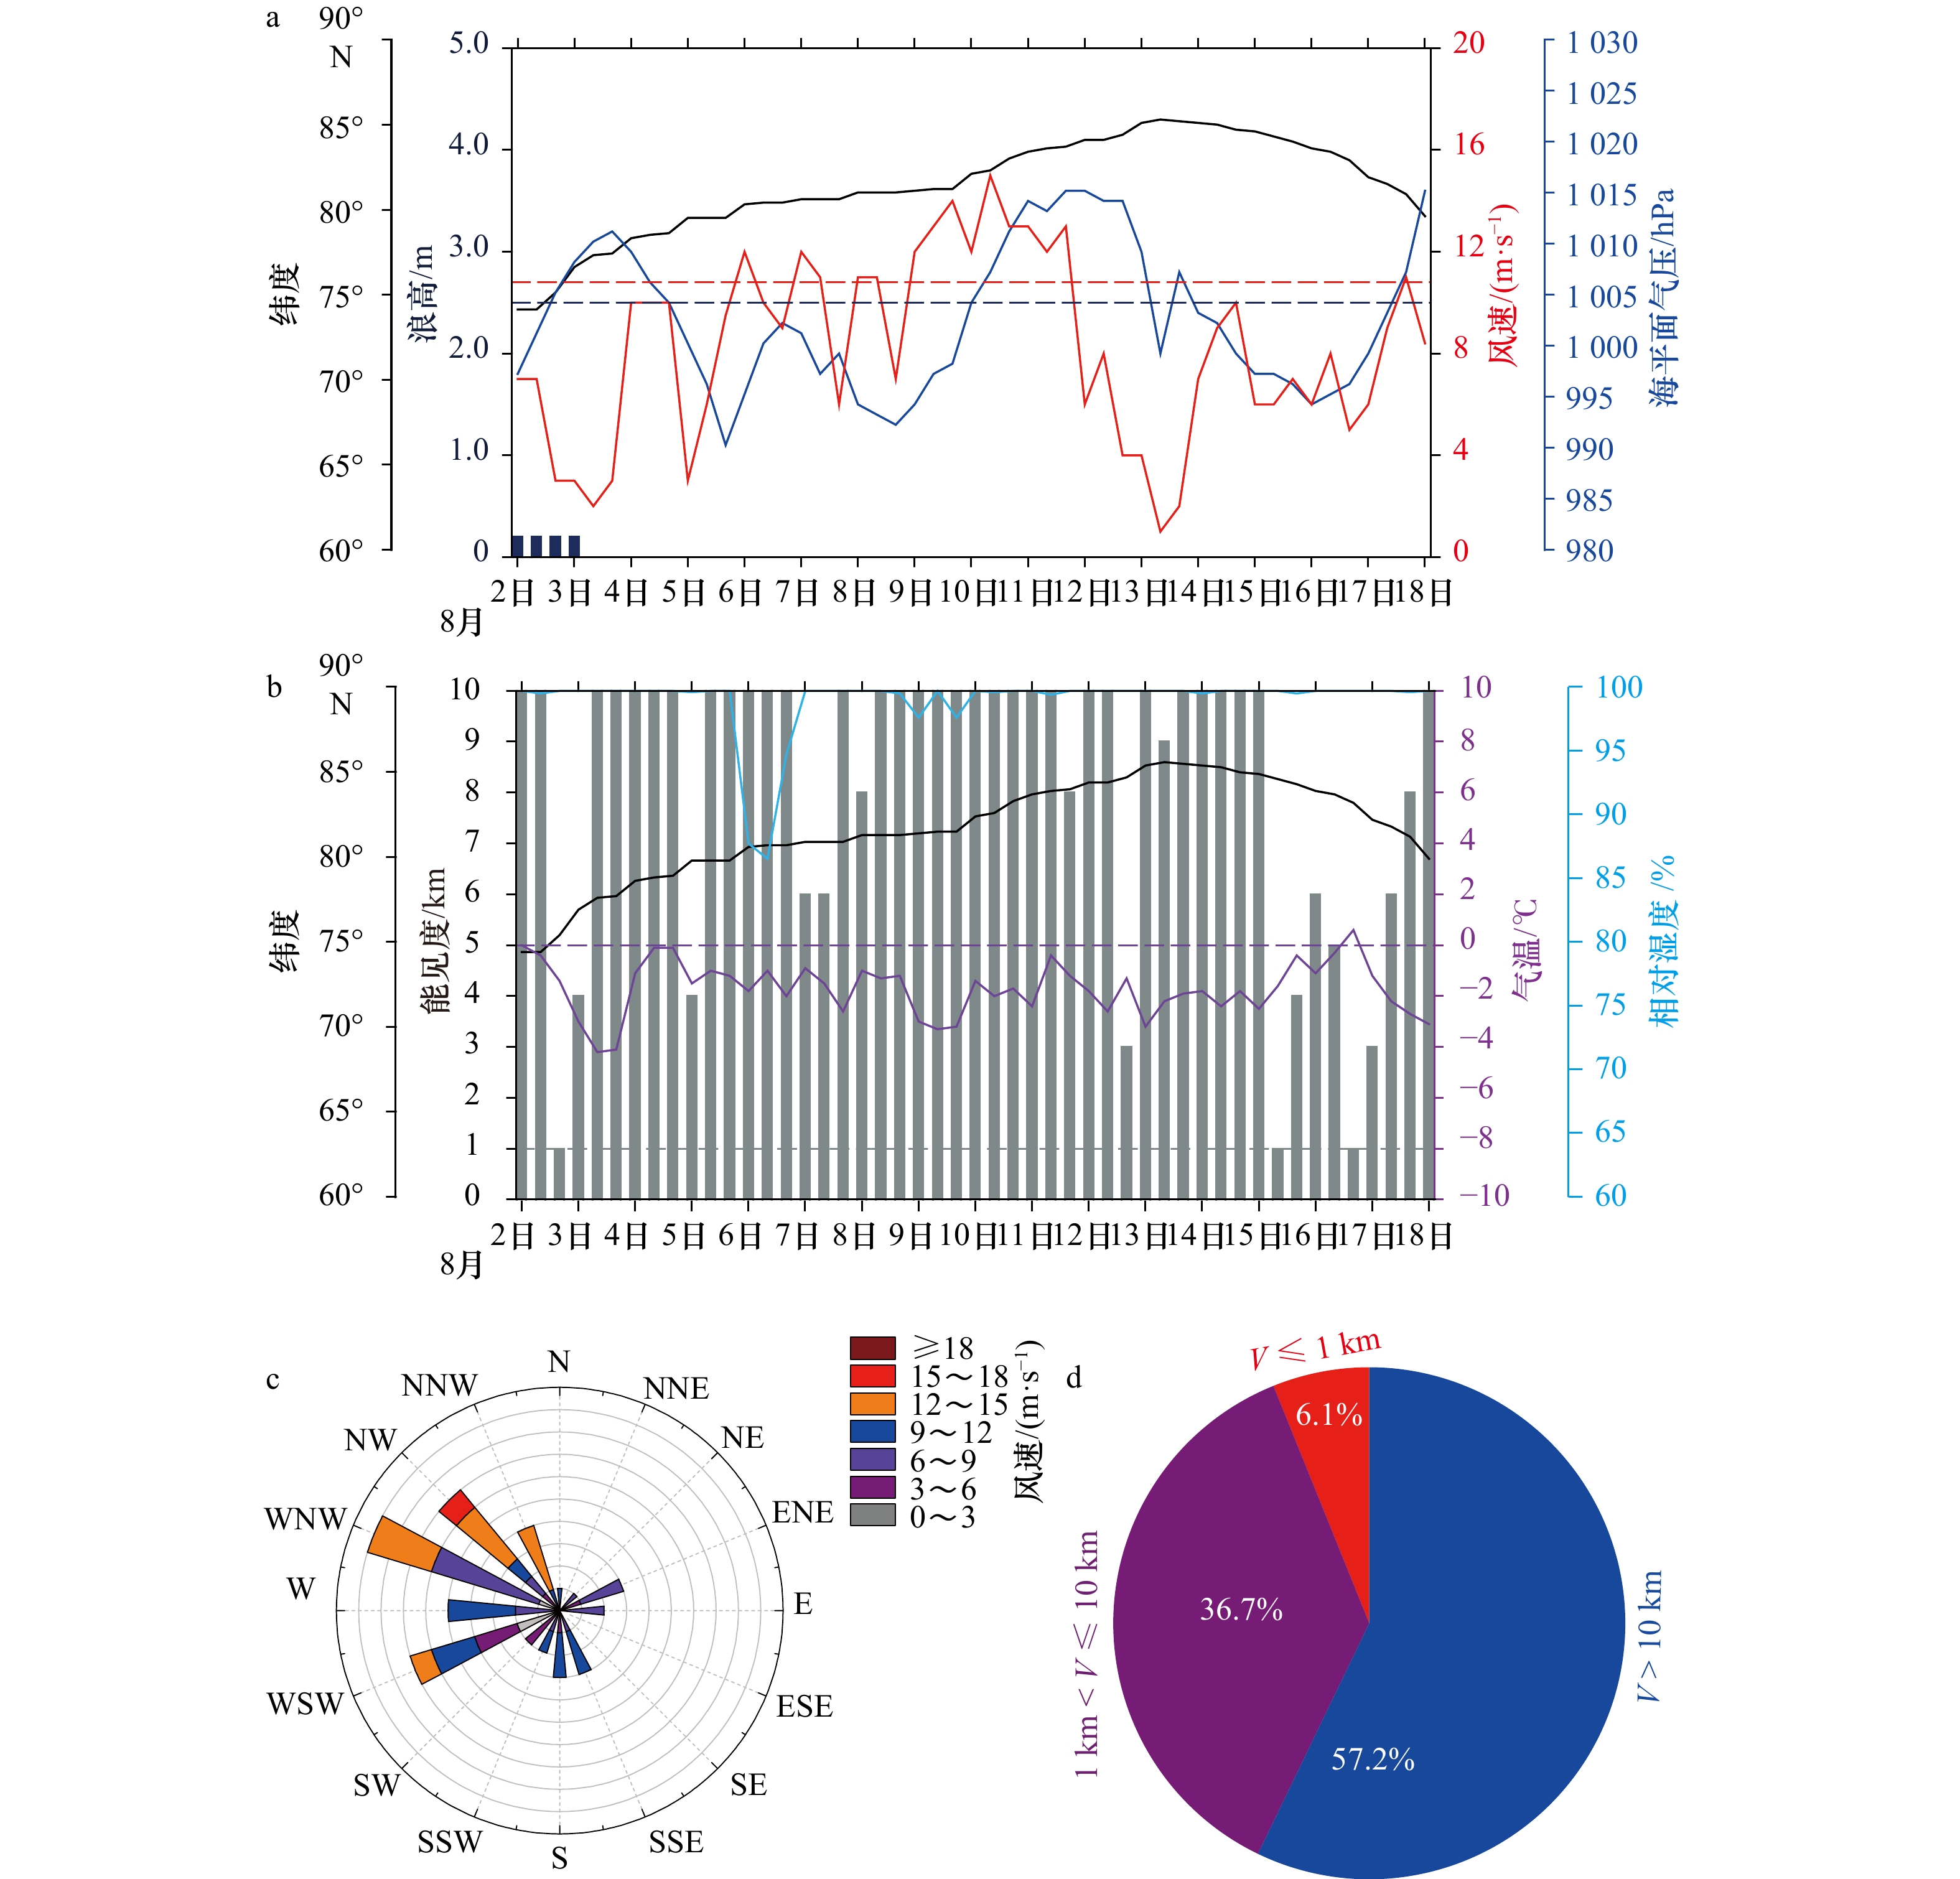
图 14 2017年雪龙号穿越中央航道期间近地面气象要素走航观测结果
a. 海平面气压、风速、浪高及纬度时间序列;b. 气温、相对湿度、能见度及纬度时间序列;c. 风玫瑰图;d. 能见度(V)概率分布
Fig. 14 The results of the near-surface meteorological parameters obtained during Xuelong vessel crossing the trans-Arctic northwest passage in 2017
a. The time series of sea level pressure, wind speed, wave height and the latitude; b. the time series of air temperature, relative humidity, visibility and the latitude; c. wind rose plot; d. the percentage weather of distribution different visibility (V)
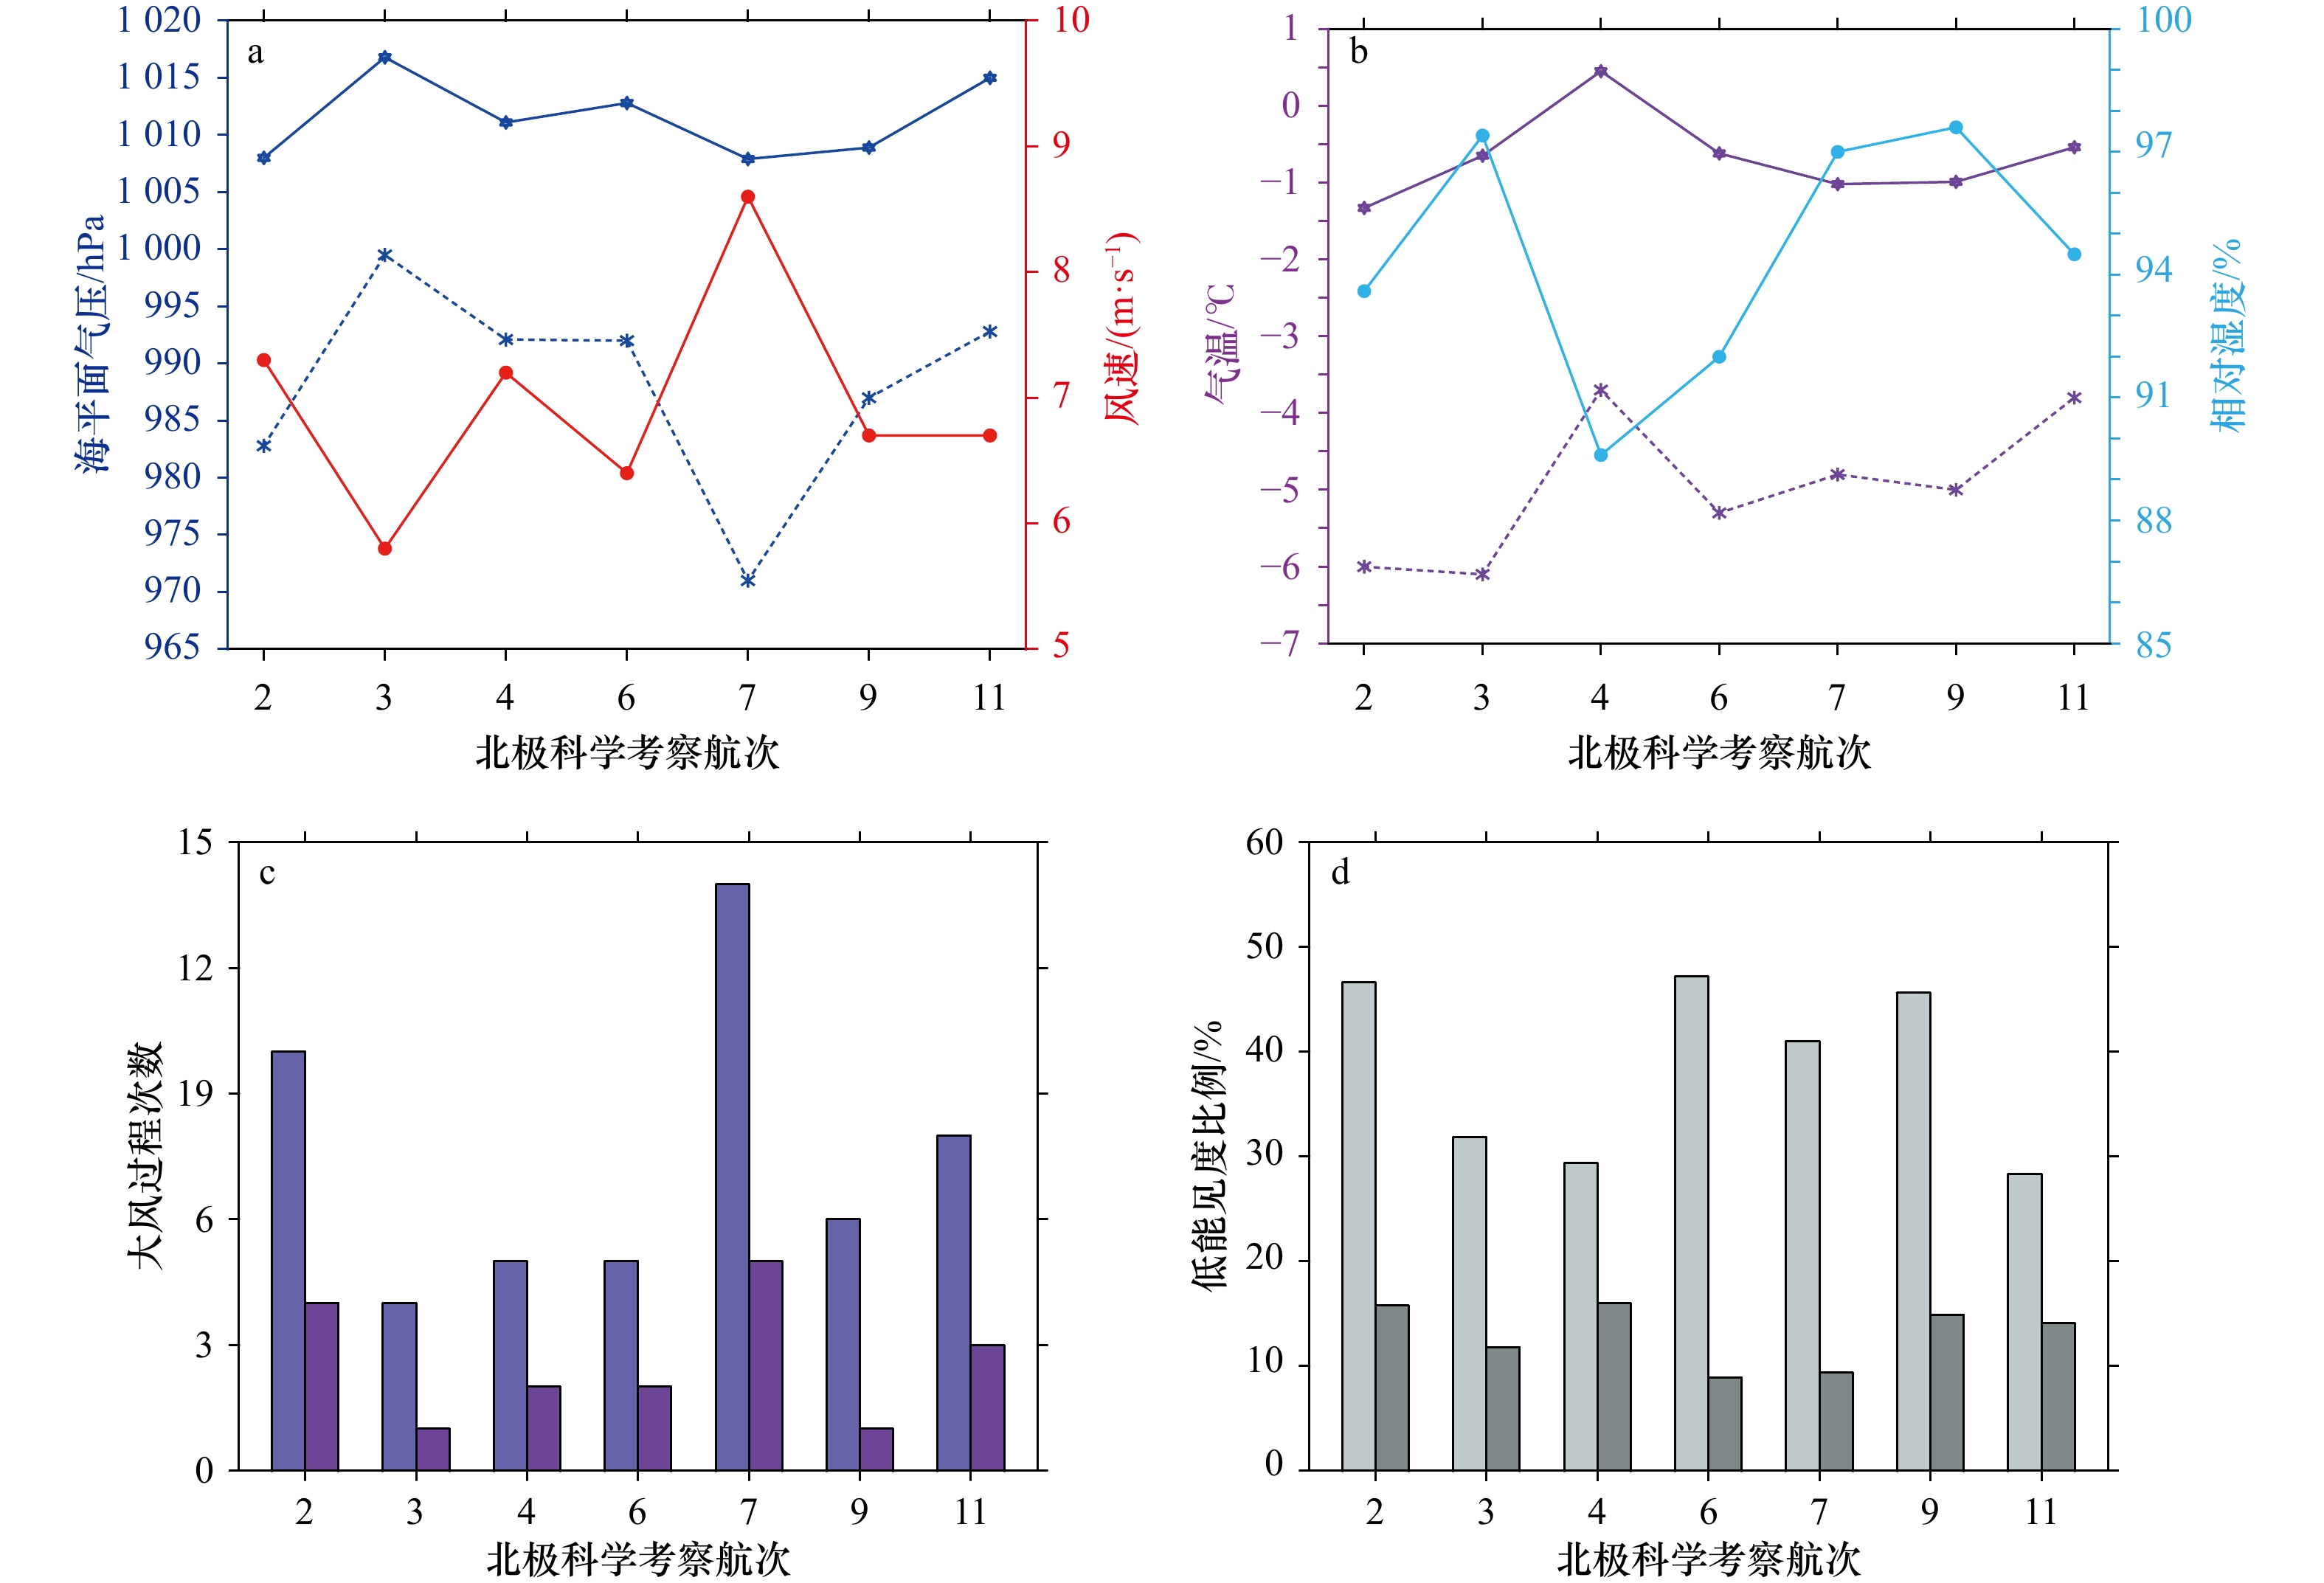
图 15 7个常规航次70°N以北考察海域近地面气象要素统计
a. 平均海平面气压(蓝色实线)、最低海平面气压(蓝色虚线)和平均风速(红色实线);b. 平均气温(紫色实线)、最低气温(紫色虚线)和平均相对湿度(蓝色实线);c. 6级(淡紫色)和7级(深紫色)大风过程次数;d. 能见度在1~10 km比例(浅灰色)和能见度≤1 km比例(深灰色)
Fig. 15 Statistics of the near-surface meteorological parameters in the area north of 70°N during the seven conventional expeditions
a. The blue solid line, the blue dashed line and red solid line represent the mean sea level pressure, the minimum sea level pressure and the mean wind speed, respectively; b. the purple solid line, purple dashed line and blue solid line represent the mean air temperature, the minimum air temperature and the mean relative humidity, respectively; c. the light purple and dark purple bars represent the numbers of high wind processes with more than level 6 wind and more than level 7 wind, respectively; d. the light grey and dark grey bars represent the percentage of visibility between 1 km and 10 km and less than 1 km, respectively

图 16 7个常规航次70°N以北考察海域风玫瑰图(a)和能见度(V)概率分布(b)
Fig. 16 The wind rose (a) and the percentage distribution of different visibility (V) (b) in the area north of 70°N during the seven conventional expedition
表 1 7个常规航次70°N以北气象观测日期和人工观测次数
Tab. 1 Meteorological observation period and the number of manual observations in the area north of 70 °N during the 7 conventional expeditions
考察航次(年) 观测日期 人工观测次数 2(2003) 7月31日至9月10日 165 3(2008) 8月3日至9月8日 146 4(2010) 7月22日至8月30日 119 6(2014) 7月30日至9月8日 123 7(2016) 7月25日至9月2日 117 9(2018) 7月30日至9月6日 114 11(2020) 7月28日至9月11日 184  下载: 导出CSV
-
[1] Simmonds I, Li Muyuan. Trends and variability in polar sea ice, global atmospheric circulations, and baroclinicity[J]. Annals of the New York Academy of Sciences, 2021, 1504(1): 167−186. doi: 10.1111/nyas.14673 [2] Simmonds I, Keay K. Extraordinary September Arctic sea ice reductions and their relationships with storm behavior over 1979–2008[J]. Geophysical Research Letters, 2009, 36(19): L19715. doi: 10.1029/2009GL039810 [3] Cavalieri D J, Parkinson C L. Arctic sea ice variability and trends, 1979–2010[J]. The Cryosphere, 2012, 6(4): 881−889. doi: 10.5194/tc-6-881-2012 [4] Parkinson C L, DiGirolamo N E. New visualizations highlight new information on the contrasting Arctic and Antarctic sea-ice trends since the late 1970s[J]. Remote Sensing of Environment, 2016, 183: 198−204. doi: 10.1016/j.rse.2016.05.020 [5] Liang Xi, Li Xichen, Bi Haibo, et al. A comparison of factors that led to the extreme sea ice minima in the twenty-first century in the Arctic Ocean[J]. Journal of Climate, 2022, 35(4): 1249−1265. doi: 10.1175/JCLI-D-21-0199.1 [6] 李珵, 苏洁, 魏立新, 等. 北极中央区海冰低密集度现象研究[J]. 海洋学报, 2018, 40(11): 33−45.Li Cheng, Su Jie, Wei Lixin, et al. Exploration of anomalous low sea ice concentration phenomenon in the Central Arctic[J]. Haiyang Xuebao, 2018, 40(11): 33−45. [7] Kwok R. Arctic sea ice thickness, volume, and multiyear ice coverage: losses and coupled variability (1958–2018)[J]. Environmental Research Letters, 2018, 13(10): 105005. doi: 10.1088/1748-9326/aae3ec [8] Bi Haibo, Zhang Jinlun, Wang Yunhe, et al. Arctic sea ice volume changes in terms of age as revealed from satellite observations[J]. IEEE Journal of Selected Topics in Applied Earth Observations and Remote Sensing, 2018, 11(7): 2223−2237. doi: 10.1109/JSTARS.2018.2823735 [9] Markus T, Stroeve J C, Miller J. Recent changes in Arctic sea ice melt onset, freezeup, and melt season length[J]. Journal of Geophysical Research: Oceans, 2009, 114(C12): C12024. doi: 10.1029/2009JC005436 [10] Stroeve J, Barrett A, Serreze M, et al. Using records from submarine, aircraft and satellites to evaluate climate model simulations of Arctic sea ice thickness[J]. The Cryosphere, 2014, 8(5): 1839−1854. doi: 10.5194/tc-8-1839-2014 [11] Stroeve J C, Crawford A D, Stammerjohn S. Using timing of ice retreat to predict timing of fall freeze ‐ up in the Arctic[J]. Geophysical Research Letters, 2016, 43(12): 6332−6340. doi: 10.1002/2016GL069314 [12] Serreze M C, Crawford A D, Stroeve J C, et al. Variability, trends, and predictability of seasonal sea ice retreat and advance in the Chukchi Sea[J]. Journal of Geophysical Research: Oceans, 2016, 121(10): 7308−7325. doi: 10.1002/2016JC011977 [13] Stroeve J, Notz D. Changing state of Arctic sea ice across all seasons[J]. Environmental Research Letters, 2018, 13(10): 103001. doi: 10.1088/1748-9326/aade56 [14] 李春花, 李明, 赵杰臣, 等. 近年北极东北和西北航道开通状况分析[J]. 海洋学报, 2014, 36(10): 33−47.Li Chunhua, Li Ming, Zhao Jiechen, et al. Navigable status analysis of Arctic northeast and northwest passage in recent years[J]. Haiyang Xuebao, 2014, 36(10): 33−47. [15] 季青, 董江, 庞小平, 等. 北极东北航道夏季海冰冰情与适航性分析[J]. 船舶力学, 2021, 25(8): 991−1000. doi: 10.3969/j.issn.1007-7294.2021.08.002Ji Qing, Dong Jiang, Pang Xiaoping, et al. Analysis of sea ice conditions and navigability of Arctic northeast passage in summer[J]. Journal of Ship Mechanics, 2021, 25(8): 991−1000. doi: 10.3969/j.issn.1007-7294.2021.08.002 [16] Zhou Xiangying, Min Chao, Yang Yijun, et al. Revisiting trans-arctic maritime navigability in 2011–2016 from the perspective of sea ice thickness[J]. Remote Sensing, 2021, 13(14): 2766. doi: 10.3390/rs13142766 [17] Cao Yunfeng, Liang Shunlin, Sun Laixiang, et al. Trans-Arctic shipping routes expanding faster than the model projections[J]. Global Environmental Change, 2022, 73: 102488. doi: 10.1016/j.gloenvcha.2022.102488 [18] Mudryk L R, Dawson J, Howell S E L, et al. Impact of 1, 2 and 4 °C of global warming on ship navigation in the Canadian Arctic[J]. Nature Climate Change, 2021, 11(8): 673−679. doi: 10.1038/s41558-021-01087-6 [19] Chen Jinlei, Kang Shichang, Chen Changsheng, et al. Changes in sea ice and future accessibility along the Arctic northeast passage[J]. Global and Planetary Change, 2020, 195: 103319. doi: 10.1016/j.gloplacha.2020.103319 [20] Wei Ting, Yan Qing, Qi Wei, et al. Projections of Arctic sea ice conditions and shipping routes in the twenty-first century using CMIP6 forcing scenarios[J]. Environmental Research Letters, 2020, 15(10): 104079. doi: 10.1088/1748-9326/abb2c8 [21] Li Xueke, Stephenson S R, Lynch A H, et al. Arctic shipping guidance from the CMIP6 ensemble on operational and infrastructural timescales[J]. Climatic Change, 2021, 167(1/2): 23. [22] Min Chao, Yang Qinghua, Chen Dake, et al. The emerging Arctic shipping corridors[J]. Geophysical Research Letters, 2022, 49(10): e2022GL099157. [23] 闵超, 杨清华. 北极海洋环境保护工作组(PAME)北极航运状况报告介绍[J]. 极地研究, 2020, 32(2): 279−280.Min Chao, Yang Qinghua. Introduction to the arctic shipping status report of the protection of the Arctic Marine Environment Working Group (PAME)[J]. Chinese Journal of Polar Research, 2020, 32(2): 279−280. [24] 解思梅, 薛振和, 曲绍厚, 等. 北冰洋夏季的海雾[J]. 海洋学报, 2001, 23(6): 40−50.Xie Simei, Xue Zhenhe, Qu Shaohou, et al. Summer Arctic sea fog[J]. Haiyang Xuebao, 2001, 23(6): 40−50. [25] Yamagami A, Matsueda M, Tanaka H L. Medium-range forecast skill for extraordinary Arctic cyclones in summer of 2008–2016[J]. Geophysical Research Letters, 2018, 45(9): 4429−4437. doi: 10.1029/2018GL077278 [26] Inoue J. Review of forecast skills for weather and sea ice in supporting Arctic navigation[J]. Polar Science, 2021, 27: 100523. doi: 10.1016/j.polar.2020.100523 [27] 孙启振, 丁卓铭, 沈辉, 等. 我国极地数值天气预报系统的初步建立与应用[J]. 海洋预报, 2017, 34(4): 1−10. doi: 10.11737/j.issn.1003-0239.2017.04.001Sun Qizhen, Ding Zhuoming, Shen Hui, et al. Polar numerical weather prediction system: preliminary establishment and application[J]. Marine Forecasts, 2017, 34(4): 1−10. doi: 10.11737/j.issn.1003-0239.2017.04.001 [28] Ren Shihe, Liang Xi, Sun Qizhen, et al. A fully coupled Arctic sea-ice–ocean–atmosphere model (ArcIOAM v1.0) based on C-Coupler2: model description and preliminary results[J]. Geoscientific Model Development, 2021, 14(2): 1101−1124. doi: 10.5194/gmd-14-1101-2021 [29] Randriamampianina R, Bormann N, Køltzow M A Ø, et al. Relative impact of observations on a regional Arctic numerical weather prediction system[J]. Quarterly Journal of the Royal Meteorological Society, 2021, 147(737): 2212−2232. doi: 10.1002/qj.4018 [30] Lawrence H, Bormann N, Sandu I, et al. Use and impact of Arctic observations in the ECMWF numerical weather prediction system[J]. Quarterly Journal of the Royal Meteorological Society, 2019, 145(725): 3432−3454. doi: 10.1002/qj.3628 [31] Gascard J C, Riemann-Campe K, Gerdes R, et al. Future sea ice conditions and weather forecasts in the Arctic: implications for Arctic shipping[J]. Ambio, 2017, 46(3): 355−367. [32] 中华人民共和国国家质量监督检验检疫总局, 中国国家标准化管理委员会. GB/T 12763.3−2007, 海洋调查规范 第3部分: 海洋气象观测[S]. 北京: 中国标准出版社, 2008.General Administration of Quality Supervision, Inspection and Quarantine of the People’s Republic of China, Standardization Administration of the People’s Republic of China. GB/T 12763.3−2007, Specifications for oceanographic survey-Part 3: Marine meteorological observations[S]. Beijing: Standards Press of China, 2008. [33] 中国气象局. 地面气象观测规范[M]. 北京: 气象出版社, 2003: 126.China Meteorological Administration. Specifications for Surface Meteorological Observation[M]. Beijing: China Meteorological Press, 2003: 126. [34] Hersbach H, Bell B, Berrisford P, et al. The ERA5 global reanalysis[J]. Quarterly Journal of the Royal Meteorological Society, 2020, 146(730): 1999−2049. doi: 10.1002/qj.3803 [35] Chylek P, Folland C, Klett J D, et al. Annual mean Arctic amplification 1970–2020: Observed and simulated by CMIP6 climate models[J]. Geophysical Research Letters, 2022: e2022GL099371. -


计量
- 文章访问数: 989
- HTML全文浏览量: 290
- PDF下载量: 165
- 被引次数: 0
