

Long-term changes of phytoplankton community structure with relation to environmental factors in the Daya Bay in summer
-
摘要: 本文分析了1999−2017年大亚湾夏季浮游植物群落结构的长期变化及其与环境因子的关系,结果显示,大亚湾海域海水温度呈显著下降趋势,盐度呈显著上升趋势;溶解无机氮浓度出现较大幅度提升,2008−2017年间大亚湾溶解无机氮浓度平均值比1999−2007年提升了72.73%;大亚湾浮游植物种类数变化趋势不明显,主要优势种没有发生明显变化,柔弱伪菱形藻(Pseudonitzschia delicatissima)为区域第一优势种,其次为中肋骨条藻(Skeletonema costatum);浮游植物总丰度、硅藻丰度、甲藻丰度以及主要种类中的柔弱伪菱形藻、中肋骨条藻和叉角藻(Ceratium furca)丰度均呈现显著上升趋势;浮游植物生物多样性指数(H′)和均匀度(J)均呈下降趋势。人类活动所引起的溶解无机氮浓度大幅升高以及外海水入侵加强所引起的海水温度降低和盐度上升导致了浮游植物丰度的上升、优势种的单一化和生物多样性指数的下降。Abstract: Long-term changes of phytoplankton community structure with relation to environmental factors in the Daya Bay in summer between 1999 and 2017 were investigated. The results showed that seawater temperature showed a significant decreasing trend, while salinity increased significantly. During the period 2008 to 2017, the dissolved inorganic nitrogen (DIN) annual mean concentration increased by 72.73% relative to 1999 to 2007. Trend of phytoplankton species number and dominant species were not significant, Pseudonitzschia delicatissima was overwhelmingly dominant followed by Skeletonema costatum. The abundance of total phytoplankton, diatoms, dinoflagellates, and some dominant species (Pseudonitzschia delicatissima, Skeletonema costatum, Ceratium furca) significantly increased during the study period in the Daya Bay. Species diversity and evenness indices showed downward trends. The analysis showed that the increased DIN concentration induced by human activities and seawater temperature and salinity changes were the main reasons for long-term changes of phytoplankton community structure in the Daya Bay in summer.
-
Key words:
- Daya Bay /
- phytoplankton /
- long-term changes /
- nutrients
-
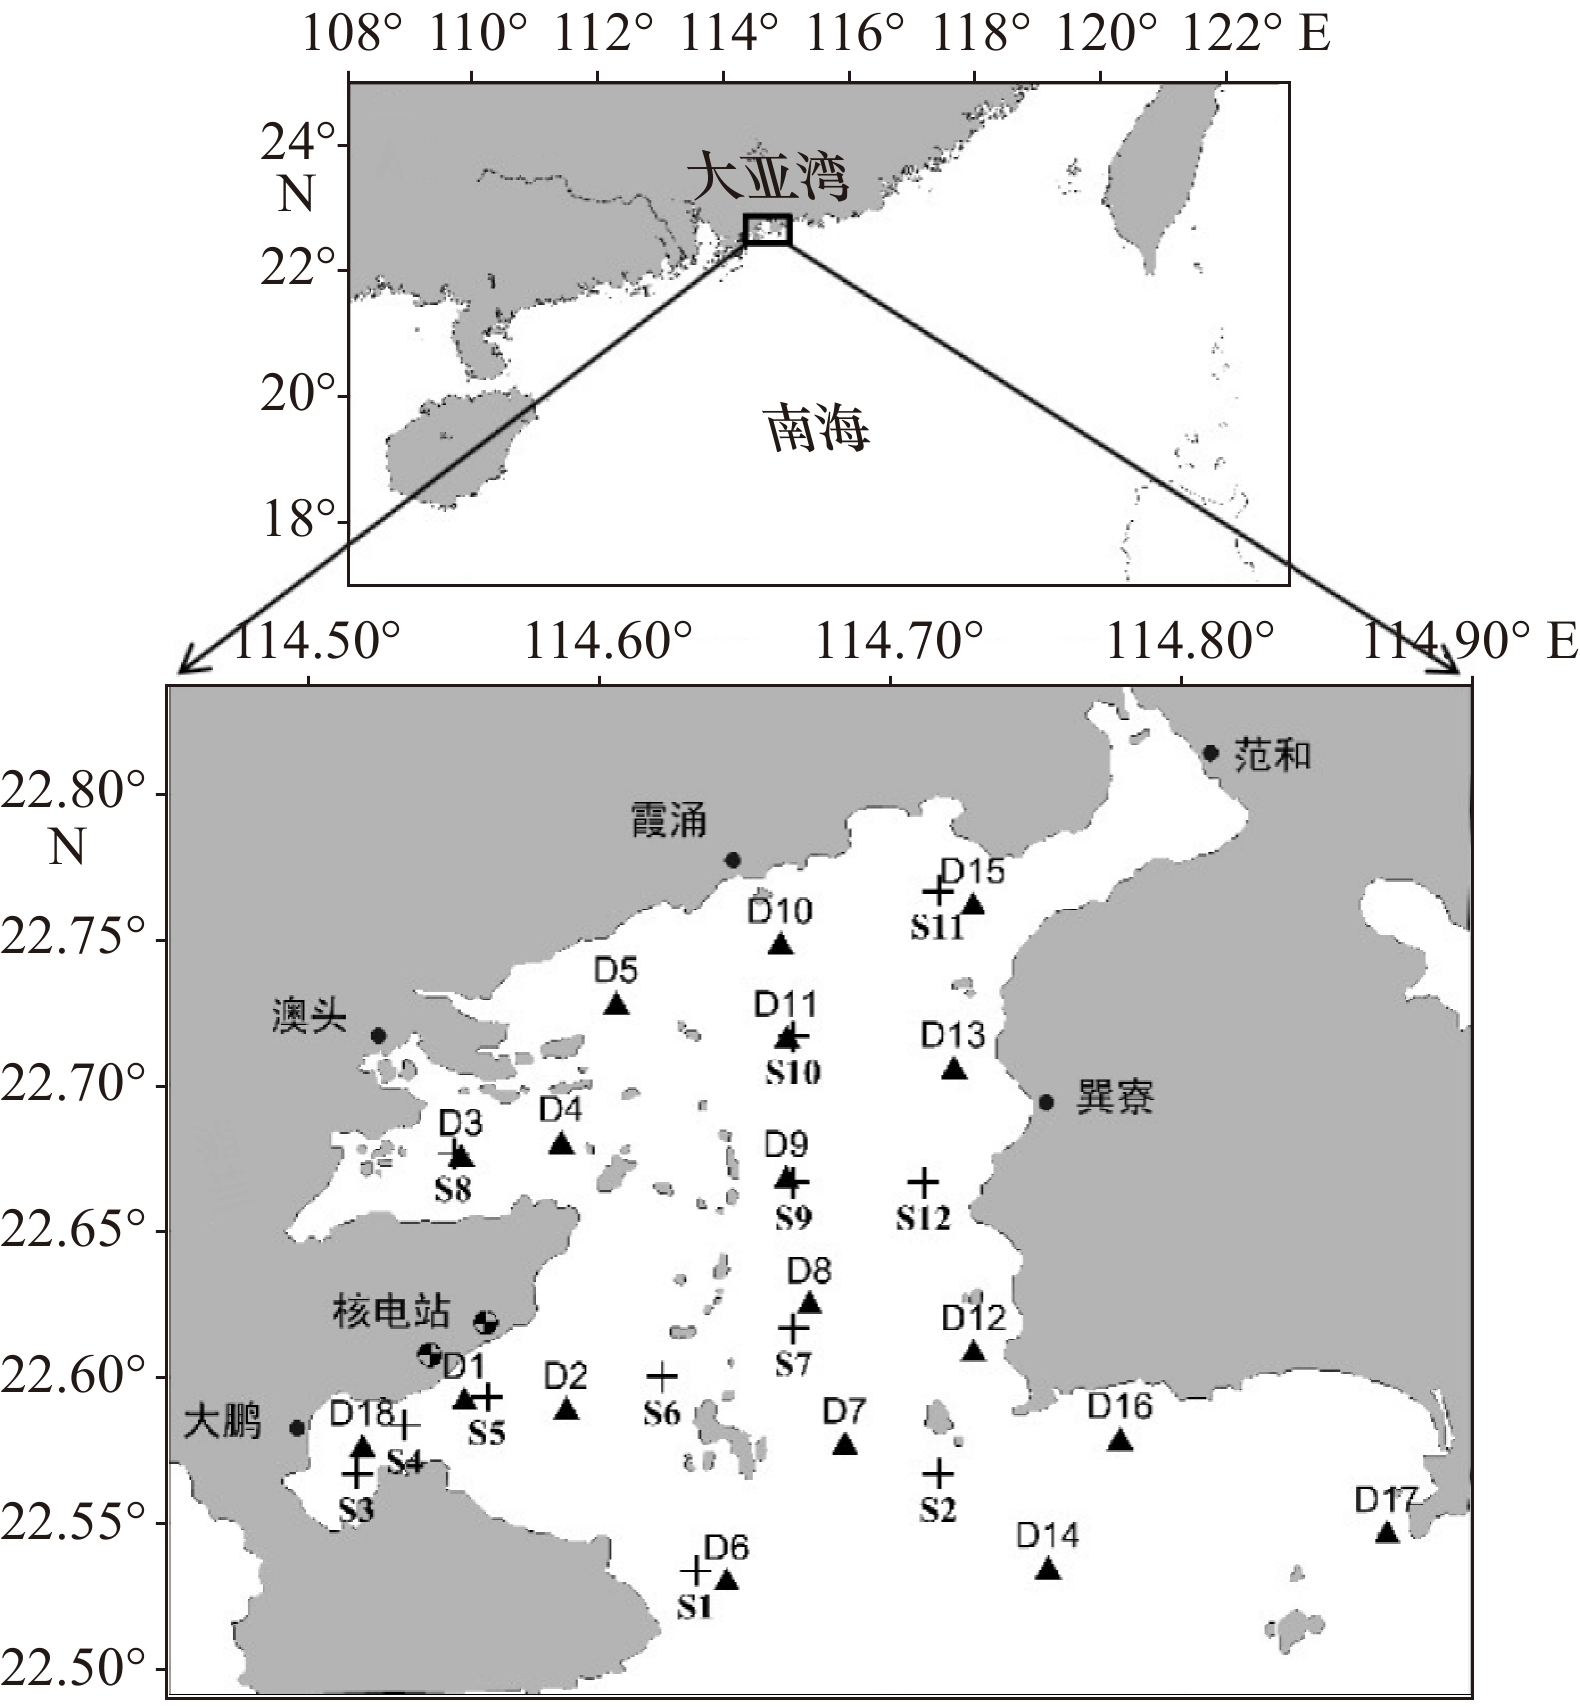
图 1 调查区域和站位分布
“+”为中国科学院大亚湾海洋生物综合实验站调查站位;“▲”为国家海洋局南海环境监测中心调查站位“+” represents the stations of Daya Bay Marine Biology Research Station, Chinese Academy of Sciences; “▲” represents the stations of South China Sea Environmental Monitoring Center, State Oceanic Administration
Fig. 1 Distribution of study area and monitoring stations

图 2 1999−2017年大亚湾夏季环境因子的长期变化
Fig. 2 Long-term changes of environmental variables in the Daya Bay in summer between 1999 and 2017
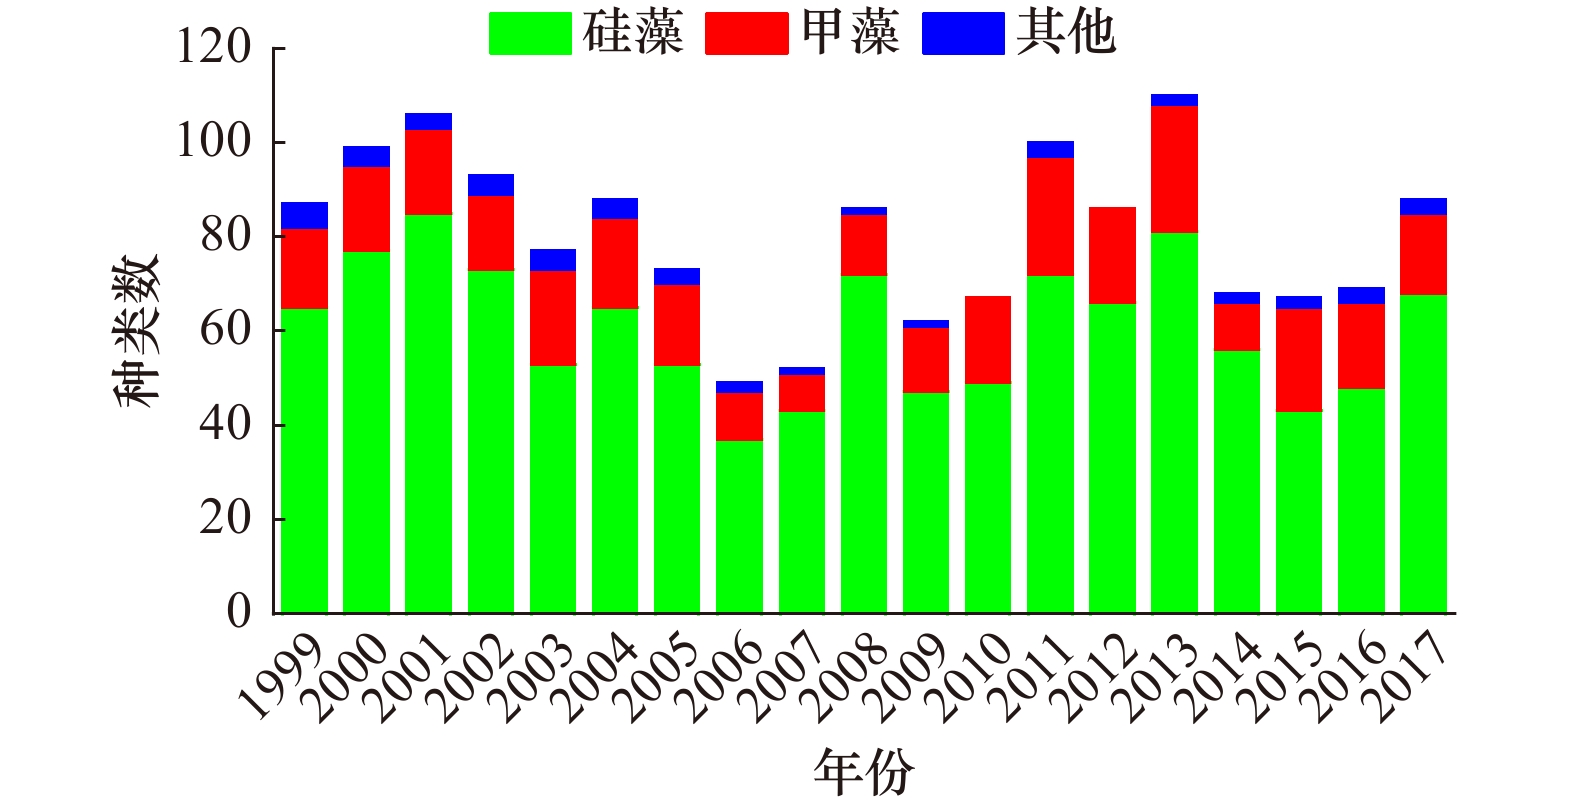
图 3 1999−2017年大亚湾夏季浮游植物种类数长期变化
Fig. 3 Long-term changes of phytoplankton species number in the Daya Bay in summer between 1999 and 2017
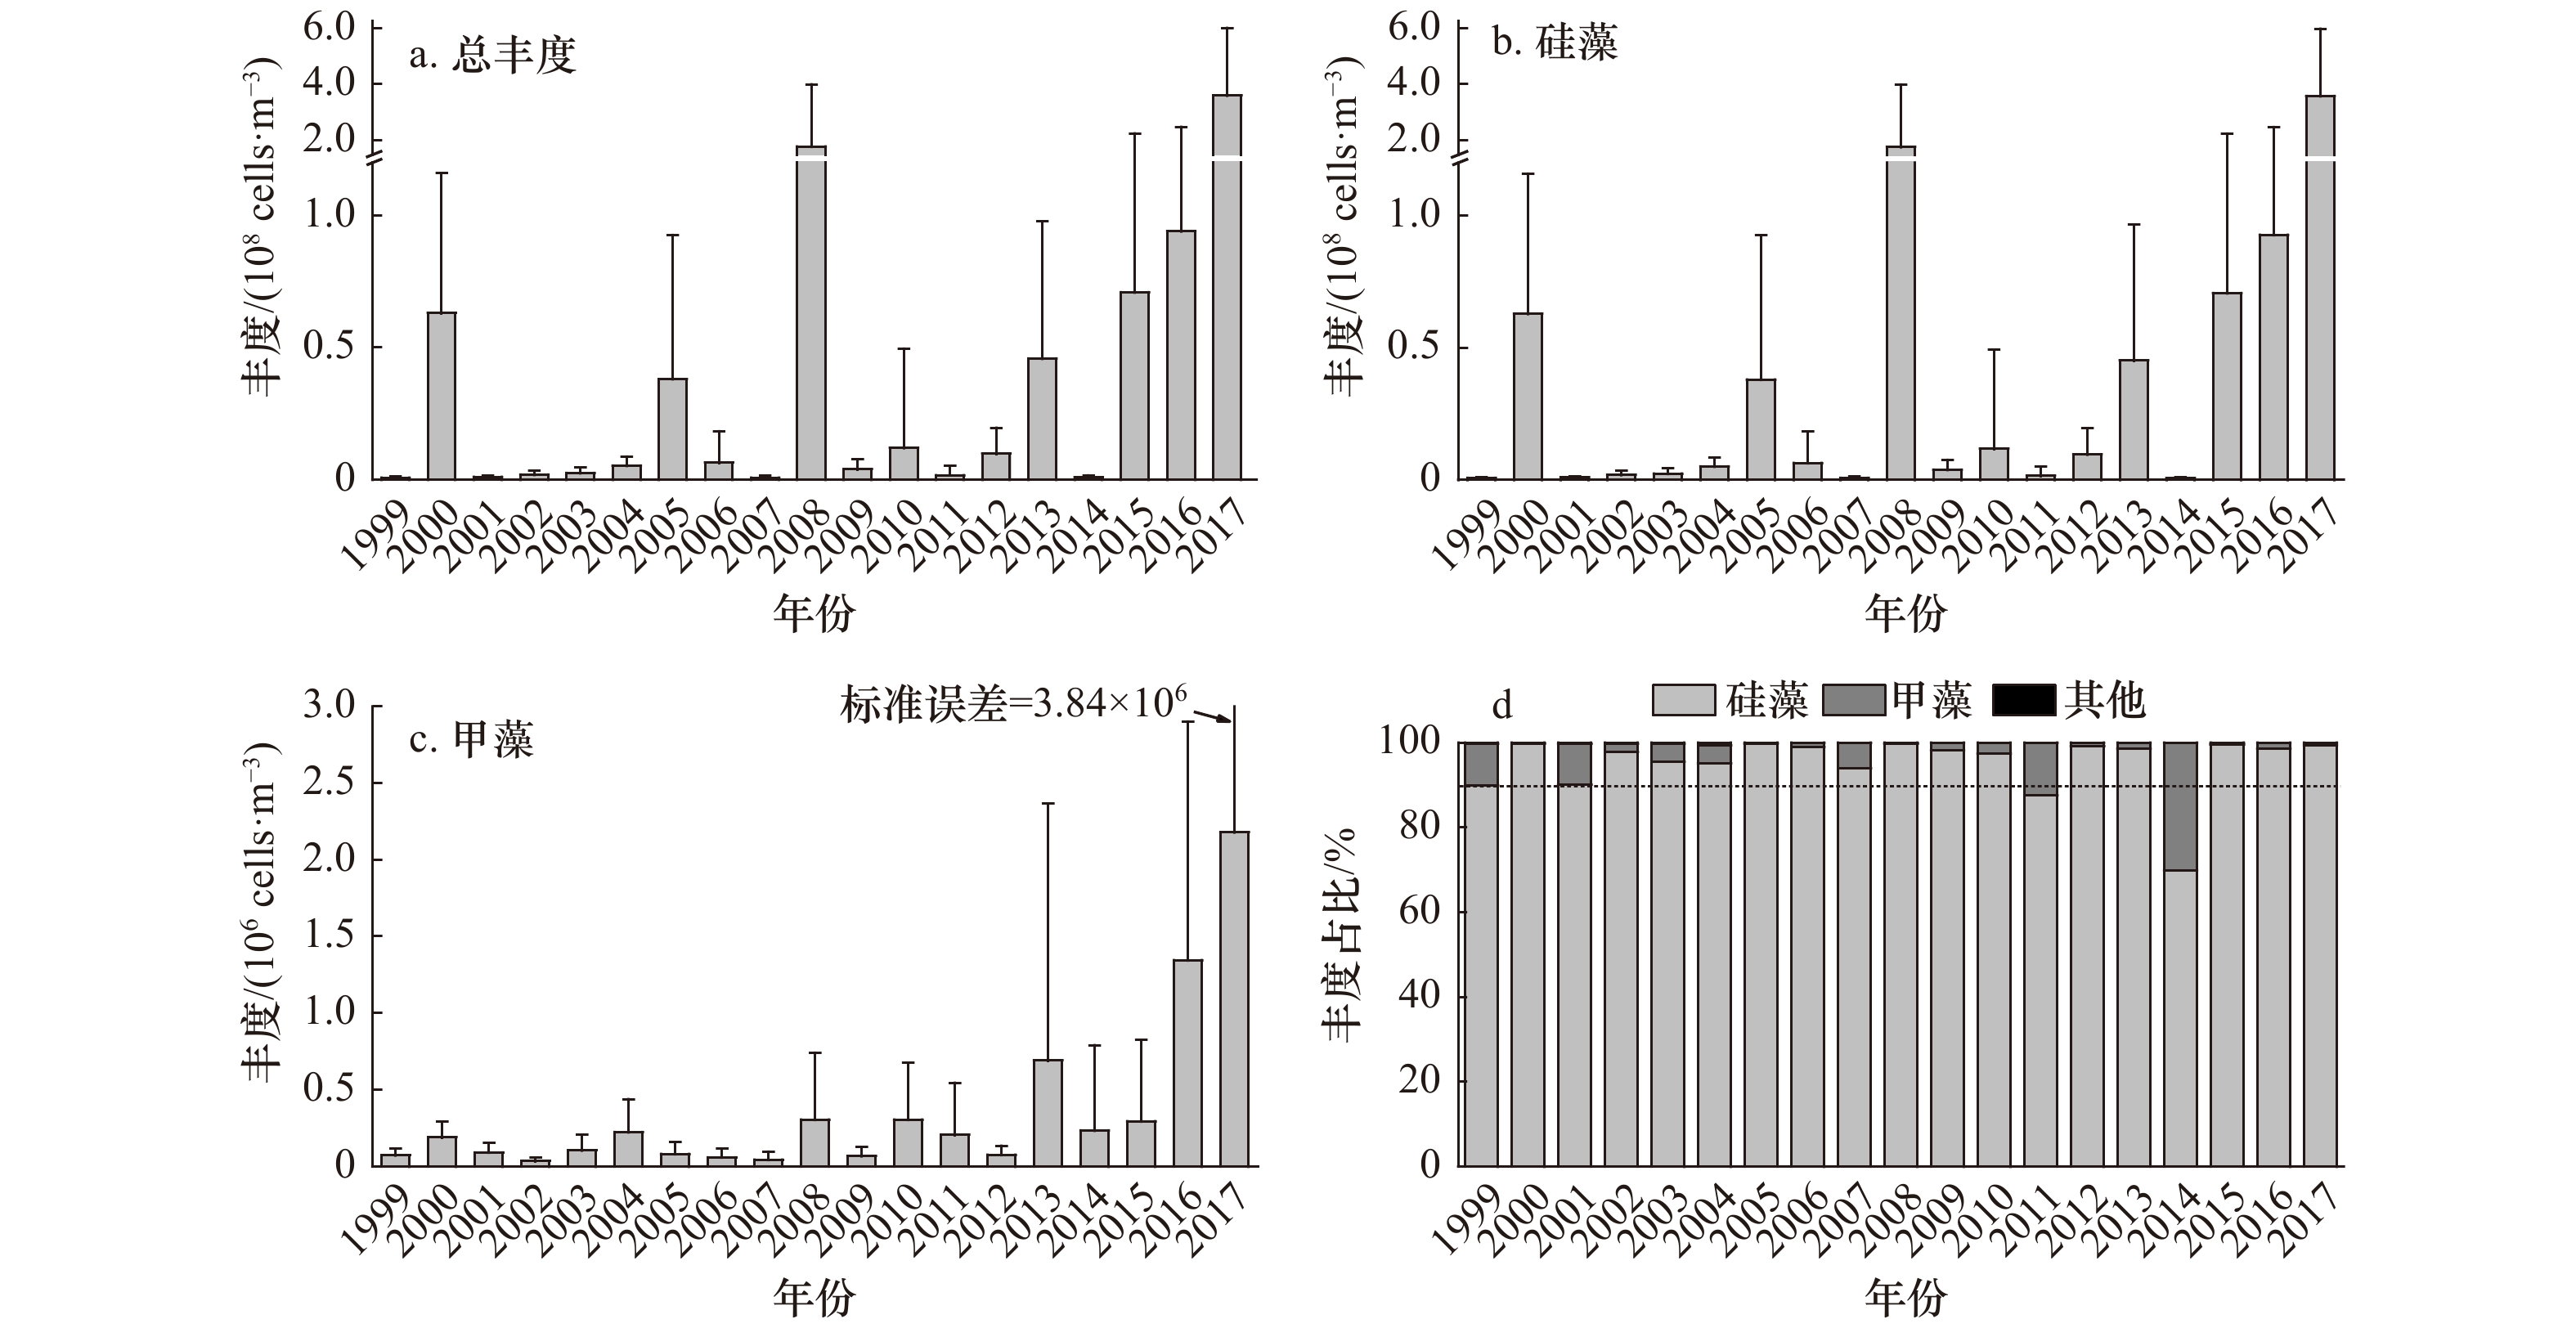
图 4 1999−2017年大亚湾夏季浮游植物生物量的长期变化
Fig. 4 Long-term changes of phytoplankton groups abundance in the Daya Bay in summer between 1999 and 2017

图 5 1999−2017年大亚湾夏季几种主要浮游植物种类丰度和占比的长期变化
Fig. 5 Long-term changes of phytoplankton dominant species abundance and their abundance percentages in the Daya Bay in summer between 1999 and 2017
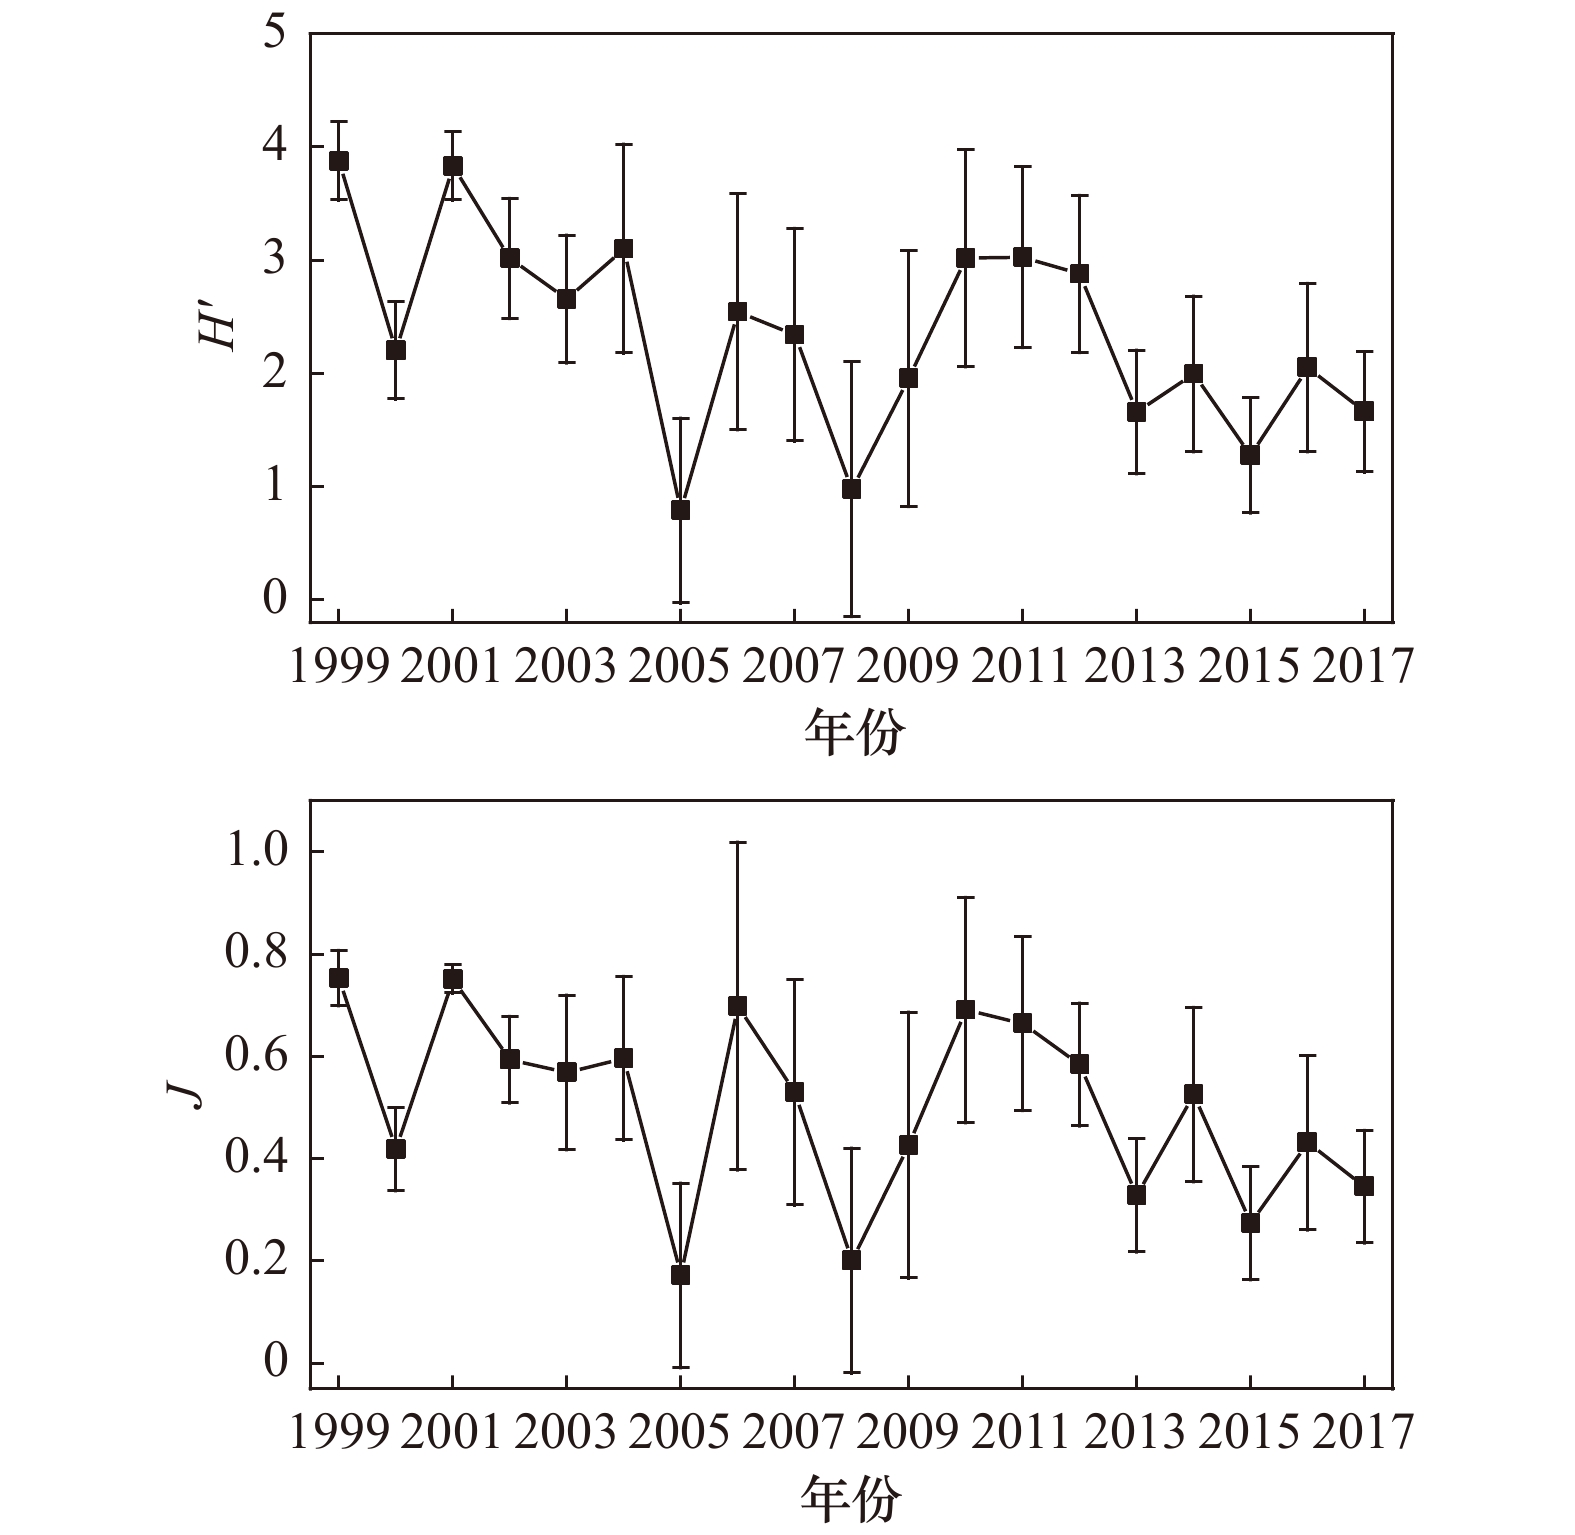
图 6 1999−2017年大亚湾夏季浮游植物生物多样性指数(H′)和均匀度指数(J)的长期变化
Fig. 6 Long-term changes of species diversity indes (H′
) and evenness indes (J) in the Daya Bay in summer between 1999 and 2017 
图 7 冗余分析图
a. 各年份与环境因子的相关性;b. 不同浮游植物种类丰度(小向量)与环境因子(大向量)的相关性;图中代码所代表的环境因子和浮游植物种类见表2;其中环境因子对浮游植物丰度变化的解释率为29.30%,前两轴的特征值分别用λ1和λ2表示
Fig. 7 Correlation plots of the redundancy analysis
a. The relationship between the environmental factors and sample years; b. the relationship between the abundance of phytoplankton species (small vectors) and environmental factors (large vectors); codes of the phytoplankton species are as in Table 2; the plots display 29.30% of the variance in the phytoplankton abundance, and eigenvalues of the first two axes are indicated by λ1 and λ2
表 1 调查数据基本信息
Tab. 1 Basic information of survey data
来源 调查时间 完成站位数 完成调查的具体站位 中国科学院大亚湾海洋生物综合实验站 1999年8月4日 10 S3、S4、S5、S6、S7、S8、S9、S10、S11、S12 2000年7月22日 10 S3、S4、S5、S6、S7、S8、S9、S10、S11、S12 2001年8月9日 12 S1、S2、S3、S4、S5、S6、S7、S8、S9、S10、S11、S12 2002年8月9日 12 S1、S2、S3、S4、S5、S6、S7、S8、S9、S10、S11、S12 2003年8月27日 12 S1、S2、S3、S4、S5、S6、S7、S8、S9、S10、S11、S12 国家海洋局南海
环境监测中心2004年7月18 −19日 8 D1、D2、D4、D7、D9、D12、D14、D16 2005年7月29日至8月3日 12 D1、D2、D4、D5、D7、D9、D11、D12、D14、D15、D16、D17 2006年8月29日至9月1日 12 D1、D2、D4、D5、D7、D9、D11、D12、D14、D15、D16、D17 2007年8月12−13日 12 D1、D2、D4、D5、D7、D9、D11、D12、D14、D15、D16、D17 2008年8月28 −31日 12 D1、D2、D4、D5、D7、D9、D11、D12、D14、D15、D16、D17 2009年8月2−6日 12 D1、D2、D4、D5、D7、D9、D11、D12、D14、D15、D16、D17 2010年8月29日至9月1日 12 D1、D2、D4、D5、D7、D9、D11、D12、D14、D15、D16、D17 2011年8月24 −27日 18 D1、D2、D3、D4、D5、D6、D7、D8、D9、D10、D11、D12、D13、D14、D15、D16、D17、D18 2012年8月14 −19日 18 D1、D2、D3、D4、D5、D6、D7、D8、D9、D10、D11、D12、D13、D14、D15、D16、D17、D18 2013年8月27−31日 18 D1、D2、D3、D4、D5、D6、D7、D8、D9、D10、D11、D12、D13、D14、D15、D16、D17、D18 2014年8月19−21日 18 D1、D2、D3、D4、D5、D6、D7、D8、D9、D10、D11、D12、D13、D14、D15、D16、D17、D18 2015年8月21 −24日 18 D1、D2、D3、D4、D5、D6、D7、D8、D9、D10、D11、D12、D13、D14、D15、D16、D17、D18 2016年8月24 −28日 18 D1、D2、D3、D4、D5、D6、D7、D8、D9、D10、D11、D12、D13、D14、D15、D16、D17、D18 2017年8月9 −13日 18 D1、D2、D3、D4、D5、D6、D7、D8、D9、D10、D11、D12、D13、D14、D15、D16、D17、D18 注:数据包括表底层温度、表底层盐度、表底层营养盐(NO3-N、NO2-N、NH4-N和PO4-P)浓度、网采浮游植物丰度。  下载: 导出CSV
表 2 环境因子和浮游植物群落结构长期变化趋势的Mann-Kendall检验结果
Tab. 2 Results of the Mann-Kendall test for detection of long-term changes in the environmental factors and the phytoplankton community structure
参数(缩写) 单位 最小值至最大值 平均值 年份数 统计值 显著性(p) 温度(T) ℃ 26.25~30.50 28.33 19 −2.10 <0.05 盐度(S) 27.82~33.87 31.53 19 2.17 <0.05 无机氮浓度(DIN) µg/L 26.54~203.21 73.16 19 0.98 >0.05 无机磷浓度(DIP) µg/L 1.86~17.79 8.00 19 0.42 >0.05 氮磷比(DIN∶DIP) 5.85~85.46 30.75 19 0.21 >0.05 总丰度(Total) 105 cells/m3 7.22~3605.27 471.85 19 2.24 <0.05 硅藻丰度(DIAT) 105 cells/m3 5.46~3581.99 468.24 19 2.17 <0.05 角毛藻属丰度(Cha-sp.) 105 cells/m3 0.01~259.54 30.29 19 0.56 >0.05 圆筛藻属丰度(Cos-sp.) 105 cells/m3 0.03~2.47 0.34 19 2.31 <0.05 北方劳德藻丰度(Lau-bo) 105 cells/m3 0~129.24 7.23 16 1.76 <0.05 柔弱伪菱形藻丰度(Pse-de) 105 cells/m3 0.01~1579.22 201.91 19 2.03 <0.05 尖刺伪菱形藻丰度(Pse-pu) 105 cells/m3 0~14.61 2.44 17 −0.87 >0.05 根管藻属丰度(Rhi-sp.) 105 cells/m3 0.08~11.79 2.27 19 0.56 >0.05 中肋骨条藻丰度(Ske-co) 105 cells/m3 0.17~2692.95 186.33 19 2.03 <0.05 掌状冠盖藻丰度(Ste-pa) 105 cells/m3 0~0.35 0.04 10 −1.61 >0.05 扭鞘藻丰度(Str-th) 105 cells/m3 0~1.70 0.17 11 3.58 <0.01 菱形海线藻丰度(Tha-ni) 105 cells/m3 0~178.41 11.00 19 1.87 <0.05 伏氏海毛藻丰度(Tha-fr) 105 cells/m3 0.23~210.05 17.11 18 0.30 >0.05 甲藻丰度(DINO) 104 cells/m3 3.30~218.05 34.71 19 2.73 <0.05 短角角藻丰度(Cer-br) 104 cells/m3 0~1.55 0.19 9 −2.04 <0.05 叉角藻丰度(Cer-fur) 104 cells/m3 0.14~115.13 15.38 19 3.15 <0.01 纺锤角藻丰度(Cer-fus) 104 cells/m3 0.10~6.01 1.60 19 −0.63 >0.05 大角角藻丰度(Cer-ma) 104 cells/m3 0~8.29 1.74 18 2.12 <0.05 三叉角藻丰度(Cer-tr) 104 cells/m3 0~7.41 1.47 11 −0.93 >0.05 具尾鳍藻丰度(Din-ca) 104 cells/m3 0~6.59 0.80 17 0.78 >0.05 夜光藻丰度(Noc-sc) 104 cells/m3 0~2.67 0.71 14 −0.66 >0.05 原多甲藻属丰度(Pro-sp.) 104 cells/m3 0.17~13.65 1.88 19 1.26 >0.05 H′ 0.79~3.88 2.36 19 −2.10 <0.05 J 0.17~0.75 0.50 19 −1.89 <0.05
下载: 导出CSV
表 3 1999−2017年大亚湾夏季浮游植物优势种优势度的长期变化
Tab. 3 Dominance changes of phytoplankton dominant species in the Daya Bay in summer between 1999 and 2017
中文名 拉丁名 类群 1999年 2000年 2001年 2002年 2003年 2004年 2005年 2006年 2007年 2008年 2009年 2010年 2011年 2012年 2013年 2014年 2015年 2016年 2017年 日本星杆藻 Asterionella japonica 硅藻 0.035 变异辐杆藻 Bacteriastrum varians 硅藻 0.044 海洋角管藻 Cerataulina pelagica 硅藻 0.021 窄隙角毛藻 Chaetoceros affinis 硅藻 0.052 0.058 0.054 0.085 扁面角毛藻 Chaetoceros compressus 硅藻 0.036 旋链角毛藻 Chaetoceros curvisetus 硅藻 0.078 0.032 0.032 0.023 0.026 柔弱角毛藻 Chaetoceros debilis 硅藻 0.061 0.021 0.034 并基角毛藻 Chaetoceros decipiens 硅藻 0.041 远距角毛藻 Chaetoceros distans 硅藻 0.022 异角角毛藻 Chaetoceros diversus 硅藻 0.120 0.031 0.140 罗氏角毛藻 Chaetoceros lauderi 硅藻 0.022 洛氏角毛藻 Chaetoceros lorenzianus 硅藻 0.054 0.039 0.027 暹罗角毛藻 Chaetoceros siamense 硅藻 0.167 中心圆筛藻 Coscinodiscus centralis 硅藻 0.255 长角弯角藻 Eucampia cornuta 硅藻 0.047 薄壁半管藻 Hemiaulus membranaceus 硅藻 0.020 北方劳德藻 Lauderia borealis 硅藻 0.030 柔弱伪菱形藻 Pseudo-nitzschia delicatissima 硅藻 0.129 0.292 0.259 0.084 0.958 0.741 0.813 0.636 0.526 0.180 0.524 0.858 0.383 0.154 尖刺伪菱形藻 Pseudonitzschia pungens 硅藻 0.162 0.023 0.104 0.036 0.043 0.071 翼根管藻纤细变型 Rhizosolenia alata f. gracillima 硅藻 0.634 笔尖根管藻 Rhizosolenia styliformis 硅藻 0.022 中肋骨条藻 Skeletonema costatum 硅藻 0.266 0.026 0.242 0.042 0.501 0.085 0.042 0.532 0.025 0.147 0.026 0.075 0.110 热带骨条藻 Skeletonema tropicum 硅藻 0.023 0.637 菱形海线藻 Thalassionema nitzschioides 硅藻 0.029 0.333 0.048 0.233 0.322 0.048 0.043 0.064 0.022 0.119 0.063 0.038 0.037 伏氏海毛藻 Thalassiothrix fraenfeldii 硅藻 0.061 0.283 0.024 0.212 叉角藻 Ceratium furca 甲藻 0.021 0.023 0.024 0.266 纺锤角藻 Ceratium fusus 甲藻 0.029 大角角藻 Ceratium macroceros 甲藻 0.024 三叉角藻 Ceratium trichoceors 甲藻 0.026 0.021 锥状斯克里普藻 Scrippsiella trochoidea 甲藻 0.027 注:空白表示不占优势。
下载: 导出CSV
-
[1] Bricker S B, Longstaff B, Dennison W, et al. Effects of nutrient enrichment in the nation’s estuaries: a decade of change[J]. Harmful Algae, 2008, 8(1): 21−32. doi: 10.1016/j.hal.2008.08.028 [2] Boyce D G, Lewis M R, Worm B. Global phytoplankton decline over the past century[J]. Nature, 2010, 466(7306): 591−596. doi: 10.1038/nature09268 [3] Field C B, Behrenfeld M J, Randerson J T, et al. Primary production of the biosphere: integrating terrestrial and oceanic components[J]. Science, 1998, 281(5374): 237−240. doi: 10.1126/science.281.5374.237 [4] Murtugudde R, Beauchamp J, McClain C R, et al. Effects of penetrative radiation on the upper tropical ocean circulation[J]. Journal of Climate, 2002, 15(5): 470−486. doi: 10.1175/1520-0442(2002)015<0470:EOPROT>2.0.CO;2 [5] Sabine C L, Feely R A, Gruber N, et al. The oceanic sink for anthropogenic CO2[J]. Science, 2004, 305(5682): 367−371. doi: 10.1126/science.1097403 [6] Harding Jr L W, Gallegos C L, Perry E S, et al. Long-term trends of nutrients and phytoplankton in Chesapeake Bay[J]. Estuaries and Coasts, 2016, 39(3): 664−681. doi: 10.1007/s12237-015-0023-7 [7] Yoshida K, Chiba S, Ishimaru T. Long-term variation in the wintertime diatom community structure in Tokyo Bay, Japan (1981–2000)[J]. Plankton and Benthos Research, 2011, 6(4): 195−205. doi: 10.3800/pbr.6.195 [8] Li Yaqin, Smayda T J. Temporal variability of chlorophyll in Narragansett Bay, 1973−1990[J]. ICES Journal of Marine Science, 1998, 55(4): 661−667. doi: 10.1006/jmsc.1998.0383 [9] 丘耀文, 王肇鼎, 朱良生. 大亚湾海域营养盐与叶绿素含量的变化趋势及其对生态环境的影响[J]. 台湾海峡, 2005, 24(2): 131−139.Qiu Yaowen, Wang Zhaoding, Zhu Liangsheng. Variation trend of nutrient and chlorophyll contents and their effects on ecological environment in Daya Bay[J]. Journal of Oceanography in Taiwan Strait, 2005, 24(2): 131−139. [10] Ke Zhixin, Tan Yehui, Huang Liangmin, et al. Significantly depleted 15N in suspended particulate organic matter indicating a strong influence of sewage loading in Daya Bay, China[J]. Science of the Total Environment, 2019, 650(Pt 1): 759−768. [11] Wang Youshao, Lou Zhiping, Sun Cuici, et al. Ecological environment changes in Daya Bay, China, from 1982 to 2004[J]. Marine Pollution Bulletin, 2008, 56(11): 1871−1879. doi: 10.1016/j.marpolbul.2008.07.017 [12] 王友绍, 王肇鼎, 黄良民. 近20年来大亚湾生态环境的变化及其发展趋势[J]. 热带海洋学报, 2004, 23(5): 85−95. doi: 10.3969/j.issn.1009-5470.2004.05.012Wang Youshao, Wang Zhaoding, Huang Liangmin. Environment changes and trends in Daya Bay in recent 20 years[J]. Journal of Tropical Oceanography, 2004, 23(5): 85−95. doi: 10.3969/j.issn.1009-5470.2004.05.012 [13] Wu Meilin, Wang Youshao, Wang Yutu, et al. Scenarios of nutrient alterations and responses of phytoplankton in a changing Daya Bay, South China Sea[J]. Journal of Marine Systems, 2017, 165: 1−12. doi: 10.1016/j.jmarsys.2016.09.004 [14] Hao Yanju, Tang Danling, Boicenco L, et al. Environmental ecological response to increasing water temperature in the Daya Bay, Southern China in 1982−2012[J]. Natural Resources, 2016, 7(4): 184−192. doi: 10.4236/nr.2016.74017 [15] Song Xingyu, Huang Liangmin, Zhang Jianlin, et al. Harmful algal blooms (HABs) in Daya Bay, China: an in situ study of primary production and environmental impacts[J]. Marine Pollution Bulletin, 2009, 58(9): 1310−1318. doi: 10.1016/j.marpolbul.2009.04.030 [16] 徐恭昭. 大亚湾环境与资源[M]. 合肥: 安徽科学技术出版社, 1989.Xu Gongzhao. Environments and Resources of Daya Bay[M]. Hefei: Anhui Science and Technology Press, 1989. [17] Shannon C E. A mathematical theory of communication[J]. Bell System Technical Journal, 1948, 27(3): 379−423. doi: 10.1002/j.1538-7305.1948.tb01338.x [18] Whittaker R H. Evolution and measurement of species diversity[J]. Taxon, 1972, 21(2/3): 213−251. [19] 许金电, 蔡尚湛, 宣莉莉, 等. 粤东至闽南沿岸海域夏季上升流的调查研究[J]. 热带海洋学报, 2014, 33(2): 1−9. doi: 10.3969/j.issn.1009-5470.2014.02.001Xu Jindian, Cai Shangzhan, Xuan Lili, et al. Observational study on summertime upwelling in coastal seas between eastern Guangdong and southern Fujian[J]. Journal of Tropical Oceanography, 2014, 33(2): 1−9. doi: 10.3969/j.issn.1009-5470.2014.02.001 [20] 韩舞鹰, 马克美. 大亚湾海水混合交换特征[J]. 海洋科学, 1991, 15(2): 64−67.Han Wuying, Ma Kemei. Study on the process of sea water exchange in Daya Bay[J]. Marine Sciences, 1991, 15(2): 64−67. [21] 杨熙, 谭烨辉. 夏季外海水入侵对大亚湾浮游植物群落结构的影响[J]. 海洋科学, 2019, 43(7): 96−105. doi: 10.11759/hykx20190321003Yang Xi, Tan Yehui. Effects of shelf seawater intrusion on phytoplankton community structure in Daya Bay in the summer[J]. Marine Sciences, 2019, 43(7): 96−105. doi: 10.11759/hykx20190321003 [22] 柯伟雄. 大亚湾统计年鉴(2018)[M]. 惠州: 惠州大亚湾经济技术开发区统计局, 2018.Ke Weixiong. Daya Bay Statistical Yearbook (2018)[M]. Huizhou: Statistics Bureau of Huizhou Daya Bay Economic and Technological Development Zone, 2018. [23] 黄小平, 黄良民, 宋金明, 等. 营养物质对海湾生态环境影响的过程与机理[M]. 北京: 科学出版社, 2019.Huang Xiaoping, Huang Liangmin, Song Jinming, et al. Process and Mechanism of the Eco-Environmental Effects of Nutrients on the Semi-Enclosed Bay[M]. Beijing: Science Press, 2019. [24] 彭云辉, 王肇鼎, 高红莲, 等. 大亚湾大鹏澳养殖网箱水体无机氮的生物地球化学[J]. 海洋通报, 2001, 20(2): 16−24. doi: 10.3969/j.issn.1001-6392.2001.02.003Peng Yunhui, Wang Zhaoding, Gao Honglian, et al. Biogeochemistry of inorganic nitrogen in the water of aquicultural boxes at Dapeng’ao, Daya Bay[J]. Marine Science Bulletin, 2001, 20(2): 16−24. doi: 10.3969/j.issn.1001-6392.2001.02.003 [25] Justić D, Rabalais N N, Turner R E. Stoichiometric nutrient balance and origin of coastal eutrophication[J]. Marine Pollution Bulletin, 1995, 30(1): 41−46. doi: 10.1016/0025-326X(94)00105-I [26] 刘胜, 黄晖, 黄良民, 等. 大亚湾核电站对海湾浮游植物群落的生态效应[J]. 海洋环境科学, 2006, 25(2): 9−12, 25. doi: 10.3969/j.issn.1007-6336.2006.02.003Liu Sheng, Huang Hui, Huang Liangmin, et al. Ecological response of phytoplankton to the operation of Daya Bay nuclear power station[J]. Marine Environmental Science, 2006, 25(2): 9−12, 25. doi: 10.3969/j.issn.1007-6336.2006.02.003 [27] 韦桂峰, 王肇鼎, 练健生. 大亚湾大鹏澳水域春季浮游植物优势种的演替[J]. 生态学报, 2003, 23(11): 2285−2292. doi: 10.3321/j.issn:1000-0933.2003.11.011Wei Guifeng, Wang Zhaoding, Lian Jiansheng. Succession of dominant phytoplankton species in spring 2002 at Dapeng’ao Cove, Daya Bay[J]. Acta Ecologica Sinica, 2003, 23(11): 2285−2292. doi: 10.3321/j.issn:1000-0933.2003.11.011 [28] Baek S H, Shimode S, Han M S, et al. Growth of dinoflagellates, Ceratium furca and Ceratium fusus in Sagami Bay, Japan: the role of nutrients[J]. Harmful Algae, 2008, 7(6): 729−739. doi: 10.1016/j.hal.2008.02.007 [29] Baek S H, Shimode S, Kikuchi T. Growth of dinoflagellates, Ceratium furca and Ceratium fusus in Sagami Bay, Japan: the role of temperature, light intensity and photoperiod[J]. Harmful Algae, 2008, 7(2): 163−173. doi: 10.1016/j.hal.2007.06.006 [30] 孙晓霞, 孙松, 赵增霞, 等. 胶州湾营养盐浓度与结构的长期变化[J]. 海洋与湖沼, 2011, 42(5): 662−669. doi: 10.11693/hyhz201105006006Sun Xiaoxia, Sun Song, Zhao Zengxia, et al. Long-term changes in nutrient concentration and structure in the Jiaozhou Bay[J]. Oceanologia et Limnologia Sinica, 2011, 42(5): 662−669. doi: 10.11693/hyhz201105006006 [31] 吴玉霖, 孙松, 张永山. 环境长期变化对胶州湾浮游植物群落结构的影响[J]. 海洋与湖沼, 2005, 36(6): 487−498. doi: 10.3321/j.issn:0029-814X.2005.06.002Wu Yulin, Sun Song, Zhang Yongshan. Long-term change of environment and it’s influence on phytoplankton community structure in Jiaozhou Bay[J]. Oceanologia et Limnologia Sinica, 2005, 36(6): 487−498. doi: 10.3321/j.issn:0029-814X.2005.06.002 -

计量
- 文章访问数: 824
- HTML全文浏览量: 335
- PDF下载量: 95
- 被引次数: 0
