

Multi-dimensional analysis of atmospheric correction models on multi-spectral water depth inversion
-
摘要: 大气校正是水体定量遥感的基础与前提。本文从大气校正模型、大气校正模型参数、水体组分差异以及水深反演波段组合方式4个维度探讨大气校正模型对水深反演的影响。研究采用6S、FLAASH、ACOLITE与QUAC 4种大气校正模型,选取大陆型、海洋型与城市型气溶胶模式,以瓦胡岛西北侧与谢米亚岛周边浅水作为清洁水体研究区,以辽东浅滩与槟城海峡作为浑浊水体研究区,基于Landsat-8多光谱影像开展大气校正,并采用8种波段组合方式进行水深遥感反演。研究结果表明:(1)4种大气校正模型均可在一定程度上削弱大气对水体信号的影响;因参数选取以及研究区水体组分的不同,不同模型的校正结果存在一定差异;两类水体反射率峰值分别出现在蓝波段与绿波段;(2)6S大气校正模型鲁棒性较强,该模型因研究区水体组分发生变化导致对应的水深反演结果与其余模型相比波动较小;FLAASH模型在海洋型和城市型两种气溶胶模式水深反演结果在浑浊水体存在较为明显的差异,辽东浅滩浅水区平均相对误差相差7.9%;ACOLITE模型受水体类型影响显著且对浑浊水体具有优越性与稳定性,平均相对误差较FLAASH降低5.6%;(3)多波段水深反演精度普遍优于单波段,但反演精度与波段数目之间无显著的相关性;水深反演波段组合方式对不同研究区敏感性不同,清洁水体三波段模型的反演精度较好,浑浊水体中四波段模型的反演精度最优,平均相对误差较三波段模型降低达5.6%。Abstract: Atmospheric correction (AC) is the basis and premise of quantitative remote sensing of water column. The effects of different AC models on water depth inversion from the four aspects of AC model, AC model parameters, water component differences, and water depth inversion band combination are discussed in this paper. The research uses 6S, FLAASH, ACOLITE and QUAC four AC models, select continental, marine and urban aerosol patterns, and the shallow waters around the northwest side of Oahu Island and Shemya Island are used as the study area of clean water, while the shallow waters around Liaodong Shoal and Penang Strait are used as the study area of turbid water. AC is performed based on Landsat-8 multispectral images, and eight wavebands are used for bathymetric remote sensing inversion. The results show that: (1) all the four AC models can weaken the atmospheric influence on the water signal to some extent; the correction results of different models are somewhat different depending on the parameter selection and the components of the water column. And the peak reflectance of the two types of water column occurs in the blue and green bands, respectively. (2) The 6S model is more robust, and the bathymetric inversion results of this model are less volatile than the rest of the models due to the changes in the components of the water column. The water depth inversion results of the two aerosol models of the FLAASH have more obvious differences in turbid water, and the difference of MRE in shallow water of Liaodong Shoal is 7.9%; the ACOLITE model is significantly influenced by the water column type and has superiority and stability for turbid water, and the MRE is 5.6% lower than that of FLAASH. (3) The accuracy of multi-band water depth inversion is generally better than that of single-band, but there is no significant correlation between the accuracy of inversion and however, there is no significant correlation between the inversion accuracy and the number of bands; the combination of bathymetric inversion bands has different sensitivity to different study areas, the inversion accuracy of the three-band model is better in clean water, and the inversion accuracy of the four-band model is optimal in turbid water, and the MRE is reduced by 5.6% compared with the three-band model.
-
Key words:
- atmospheric correction /
- aerosol /
- water components /
- water depth inversion /
- band combination /
- accuracy analysis
-

图 1 清洁水体遥感影像与水深点分布
Fig. 1 Remote sensing image of clean water and distribution of water depth points
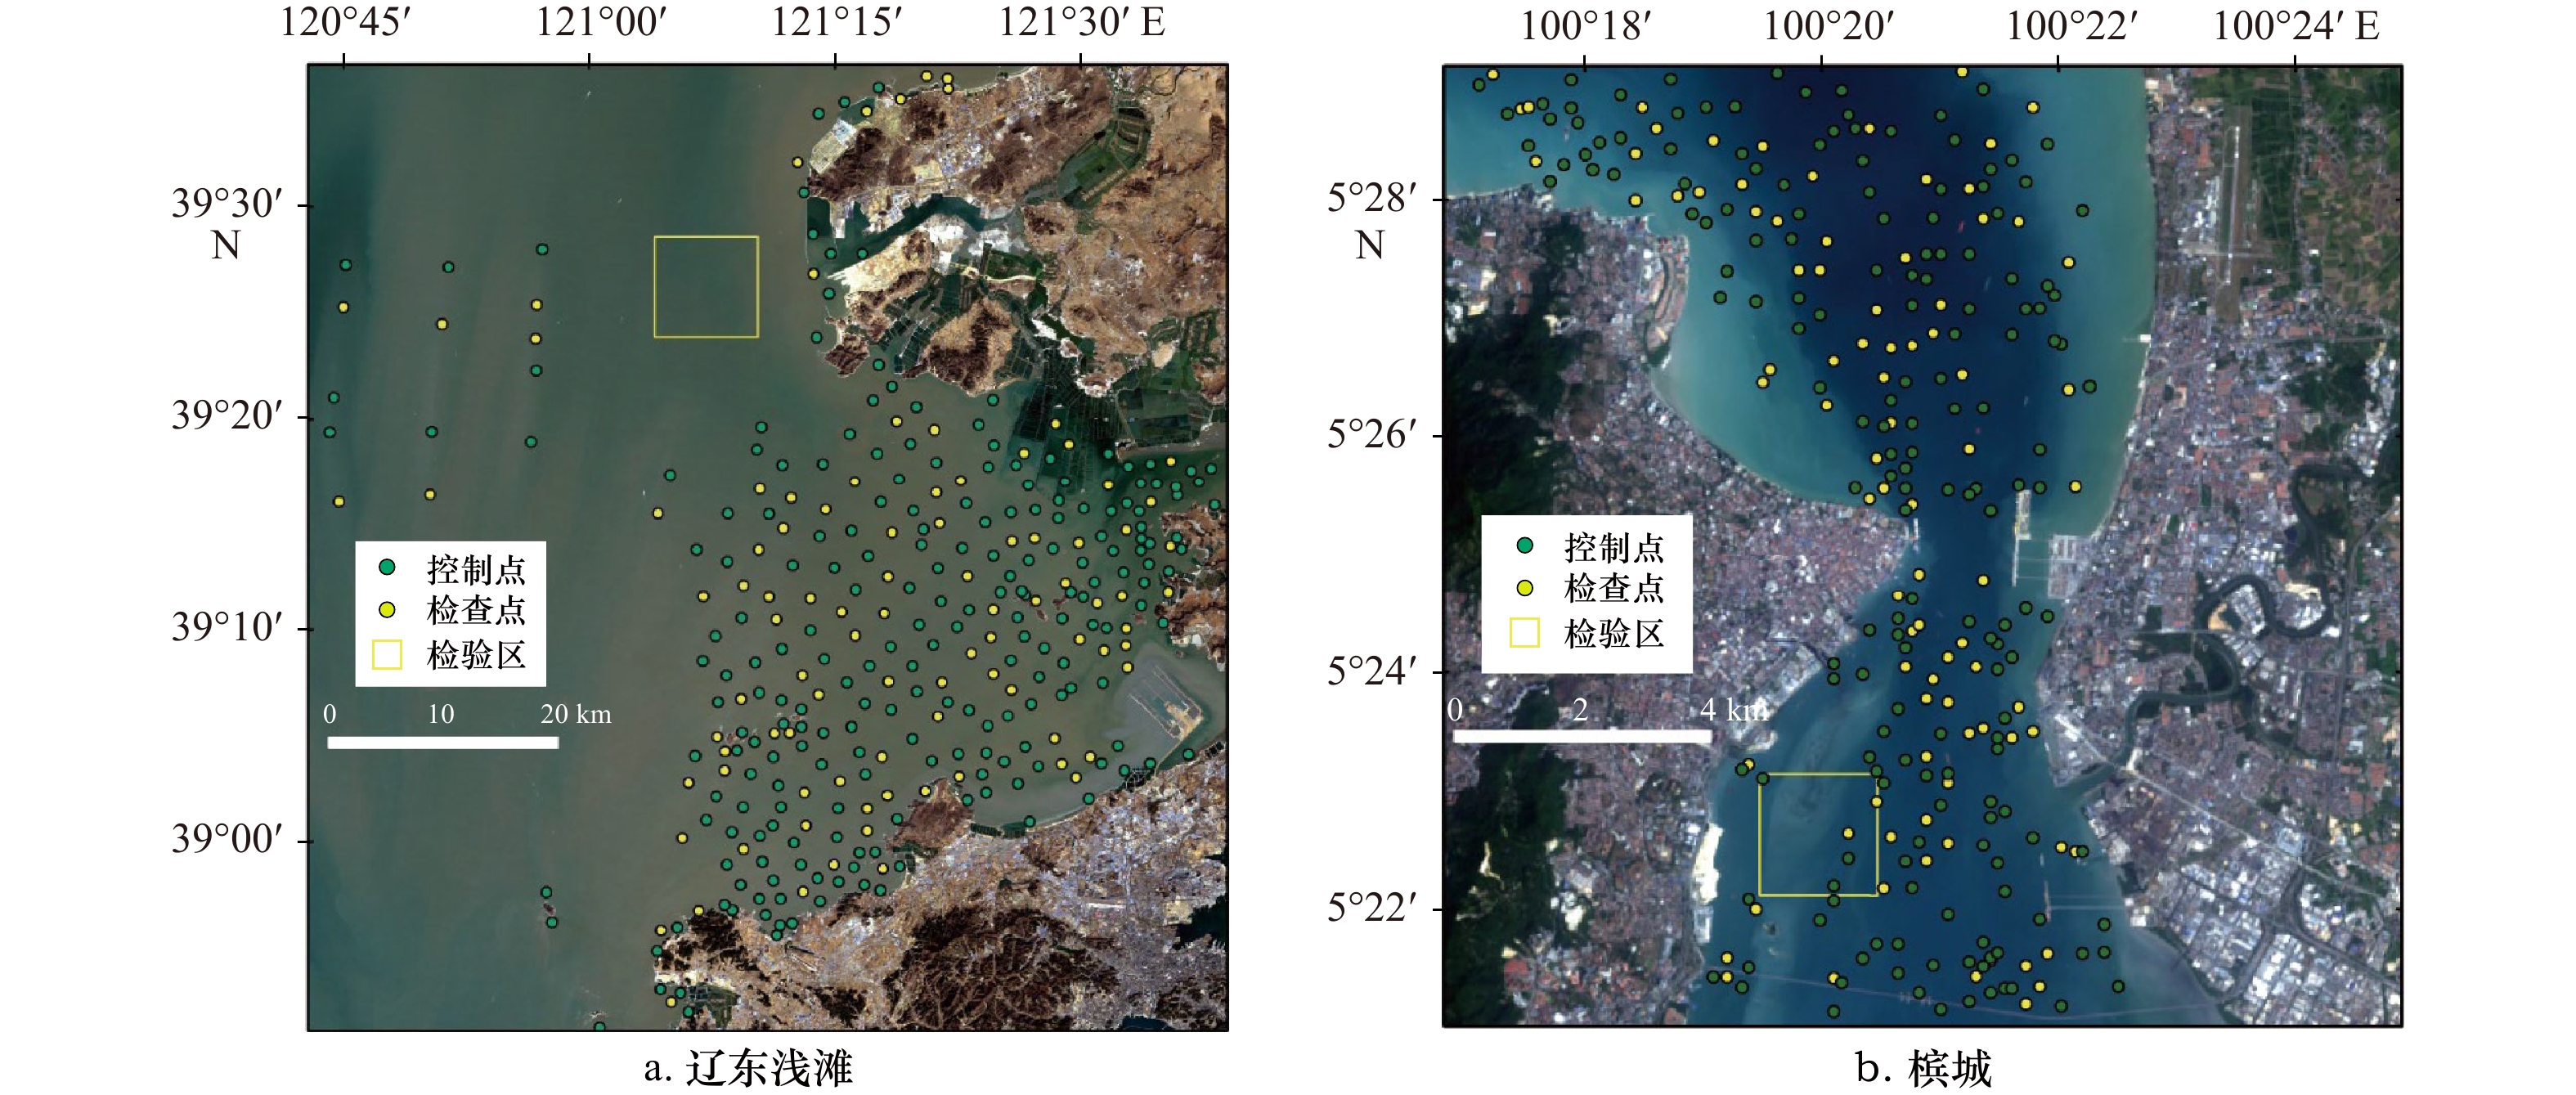
图 2 浑浊水体遥感影像与水深点分布
Fig. 2 Remote sensing image of turbid water and distribution of water depth points

图 5 瓦胡岛检验区蓝波段反射率分布
Fig. 5 Blue-band reflectance distribution in the Oahu Island test area

图 6 辽东浅滩检验区绿波段反射率分布
Fig. 6 Green-band reflectance distribution in the Liaodong Shoal test area

图 7 瓦胡岛不同波段组合模型水深反演结果精度分析
Fig. 7 Accuracy analysis of bathymetric inversion results of different band combination models of Oahu Island

图 8 辽东浅滩不同波段组合模型水深反演结果精度分析
Fig. 8 Accuracy analysis of bathymetric inversion results of different band combination models of Liaodonng Shoal
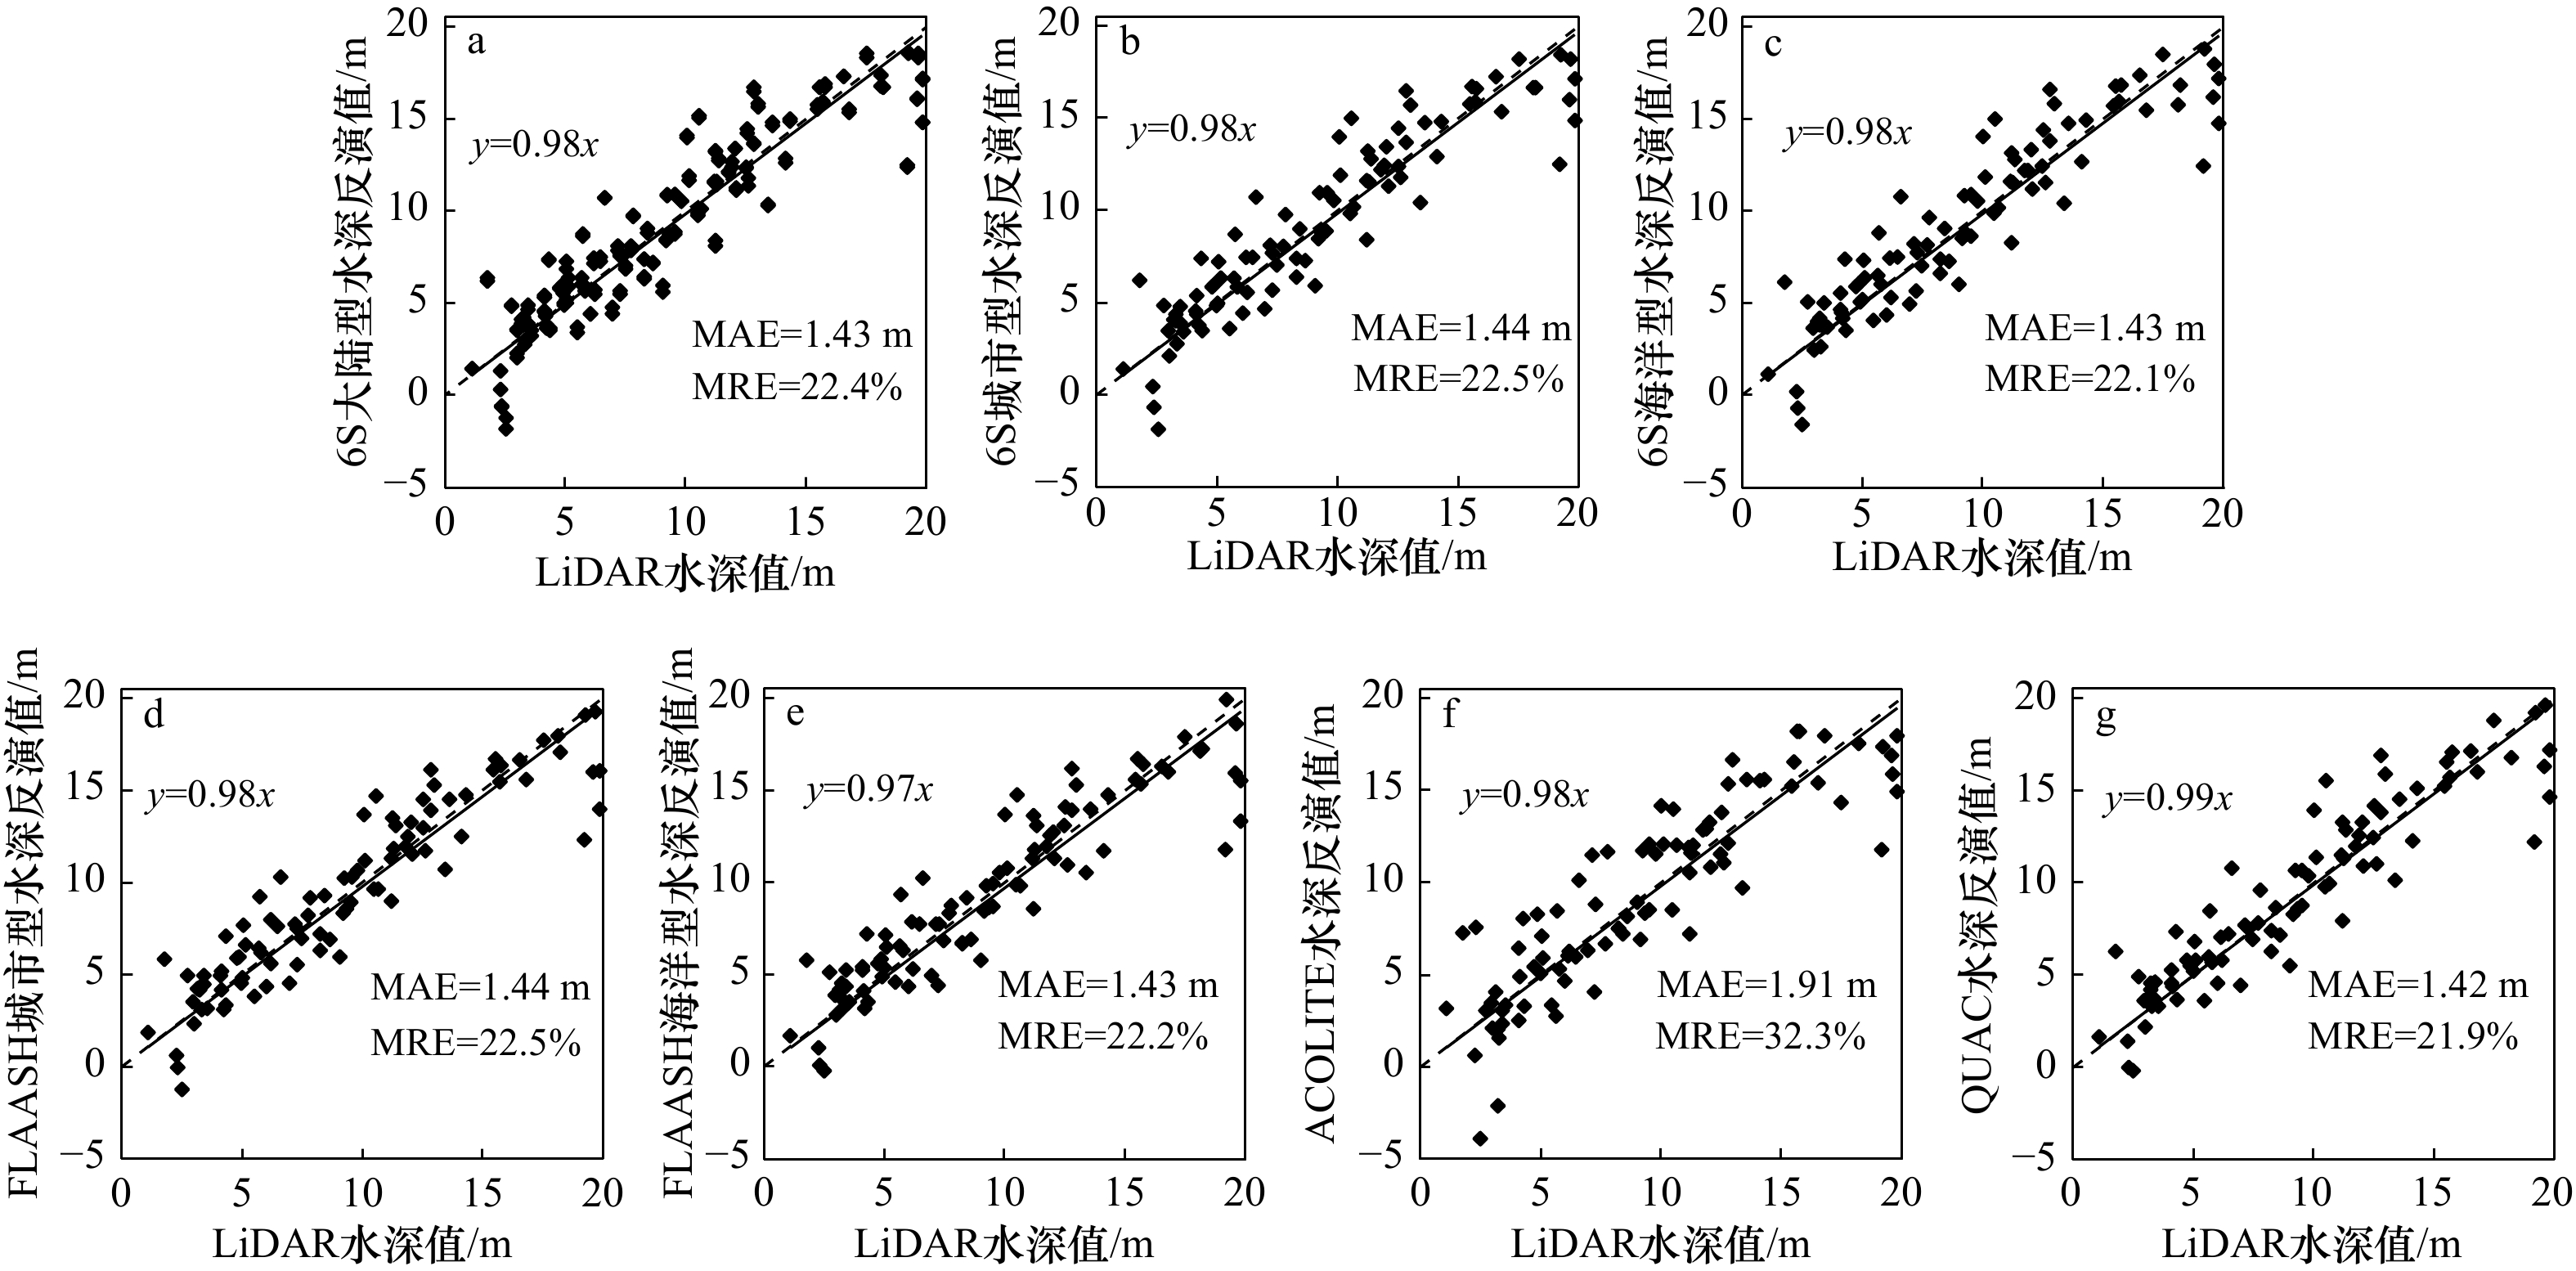
图 9 瓦胡岛研究区不同大气校正模型反演水深值与参考水深值散点图
Fig. 9 Scatter plots of bathymetry and reference bathymetry for different atmospheric correction models for Oahu Island

图 10 辽东浅滩研究区不同大气校正模型反演水深值与参考水深值散点图
Fig. 10 Scatter plots of bathymetry and reference bathymetry for different atmospheric correction models for Liaodong Shoal
表 1 清洁水体水深点数量分布
Tab. 1 Number distribution of water depth points in clean water
水深点 研究区 整体 0~5 m 5~10 m 10~15 m 15~20 m 控制点 瓦胡岛 183 48 51 47 37 谢米亚岛 202 44 54 51 53 检查点 瓦胡岛 89 22 29 24 14 谢米亚岛 93 18 23 29 23  下载: 导出CSV
表 2 浑浊水体水深点数量分布
Tab. 2 Number distribution of water depth points in turbid water
水深点 研究区 整体 0~5 m 5~10 m 10~15 m 15~20 m 控制点 辽东浅滩 217 50 74 56 37 槟城 178 50 56 52 20 检查点 辽东浅滩 95 18 31 27 19 槟城 88 19 27 24 18
下载: 导出CSV
表 3 气溶胶模式4种基本粒子体积比
Tab. 3 Volume ratio of four basic particles in aerosol model
类型 水溶性粒子 类尘埃 海洋性粒子 烟尘性粒子 大陆型 0.29 0.70 − 0.01 海洋型 0.05 − 0.95 − 城市型 0.61 0.17 − 0.22 注:− 代表没有该类型的物质。
下载: 导出CSV
表 4 大气校正参数
Tab. 4 Atmospheric correction parameters
研究区 大气模式 波长550 nm光学厚度 平均高程/km 瓦胡岛 热带 0.078 0.07 谢米亚岛 中纬度夏季 0.185 0.00 辽东浅滩 中纬度夏季 0.078 0.01 槟城 热带 0.238 0.05
下载: 导出CSV
表 5 清洁水体校正结果标准差(SD)与变异系数(CV)
Tab. 5 Standard deviation (SD) and coefficient of variation (CV) of atmospheric correction results for clean water
中心波长/nm 瓦胡岛研究区 谢米亚岛研究区 SD CV/10−3 SD CV/10−3 482.5 55.81 116.7 56.53 328.0 562.5 37.80 148.6 34.31 350.3 655 28.41 182.7 17.86 358.5 865 22.73 149.7 28.80 585.1
下载: 导出CSV
表 6 浑浊水体校正结果标准差(SD)与变异系数(CV)
Tab. 6 Standard deviation (SD) and coefficient of variation (CV) of atmospheric correction results for turbid water
中心波长/nm 辽东浅滩研究区 槟城研究区 SD CV/10−3 SD CV/10−3 482.5 74.96 116.7 147.35 159.7 562.5 99.19 114.7 122.16 126.0 655 60.56 78.9 64.91 114.3 865 18.72 128.3 59.80 242.0
下载: 导出CSV
表 7 不同波段组合模型
Tab. 7 Different band combination model
波段数目 组合方式 单波段 B G R 双波段 B+G B+R G+R 三波段 B+G+R 四波段 B+G+R+NIR
下载: 导出CSV
表 8 清洁水体不同波段组合模型水深反演结果精度
Tab. 8 The accuracy of water depth inversion results of different band combination models for clean water
研究区 模型 MAE平均值/m MRE平均值/% G B+G B+G+R B+G+R+NIR G B+G B+G+R B+G+R+NIR 瓦胡岛 6S大陆型 2.50 1.71 1.43 1.47 48.3 26.9 22.4 23.5 6S城市型 2.52 1.73 1.44 1.47 49.0 27.5 22.5 23.6 6S海洋型 2.46 1.65 1.43 1.49 47.2 25.7 22.1 23.3 FLAASH城市型 2.68 1.72 1.41 1.44 51.3 26.7 22.6 23.5 FLAASH海洋型 2.67 1.71 1.43 1.45 49.7 25.1 22.2 22.5 ACOLITE 2.28 2.08 1.91 1.91 41.7 33.8 32.3 33.2 QUAC 2.49 1.66 1.42 1.47 48.1 25.5 21.9 23.5 谢米亚岛 6S大陆型 2.43 2.43 2.47 2.43 50.8 32.4 28.6 28.9 6S城市型 3.59 2.72 2.49 2.47 50.4 33.4 28.7 29.4 6S海洋型 3.59 2.72 2.51 2.40 50.6 33.0 29.3 28.7 FLAASH城市型 3.92 2.92 2.56 2.54 58.4 34.8 29.3 30.4 FLAASH海洋型 4.10 3.14 2.42 2.42 62.8 38.8 27.7 28.1 ACOLITE 3.67 2.63 2.32 2.34 52.7 30.8 25.7 26.9 QUAC 3.79 2.70 2.34 2.36 55.9 32.9 27.9 30.4 注:本表中展示了精度较好的几种波段组合方式。
下载: 导出CSV
表 9 清洁水体不同波段组合模型水深反演结果均值与标准差
Tab. 9 Mean and standard deviation of bathymetric inversion results of different band combination models for clean water
研究区 指标 B G R B+G B+R G+R B+G+R B+G+R+NIR 瓦胡岛 MAE 平均值/m 3.74 2.51 3.67 1.75 3.75 2.34 1.50 1.53 标准差/m 0.11 0.14 0.12 0.15 0.11 0.07 0.18 0.17 MRE 平均值/% 68.2 47.9 60.4 27.3 59.3 44.4 23.7 24.7 标准差/% 3.8 3.0 3.2 3.0 3.8 0.8 3.8 3.8 谢米
亚岛MAE 平均值/m 4.14 3.59 3.91 2.75 4.08 3.60 2.44 2.42 标准差/m 0.69 0.50 0.62 0.21 0.67 0.49 0.08 0.06 MRE 平均值/% 70.5 54.5 59.7 33.7 64.3 54.8 28.2 29.0 标准差/% 2.1 4.4 2.9 2.3 4.5 3.4 1.2 1.2
下载: 导出CSV
表 10 浑浊水体不同波段组合模型水深反演结果精度
Tab. 10 The accuracy of water depth inversion results of different band combination models for turbid water
研究区 模型 MAE/m MRE/% B B+G B+G+R B+G+R+NIR B B+G B+G+R B+G+R+NIR 辽东浅滩 6S大陆型 3.83 3.42 3.27 2.81 50.9 43.4 41.4 35.2 6S城市型 3.83 3.44 3.30 2.82 50.9 43.7 41.8 35.2 6S海洋型 3.83 3.42 3.27 2.81 50.9 43.7 41.5 35.1 FLAASH城市型 3.81 3.47 3.41 3.04 49.1 42.1 41.8 37.6 FLAASH海洋型 3.81 3.45 3.38 3.20 49.2 41.7 41.5 39.7 ACOLITE 3.82 3.40 3.26 2.77 50.9 43.2 40.9 34.1 QUAC 3.81 3.48 3.40 2.94 49.3 43.1 42.8 35.9 槟城 6S大陆型 3.23 3.07 3.06 2.94 41.2 38.2 37.8 36.1 6S城市型 3.22 3.07 3.05 2.94 41.2 38.2 37.7 36.0 6S海洋型 3.23 3.06 3.05 2.94 41.2 38.1 37.6 35.9 FLAASH城市型 3.21 3.12 3.12 3.04 41.3 39.3 39.5 37.4 FLAASH海洋型 3.22 3.11 3.11 3.03 41.3 39.1 39.2 37.2 ACOLITE 3.23 3.06 3.04 2.94 41.2 38.2 37.7 36.0 QUAC 3.25 3.09 3.10 2.92 42.0 39.2 39.4 36.2 注:本表只展示了精度较好的几种波段组合方式。
下载: 导出CSV
表 11 浑浊水体不同波段组合模型水深反演结果均值与标准差
Tab. 11 Mean and standard deviation of bathymetric inversion results of different band combination models for turbid water
研究区 指标 B G R B+G B+R G+R B+G+R B+G+R+NIR 辽东浅滩 MAE 平均值/m 3.82 3.97 3.91 3.44 3.79 3.89 3.33 2.91 标准差/m 0.01 0.01 0.01 0.03 0.01 0.00 0.07 0.16 MRE 平均值/% 50.2 53.3 52.2 43.0 49.6 51.8 41.7 36.1 标准差/% 0.9 0.7 0.7 0.8 0.8 0.4 0.6 1.9 槟城 MAE 平均值/m 3.27 3.23 3.58 3.24 3.23 3.08 3.08 2.96 标准差/m 0.01 0.01 0.03 0.01 0.00 0.02 0.03 0.04 MRE 平均值/% 43.8 41.3 50.7 42.1 43.3 38.6 38.4 36.4 标准差/% 0.2 0.3 0.4 0.3 0.3 0.5 0.8 0.6
下载: 导出CSV
表 12 清洁水体分段水深精度评价
Tab. 12 Accuracy evaluation of segmented depth of clean water
研究区 水深段/m 指标 6S大陆型 6S城市型 6S海洋型 FLAASH城市型 FLAASH海洋型 ACOLITE QUAC 瓦胡岛 0~5 MAE/m 1.16 1.17 1.15 1.18 1.20 1.93 1.20 MRE/% 44.6 44.7 44.0 45.2 45.0 74.3 44.7 5~10 MAE/m 1.13 1.15 1.13 1.15 1.11 1.65 1.20 MRE/% 16.2 16.4 16.1 16.8 16.2 23.3 17.0 10~15 MAE/m 1.51 1.52 1.53 1.42 1.41 1.82 1.67 MRE/% 13.0 13.0 13.1 12.1 12.0 15.4 14.2 15~20 MAE/m 1.83 1.84 1.81 1.71 1.85 2.53 1.77 MRE/% 9.8 9.9 9.7 9.1 10.0 13.9 9.5 谢米
亚岛0~5 MAE/m 2.14 2.21 2.19 2.28 1.91 1.74 1.72 MRE/% 62.2 63.1 65.1 64.7 62.1 49.9 59.8 5~10 MAE/m 1.71 1.69 1.69 1.64 1.39 1.67 1.61 MRE/% 24.0 23.9 23.9 22.7 19.0 23.3 22.9 10~15 MAE/m 1.91 1.86 1.94 2.00 1.93 1.91 1.90 MRE/% 14.7 14.2 14.9 15.3 14.8 14.8 14.8 15~20 MAE/m 4.19 4.29 4.28 4.43 4.46 3.94 4.10 MRE/% 24.3 24.9 24.9 25.7 25.8 22.9 24.4
下载: 导出CSV
表 13 浑浊水体分段水深精度
Tab. 13 Accuracy of segmented depth of turbid water
研究区 水深段/m 指标 6S大陆型 6S城市型 6S海洋型 FLAASH城市型 FLAASH海洋型 ACOLITE QUAC 辽东
浅滩0~5 MAE/m 3.09 3.07 3.16 3.23 3.43 2.98 3.37 MRE/% 86.4 85.8 88.5 91.1 99.0 82.5 89.1 5~10 MAE/m 2.04 2.03 2.13 2.07 2.10 1.93 1.88 MRE/% 27.3 27.3 28.6 27.6 28.6 25.7 25.2 10~15 MAE/m 1.80 1.78 1.69 1.94 2.04 1.87 2.02 MRE/% 13.5 13.4 12.7 14.6 15.4 14.1 15.3 15~20 MAE/m 5.29 5.32 5.20 5.35 5.72 5.22 5.56 MRE/% 30.6 30.7 30.0 30.8 32.7 30.1 32.0 槟城 0~5 MAE/m 1.76 1.75 1.76 1.72 1.73 1.75 1.80 MRE/% 65.1 64.3 64.6 66.3 66.3 64.5 65.7 5~10 MAE/m 2.04 2.05 2.05 2.20 2.15 2.05 2.12 MRE/% 30.7 30.9 30.8 32.9 32.1 30.9 32.1 10~15 MAE/m 2.26 2.25 2.25 2.39 2.40 2.25 2.13 MRE/% 18.4 18.3 18.4 19.6 19.7 18.3 17.3 15~20 MAE/m 6.47 6.45 6.45 6.54 6.56 6.44 6.37 MRE/% 37.2 37.1 37.1 37.6 37.7 37.0 36.6
下载: 导出CSV
-
[1] 王艳姣, 董文杰, 张培群, 等. 水深可见光遥感方法研究进展[J]. 海洋通报, 2007, 26(5): 92−101. doi: 10.3969/j.issn.1001-6392.2007.05.015Wang Yanjiao, Dong Wenjie, Zhang Peiqun, et al. Progress in water depth mapping from visible remote sensing data[J]. Marine Science Bulletin, 2007, 26(5): 92−101. doi: 10.3969/j.issn.1001-6392.2007.05.015 [2] Renosh P R, Doxaran D, De Keukelaere L, et al. Evaluation of atmospheric correction algorithms for sentinel-2-MSI and sentinel-3-OLCI in highly turbid estuarine waters[J]. Remote Sensing, 2020, 12(8): 1285. doi: 10.3390/rs12081285 [3] Gordon H R. Removal of atmospheric effects from satellite imagery of the oceans[J]. Applied Optics, 1978, 17(10): 1631−1636. doi: 10.1364/AO.17.001631 [4] Gordon H R, Clark D K. Atmospheric effects in the remote sensing of phytoplankton pigments[J]. Boundary-Layer Meteorology, 1980, 18(3): 299−313. doi: 10.1007/BF00122026 [5] Ruddick K G, Ovidio F, Rijkeboer M. Atmospheric correction of SeaWiFS imagery for turbid coastal and inland waters[J]. Applied Optics, 2000, 39(6): 897−912. doi: 10.1364/AO.39.000897 [6] 孔金玲, 杨晶, 孙晓明, 等. 多光谱遥感影像大气校正与悬沙浓度反演——以曹妃甸近岸海域为例[J]. 国土资源遥感, 2016, 28(3): 130−137.Kong Jinling, Yang Jing, Sun Xiaoming, et al. Atmospheric correction and suspended sediment concentration retrieval based on multi-spectral remote sensing images: a case study of Caofeidian offshore area[J]. Remote Sensing for Land & Resources, 2016, 28(3): 130−137. [7] 郑伟, 曾志远. 遥感图像大气校正方法综述[J]. 遥感信息, 2004(4): 66−70. doi: 10.3969/j.issn.1000-3177.2004.04.019Zheng Wei, Zeng Zhiyuan. A review on methods of atmospheric correction for remote sensing images[J]. Remote Sensing Information, 2004(4): 66−70. doi: 10.3969/j.issn.1000-3177.2004.04.019 [8] Wang Hanghang, Wang Jie, Cui Yuhuan, et al. Consistency of suspended particulate matter concentration in turbid water retrieved from sentinel-2 MSI and landsat-8 OLI sensors[J]. Sensors, 2021, 21(5): 1662. doi: 10.3390/s21051662 [9] 马毅, 张杰, 张靖宇, 等. 浅海水深光学遥感研究进展[J]. 海洋科学进展, 2018, 36(3): 331−351. doi: 10.3969/j.issn.1671-6647.2018.03.001Ma Yi, Zhang Jie, Zhang Jingyu, et al. Progress in shallow water depth mapping from optical remote sensing[J]. Advances in Marine Science, 2018, 36(3): 331−351. doi: 10.3969/j.issn.1671-6647.2018.03.001 [10] Lyzenga D R. Passive remote sensing techniques for mapping water depth and bottom features[J]. Applied Optics, 1978, 17(3): 379−383. doi: 10.1364/AO.17.000379 [11] 杨晓彤, 焦红波, 李艳雯, 等. 两种浅海水深快速反演方法对比研究[J]. 测绘科学, 2017, 42(11): 177−183.Yang Xiaotong, Jiao Hongbo, Li Yanwen, et al. Comparative research of two methods for fast waterdepthretrieval for shallow water[J]. Science of Surveying and Mapping, 2017, 42(11): 177−183. [12] 张鹰, 张东, 王艳姣, 等. 含沙水体水深遥感方法的研究[J]. 海洋学报, 2008, 30(1): 51−58.Zhang Ying, Zhang Dong, Wang Yanjiao, et al. Study of remote sensing-based bathymetric method in sand-containing water bodies[J]. Haiyang Xuebao, 2008, 30(1): 51−58. [13] 许海蓬, 张彦彦, 王磊, 等. 大气校正对水深遥感反演的影响分析[J]. 现代测绘, 2017, 40(3): 1−4, 9. doi: 10.3969/j.issn.1672-4097.2017.03.001Xu Haipeng, Zhang Yanyan, Wang Lei, et al. Influence analysis of atmospheric correction on bathymetry remote sensing inversion[J]. Modern Surveying and Mapping, 2017, 40(3): 1−4, 9. doi: 10.3969/j.issn.1672-4097.2017.03.001 [14] 张彦彦, 许海蓬, 吴涛, 等. 不同波段数目及组合对水深反演的影响[J]. 江苏海洋大学学报(自然科学版), 2020, 29(2): 45−49.Zhang Yanyan, Xu Haipeng, Wu Tao, et al. The influence of different band number and combination on bathymetric inversion[J]. Journal of Jiangsu Ocean University (Natural Sciences Edition), 2020, 29(2): 45−49. [15] Penny P, Kathryn S, Holly B. United States Coast Pilot[M]. United States: National Oceanic and Atmospheric Administration, 2014, 32: 385−386. [16] 田震, 马毅, 张靖宇, 等. 基于Landsat-8遥感影像和LiDAR测深数据的水深主被动遥感反演研究[J]. 海洋技术学报, 2015, 34(2): 1−8.Tian Zhen, Ma Yi, Zhang Jingyu, et al. Study on the bathymetry inversion by active and passive remote sensing with Landsat-8 images and LIDAR data[J]. Journal of Ocean Technology, 2015, 34(2): 1−8. [17] 金玉休, 曹志敏, 吴建政, 等. 辽东浅滩潮流运动特征与沉积物输运[J]. 海洋地质与第四纪地质, 2015, 35(6): 33−40.Jin Yuxiu, Cao Zhimin, Wu Jianzheng, et al. Tidal current movement and its bearing on sediment transportation on Liaodong shoal[J]. Marine Geology & Quaternary Geology, 2015, 35(6): 33−40. [18] Vanhellemont Q, Ruddick K. Turbid wakes associated with offshore wind turbines observed with Landsat 8[J]. Remote Sensing of Environment, 2014, 145: 105−115. doi: 10.1016/j.rse.2014.01.009 [19] Martins V S, Barbosa C C F, De Carvalho L A S, et al. Assessment of atmospheric correction methods for sentinel-2 MSI images applied to amazon floodplain lakes[J]. Remote Sensing, 2017, 9(4): 322. doi: 10.3390/rs9040322 [20] Shen Junjie, Jiang Jie, Du Yixi, et al. Impact of aerosol type on atmospheric correction of case II waters[J]. IOP Conference Series: Earth and Environmental Science, 2019, 234(1): 012019. [21] Vermote E F, Tanre D, Deuze J L, et al. Second simulation of the satellite signal in the solar spectrum, 6S: an overview[J]. IEEE Transactions on Geoscience and Remote Sensing, 1997, 35(3): 675−686. doi: 10.1109/36.581987 [22] 丁凡. 太湖OLI影像大气校正方法对比与适用性评价[D]. 西安: 西安科技大学, 2018.Ding Fan. Comparison and applicability assessment of atmospheric correction methods of OLI images in Taihu Lake[D]. Xi’an: Xi’an University of Science and Technology, 2018. [23] Cooley T, Anderson G P, Felde G W, et al. FLAASH, a MODTRAN4-based atmospheric correction algorithm, its application and validation[C]//IEEE International Geoscience and Remote Sensing Symposium. New York: IEEE, 2002: 1414−1418. [24] Rothman L S, Rinsland C P, Goldman A, et al. The HITRAN molecular spectroscopic database and HAWKS (HITRAN Atmospheric Workstation): 1996 edition[J]. Journal of Quantitative Spectroscopy and Radiative Transfer, 1998, 60(5): 665−710. doi: 10.1016/S0022-4073(98)00078-8 [25] Vanhellemont Q, Ruddick K. Advantages of high quality SWIR bands for ocean colour processing: Examples from Landsat-8[J]. Remote Sensing of Environment, 2015, 161: 89−106. doi: 10.1016/j.rse.2015.02.007 [26] Dörnhöfer K, Göritz A, Gege P, et al. Water constituents and water depth retrieval from sentinel-2A-A first evaluation in an oligotrophic lake[J]. Remote Sensing, 2016, 8(11): 941. doi: 10.3390/rs8110941 [27] Bernstein L S, Adler-Golden S M, Sundberg R L, et al. Validation of the Quick Atmospheric Correction (QUAC) algorithm for VNIR-SWIR multi- and hyperspectral imagery[C]//Proceedings of SPIE 5806, Algorithms and Technologies for Multispectral, Hyperspectral, and Ultraspectral Imagery XI. Orlando: SPIE, 2005: 668−678. [28] Lyzenga D R, Malinas N R, Tanis F J. Multispectral bathymetry using a simple physically based algorithm[J]. IEEE Transactions on Geoscience and Remote Sensing, 2006, 44(8): 2251−2259. doi: 10.1109/TGRS.2006.872909 -


计量
- 文章访问数: 710
- HTML全文浏览量: 266
- PDF下载量: 60
- 被引次数: 0
