

Mechanism analysis of alongshore shock current phenomenon in Yangjiang sea area along the coast of western Guangdong in spring and summer
-
摘要: 通过分析2018–2019年粤西阳江沿岸流海域多站点周年观测水文气象实测资料,发现2019年春季和夏季阳江沿岸流海域存在激流现象。研究结果表明:(1)2019年5月5日凌晨6时,观测站点2 m水深处流速达到164.7 cm/s,9 m水深处流速达到127.6 cm/s。2019年8月1日凌晨4时至5时,阳江沙扒海域2 m水深处流速达到161.8 cm/s,9 m水深处流速达到156.6 cm/s。(2)粤西沿岸流阳江20~30 m水深海域春夏季突发性强流具有典型的激流特征。激流在涨急时刻发生在海洋表层,持续2~4 h。(3)在西南风与东北风转换期间,粤西沿岸海域容易形成海水幅聚带,近岸海域海平面上升,外海海域海平面下降,强劲的自岸向外水平压强梯度力导致近岸海水加强向西运动,从而产生激流。Abstract: We can discover that there exist storm currents along Yangjiang sea area of western Guangdong waters in spring and summer of 2019 by analyzing materials which measure hydrologic and hydrometeorological along west coast of Guangdong flow Yangjiang sea area from 2018 to 2019. The result of research shows: Firstly, the velocity of 2 m water depth at the observation site reached 164.7 cm/s and 9 m water depth at the observation site reached 127.6 cm/s at 6:00 a.m. on May 5, 2019. The velocity of Yangjiang Shapa sea area 2 m water depth at the observation site reached 161.8 cm/s and 9 m water depth at the observation site reached 156.6 cm/s at 4:00 to 5:00 a.m. on August 1, 2019. Secondly, the suddenly strong currents in spring and summer have typically shock current trait in the Yangjiang 20 m to 30 m sea area along the shore current area of western Guangdong. The strong current happens at the surface of the ocean during the time of rising tide for 2 h to 4 h. Thirdly, during the transition period of southwest wind and northeast wind, the coastal sea area of western Guangdong is prone to form a water convergence zone. The sea level of the coastal sea area rises, and the sea level of the offshore sea area drops. The strong horizontal pressure gradient force from the shore to the outside causes the coastal water to strengthen the westward movement, resulting in shock current.
-
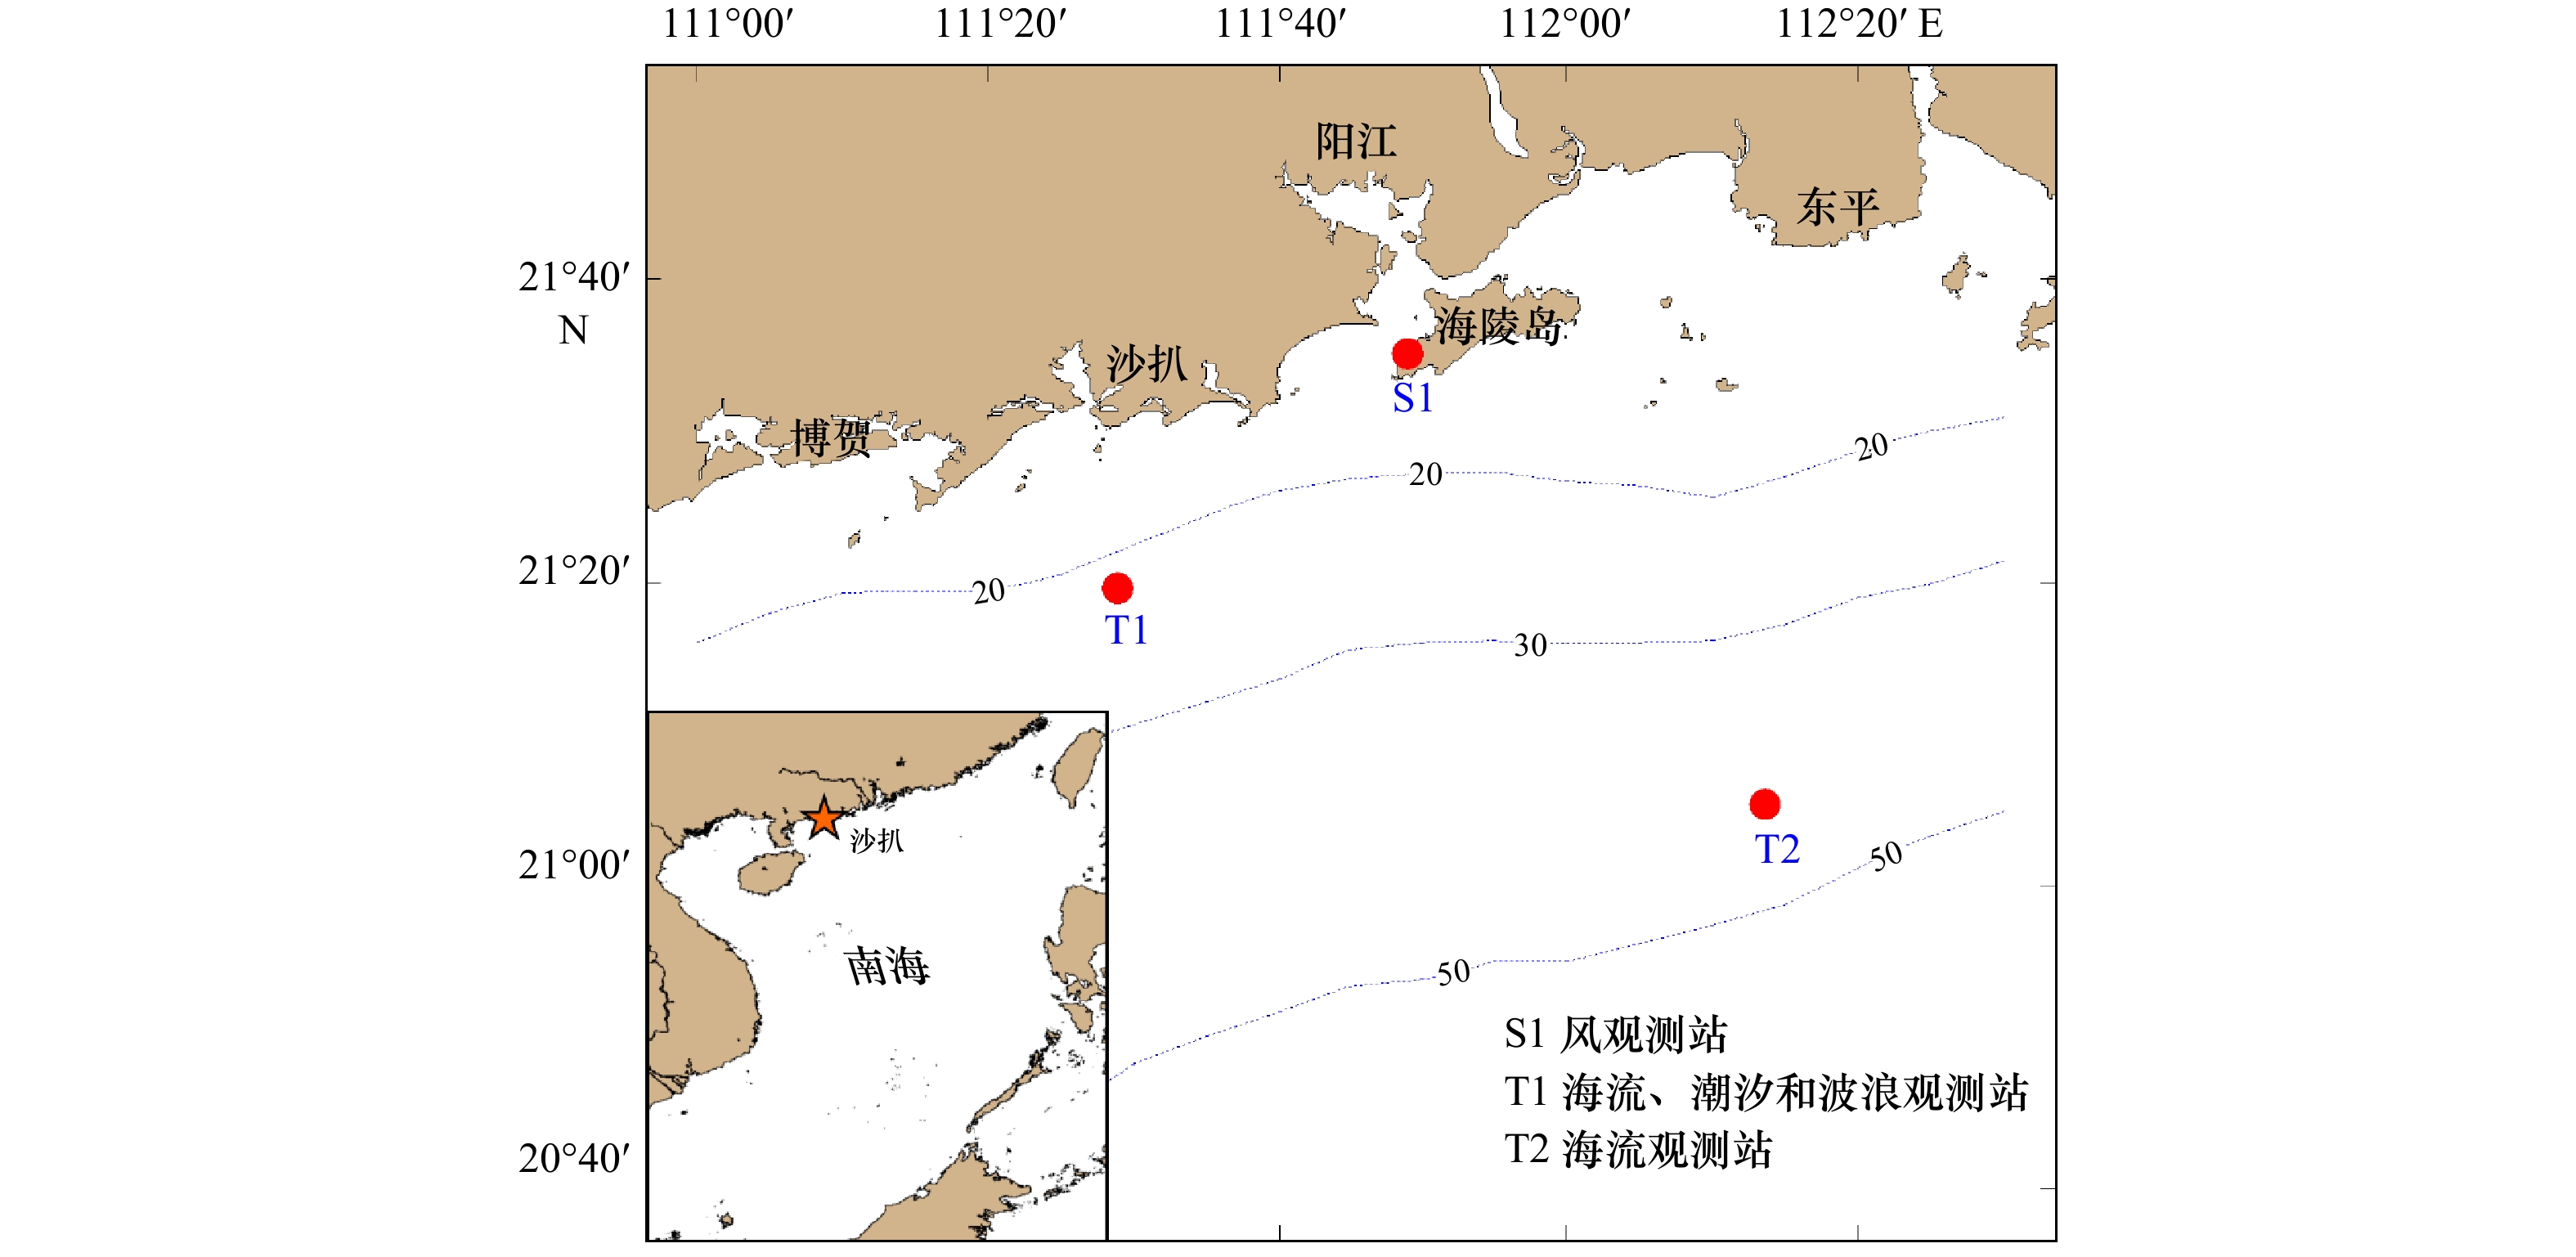
图 1 阳江海域长周期观测站位置
图中S1站为风观测站,观测时间为2018年10月至2020年2月;T1站为海流、潮汐和波浪观测站,观测时间为2018年10月至2019年9月;T2站为海流观测站,观测时间为2019年3月至2020年2月;图中虚线为水深(单位:m)
Fig. 1 Location map of long-term observation stations in Yangjiang sea area
S1 Station is a wind observation station, and the observation time is from October 2018 to February 2020; T1 Station is a current, tide and wave observation station, and the observation time is from October 2018 to September 2019; T2 Station is a current observation station, and the observation time is from March 2019 to February 2020. The dotted line in the figure is the water depth (unit: m)
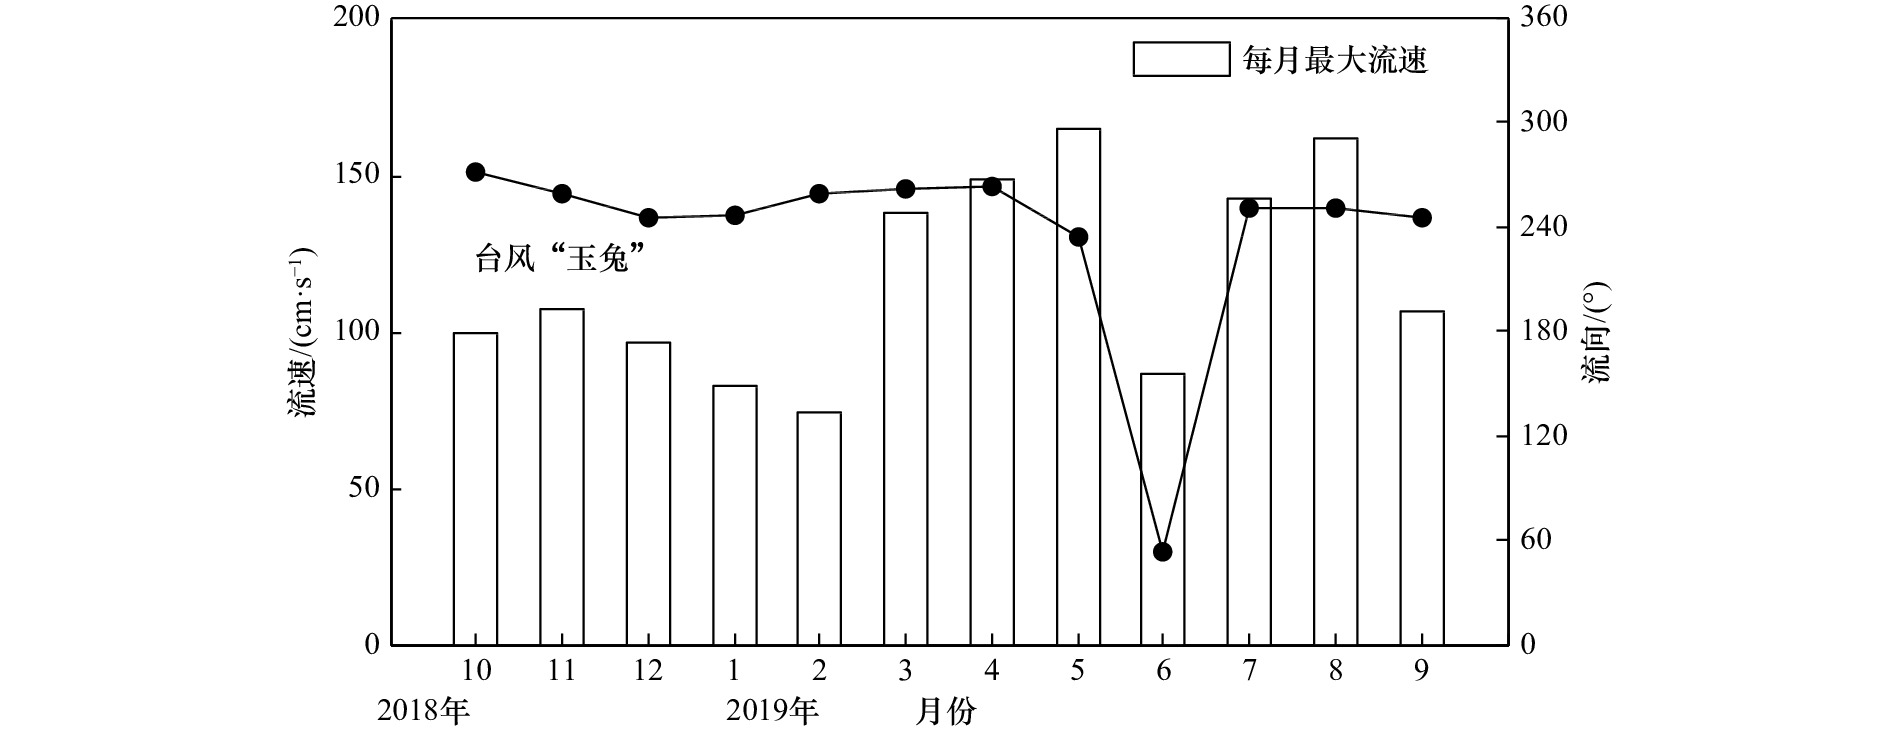
图 2 T1站2018年10月至2019年9月观测期间每月最大流速
Fig. 2 Maximum monthly current velocity of T1 Station during observation period from October 2018 to September 2019
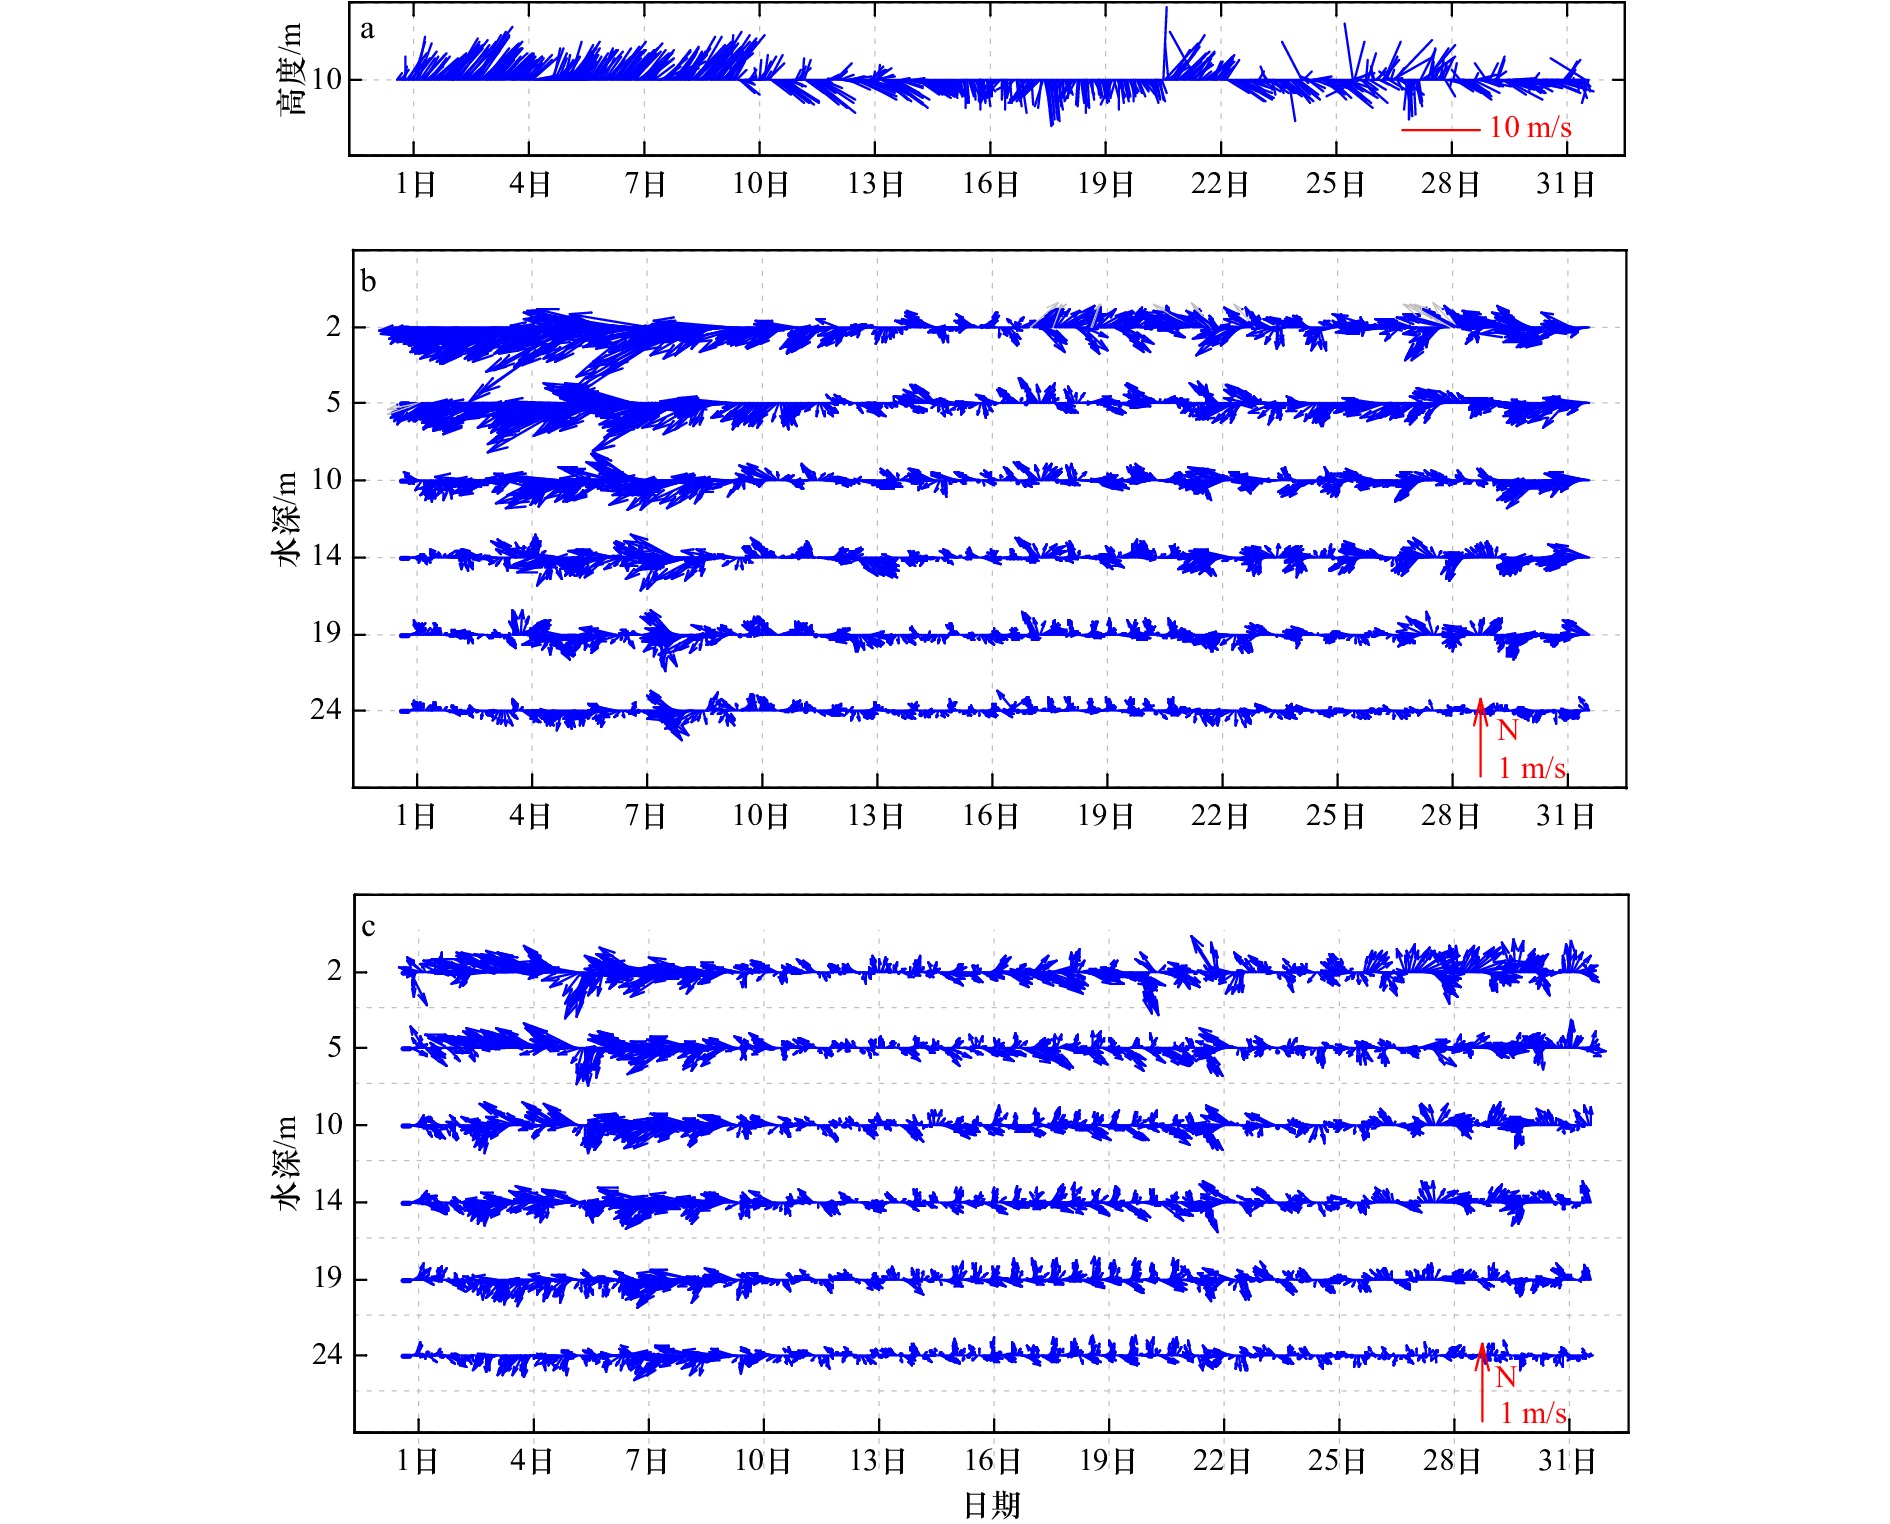
图 3 2019年5月S1站风矢量图(a)和T1站(b)、T2站(c)不同水深海流矢量变化过程
Fig. 3 Wind vector diagram of Station S1 (a) and current vector change process of different water depth at Station T1 (b) and Station T2 (c) in May, 2019
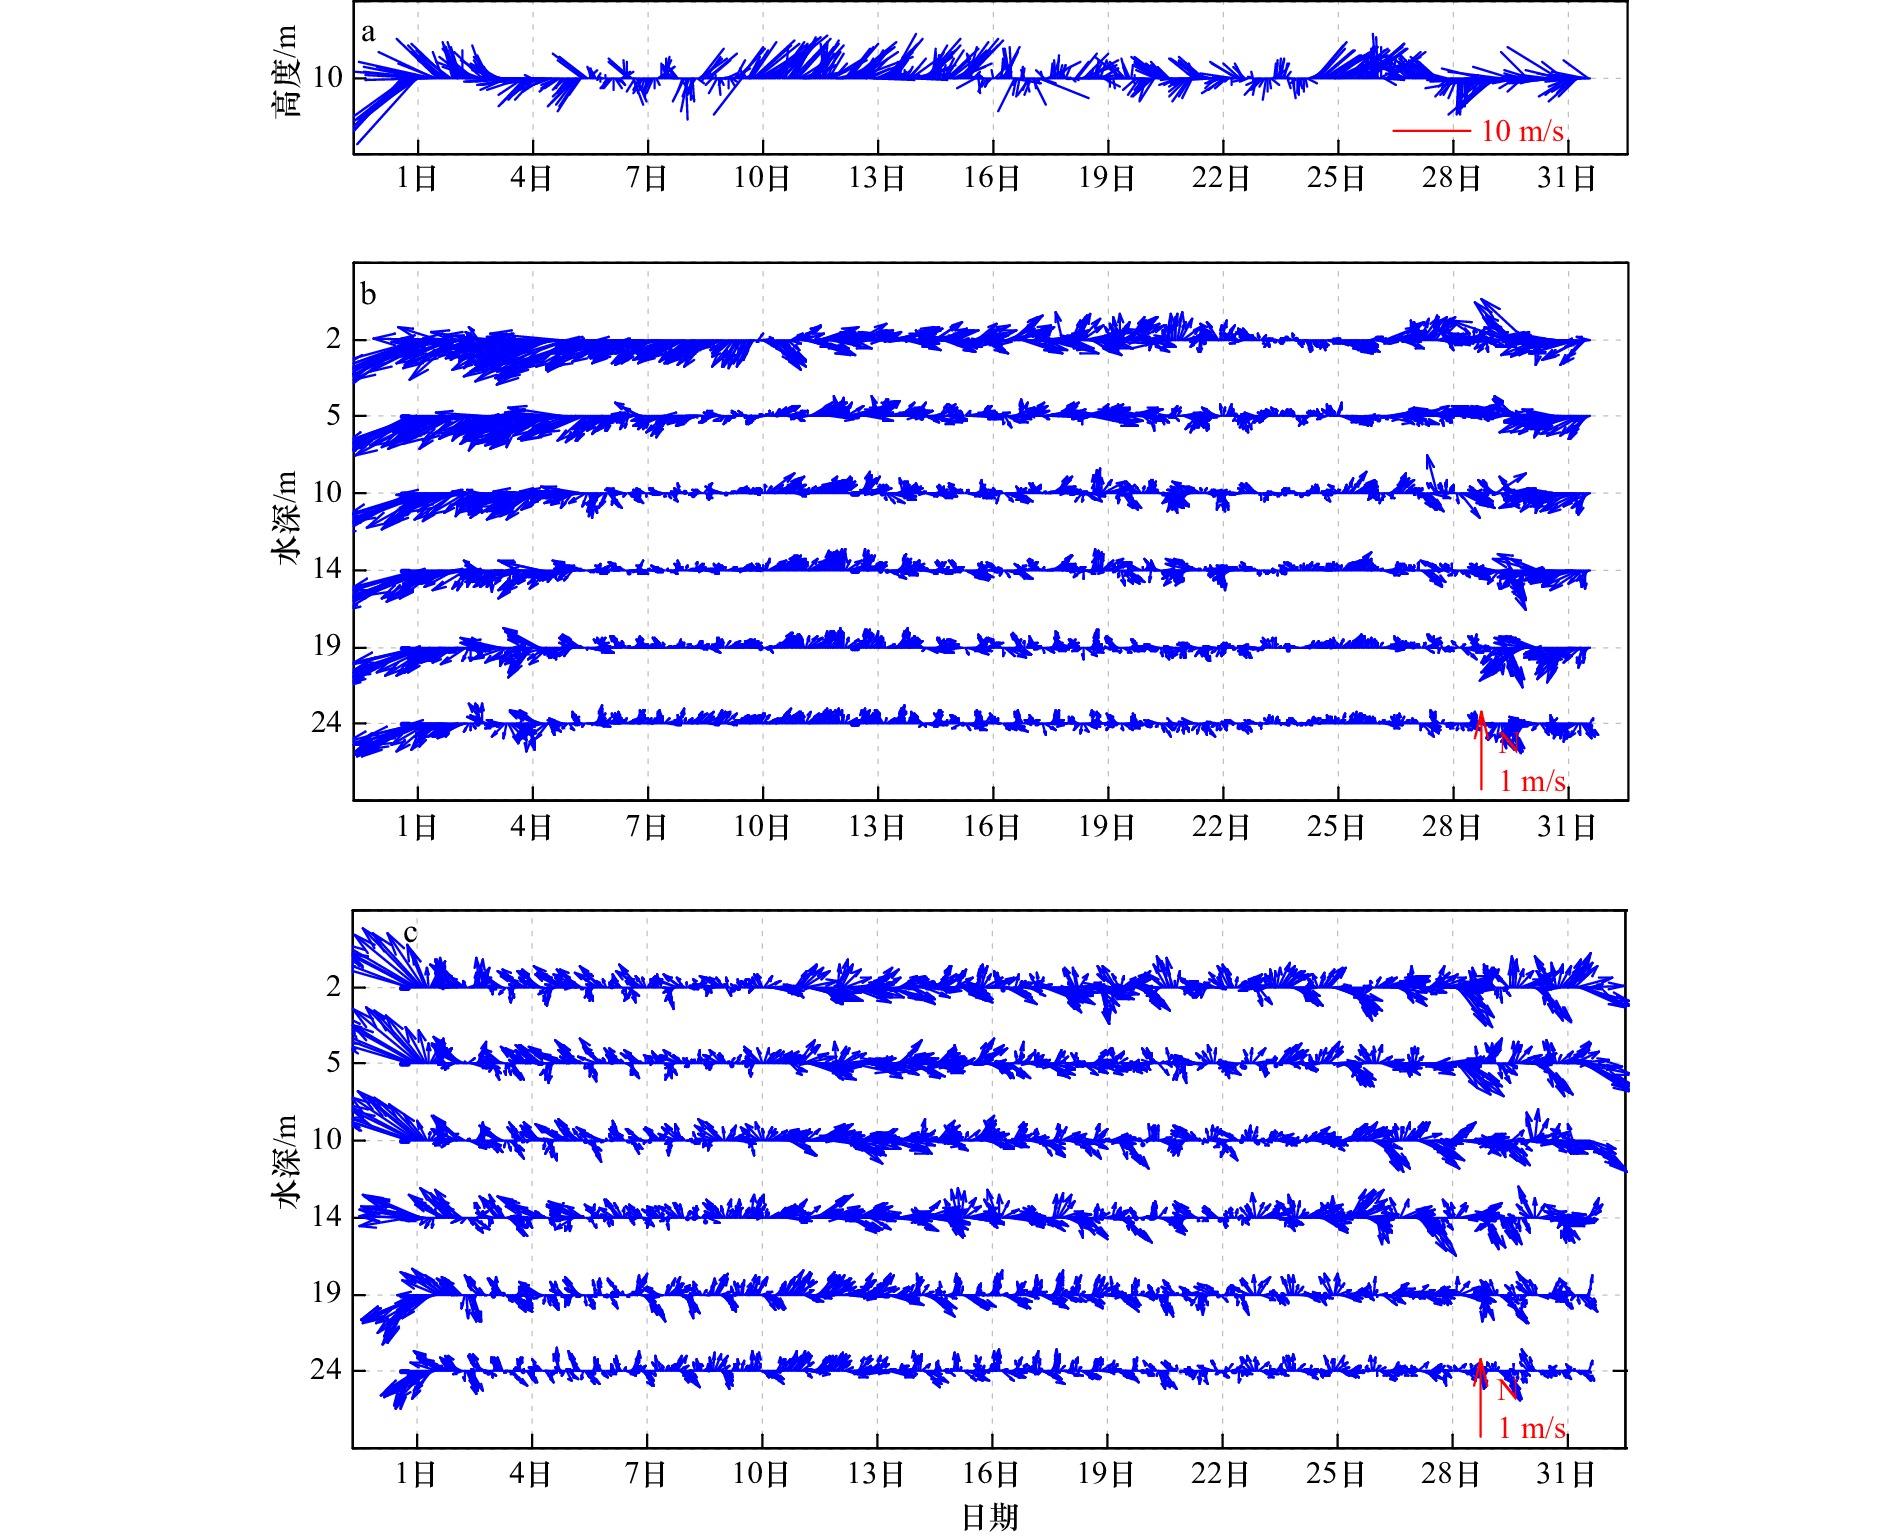
图 4 2019年8月S1站(a)风矢量和T1站(b)、T2站(c)不同水深海流矢量变化过程
Fig. 4 Variation process of wind vector at Station S1 (a) and current vector at different water depths at Station T1 (b) and Station T2 (c) in August 2019

图 5 T1站 2019年5月4日17:00至5月5日18:00海流矢量图
Fig. 5 Current vector diagram of T1 Station from 17:00 on May 4 to 18:00 on May 5, 2019

图 6 T1站 2019年7月31日17:00至8月1日18:00海流矢量图
Fig. 6 Current vector diagram of T1 Station from 17:00 on July 31 to 18:00 on August 1, 2019
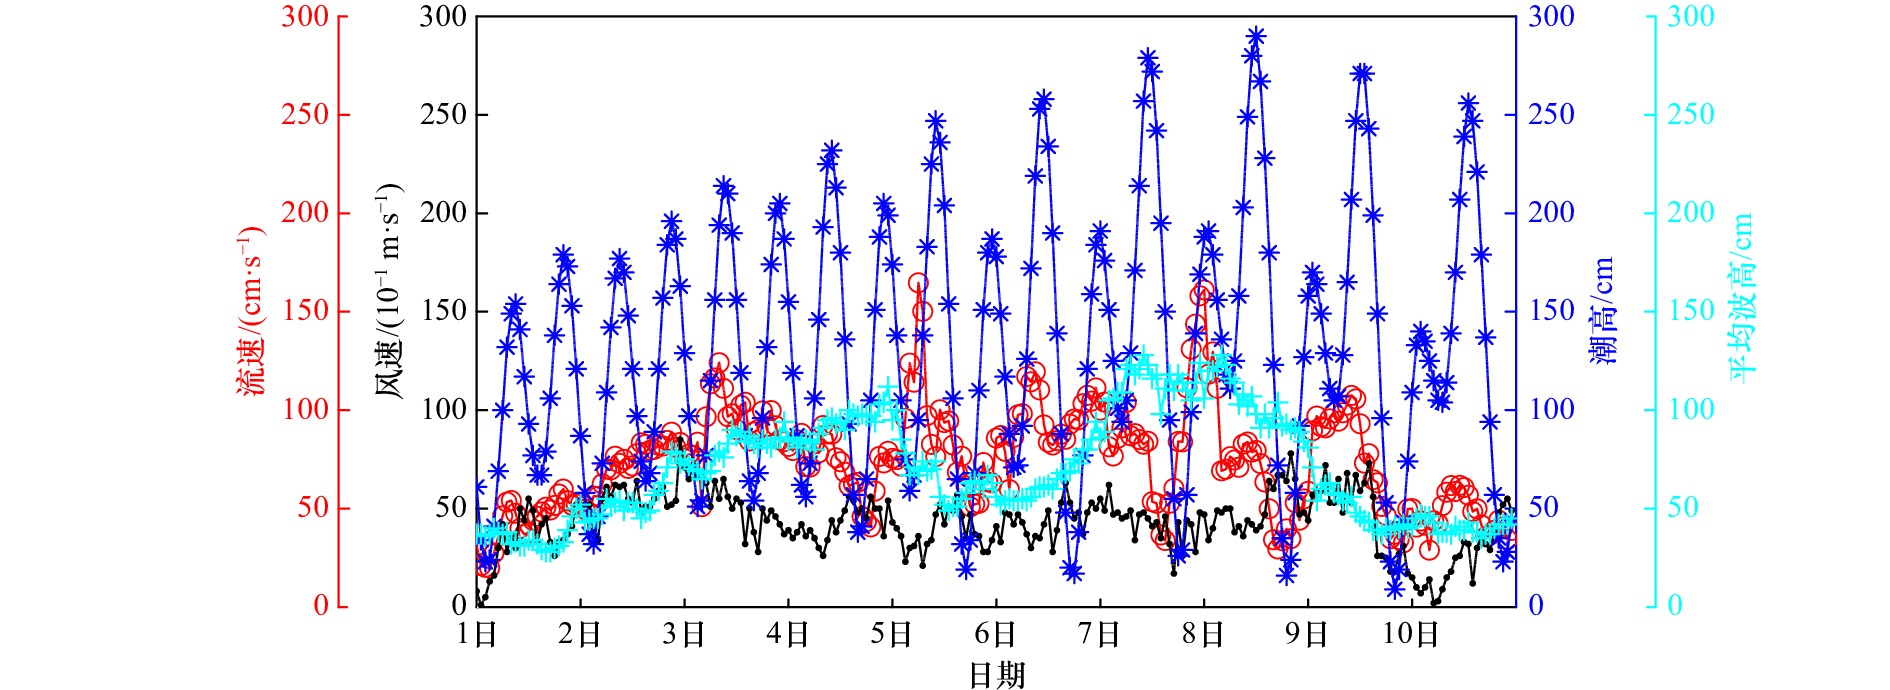
图 7 2019年5月1日至10日激流期间S1站风速和T1站流速、潮高、平均波高变化过程
Fig. 7 Variation process of wind speed at Station S1 and flow velocity, tide height and average wave height at Station T1 during shock current period from May 1 to 10, 2019

图 8 2019年8月1日至10日激流期间S1站风速和T1站流速、潮高、平均波高变化过程
Fig. 8 Variation process of wind speed at Station S1 and flow velocity, tide height and average wave height at Station T1 during shock current period from August 1 to 10, 2019

图 9 2019年春季南海北部海表面温度和T1、T2站余流分布
左图为GHRSST遥感海表面温度,右图为左图同日T1、T2站表层余流和底层余流(右图区域为左图红框内区域)
Fig. 9 Distribution of sea surface temperature and residual current at stations T1 and T2 in the northern South China Sea in the spring of 2019
The left figures show the GHRSST remote sensing sea surface temperature, and the right figures show the surface residual current and bottom residual current at stations T1 and T2 on the same day (the area in the right figure is the area in the red box in the left figure)

图 10 2019年春季南海北部激流期间AVISO表面高度异常和海表地转流
Fig. 10 AVISO surface level anomaly and surface geostrophic current during the torrent in the northern South China Sea in spring 2019
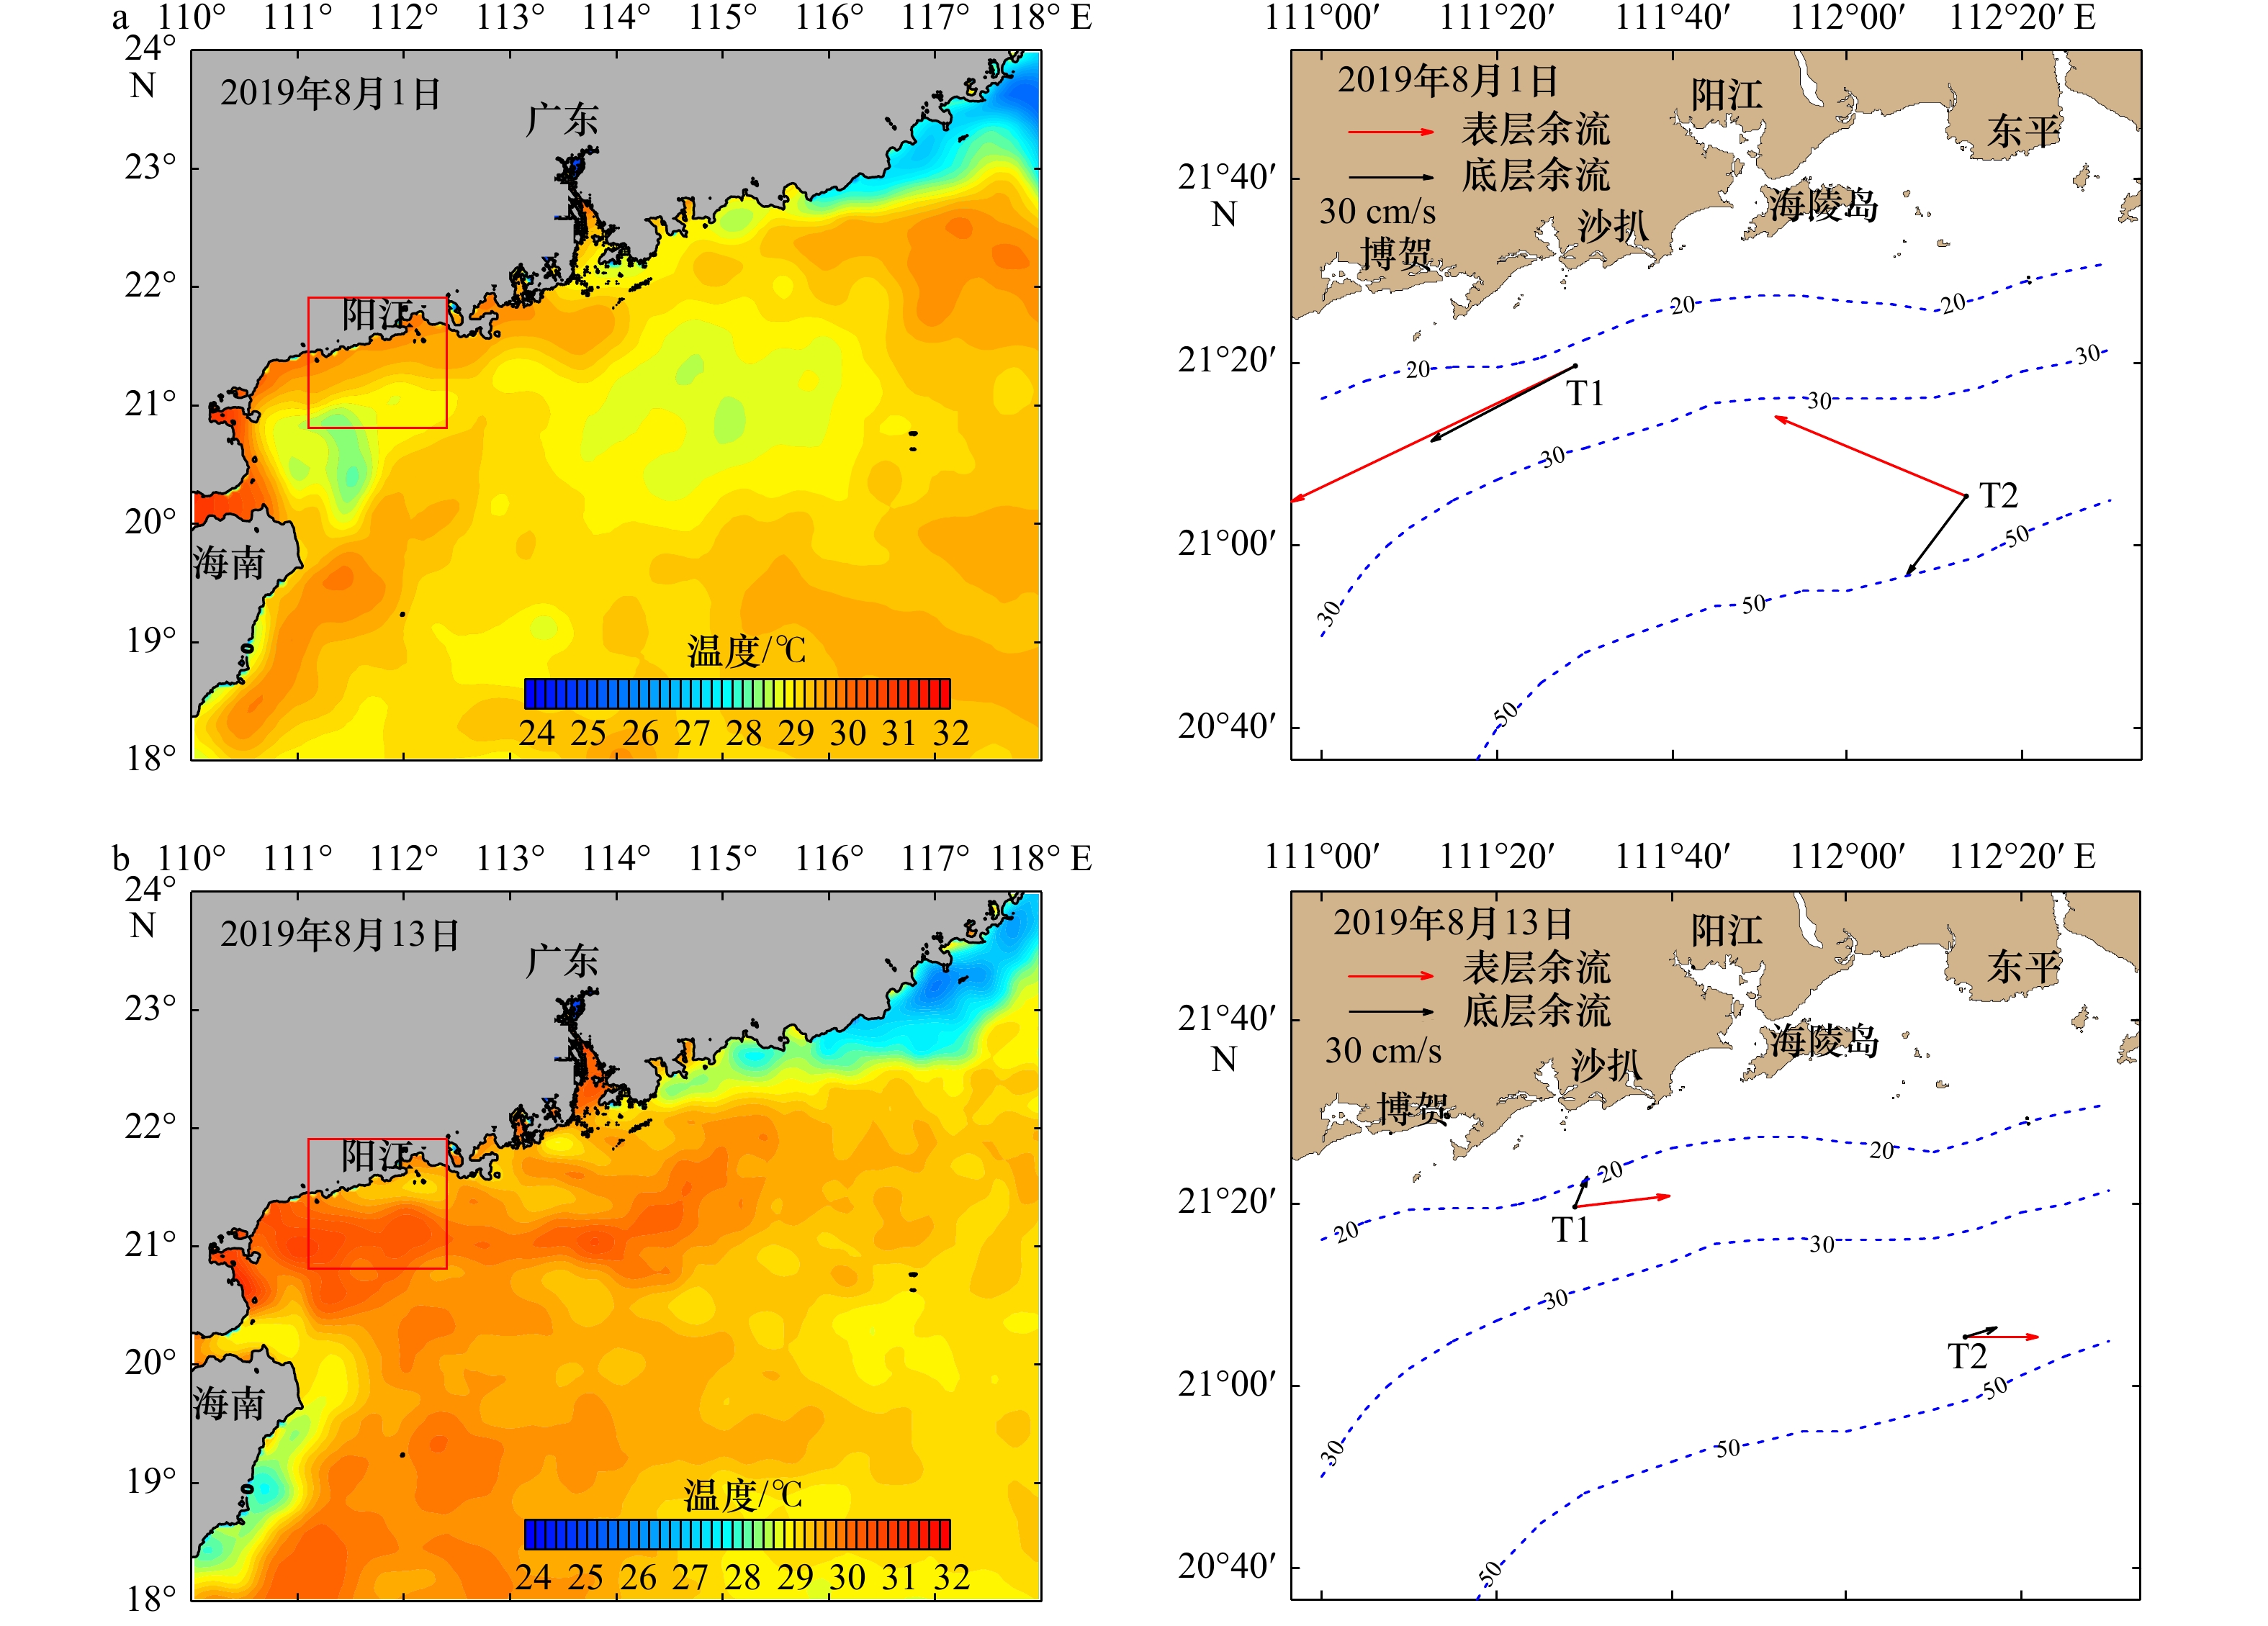
图 11 2019年夏季南海北部海表面温度和T1、T2站余流分布
左图为GHRSST遥感海表面温度,右图为左图同日T1、T2站表层余流和底层余流(右图区域为左图红框内区域)
Fig. 11 Distribution of sea surface temperature and residual current at stations T1 and T2 in the northern South China Sea in the summer of 2019
The left figures show the GHRSST remote sensing sea surface temperature, and the right figures show the surface residual current and bottom residual current at stations T1 and T2 on the same day (the area in the right figure is the area in the red box in the left figure)

图 12 2019年夏季南海北部激流期间AVISO表面高度异常和海表地转流
Fig. 12 AVISO surface level anomaly and surface geostrophic current during the torrent in the northern South China Sea in summer 2019
表 1 观测站位经纬度、水深及观测要素
Tab. 1 Longitude and latitude water depth and observation elements of observation stations
站号 纬度 经度 站位水深/m 观测要素 T1 21°19'36.02''N 111°28'59.17''E 25.4 潮汐、海流、波浪 T2 21°05'21.36''N 112°13'34.68''E 47.1 海流  下载: 导出CSV
表 2 2019年5月和8月典型激流流况
Tab. 2 Typical shock current conditions in May and August, 2019
日期 发生时间 站位 最大流速/(cm·s–1) 最大流速方向/(°) 激流发生前流速/(cm·s–1) 激流与发生前流速之比 持续时间/h 2019年5月5日 6时 T1 164.7 234 40.7 4.0 2 4时 T2 74.2 275 18.4 4.0 2 2019年5月8日 0时 T1 161.4 239 33.8 4.8 3 0时 T2 65.9 267 48.2 1.4 2 2019年8月1日 5时 T1 161.8 250 45.5 3.6 4 6时 T2 107.7 309 21.1 5.1 3
下载: 导出CSV
-
[1] Hollister C D, Mccave I N. Sedimentation under deep-sea storms[J]. Nature, 1984, 309(5965): 220−225. doi: 10.1038/309220a0 [2] 修日晨, 张自历, 刘爱菊. 海洋激流的观测实验及分析讨论[J]. 海洋学报, 2004, 26(2): 118−124.Xiu Richen, Zhang Zili, Liu Aiju. Observational experiment, analysis and discussion of sea storm current[J]. Haiyang Xuebao, 2004, 26(2): 118−124. [3] 尹逊福, 刘爱菊, 张海波. 南海东部区域的海流状况——II. 海洋激流现象[J]. 黄渤海海洋, 2002, 20(2): 7−11.Yin Xunfu, Liu Aiju, Zhang Haibo. Current conditions in the eastern South China Sea—II. Ocean storm current phenomenon[J]. Journal of Oceanography of Huanghai & Bohai Seas, 2002, 20(2): 7−11. [4] 刘爱菊, 修日晨, 张自历, 等. 江苏近海的激流[J]. 海洋学报, 2002, 24(6): 120−126.Liu Aiju, Xiu Richen, Zhang Zili, et al. Storm current in the coastal waters of Jiangsu Province, China[J]. Haiyang Xuebao, 2002, 24(6): 120−126. [5] 彭畅, 陈可锋, 徐志峰. 南黄海辐射沙脊北部水域“激流”特征及成因机制研究[J]. 科学技术与工程, 2014, 14(5): 24−31. doi: 10.3969/j.issn.1671-1815.2014.05.005Peng Chang, Chen Kefeng, Xu Zhifeng. Analyses on characteristics and genesis of storm current in north radial sand ridges area, South Yellow Sea[J]. Science Technology and Engineering, 2014, 14(5): 24−31. doi: 10.3969/j.issn.1671-1815.2014.05.005 [6] 刘爱菊. 滦河口激流状况[J]. 科学技术与工程, 2002, 2(3): 59−60. doi: 10.3969/j.issn.1671-1815.2002.03.022Liu Aiju. Storm current in the Luanhe River Mouth area[J]. Science Technology and Engineering, 2002, 2(3): 59−60. doi: 10.3969/j.issn.1671-1815.2002.03.022 [7] 刘爱菊. 滦河口近海激流成因初探[J]. 科学技术与工程, 2002, 2(5): 16−17. doi: 10.3969/j.issn.1671-1815.2002.05.006Liu Aiju. Preliminary study on the formation cause of inshore storm current in the Luanhe River Mouth area[J]. Science Technology and Engineering, 2002, 2(5): 16−17. doi: 10.3969/j.issn.1671-1815.2002.05.006 [8] 方文东, 陈荣裕, 毛庆文. 南海北部大陆坡区的突发性强流[J]. 热带海洋, 2000, 19(1): 70−75.Fang Wendong, Chen Rongyu, Mao Qingwen. Abrupt strong currents over continental slope of northern South China Sea[J]. Tropic Oceanology, 2000, 19(1): 70−75. [9] 严金辉. 粤西长期海流观测揭示的低频流特征及其动力机制分析[D]. 青岛: 中国海洋大学, 2005.Yan Jinhui. On the low-frequency West-Guangdong coast current and its dynamical mechanism[D]. Qingdao: Ocean University of China, 2005. [10] 谢玲玲, 曹瑞雪, 尚庆通. 粤西近岸环流研究进展[J]. 广东海洋大学学报, 2012, 32(4): 94−98. doi: 10.3969/j.issn.1673-9159.2012.04.019Xie Lingling, Cao Ruixue, Shang Qingtong. Progress of study on coastal circulation near the shore of western Guangdong[J]. Journal of Guangdong Ocean University, 2012, 32(4): 94−98. doi: 10.3969/j.issn.1673-9159.2012.04.019 [11] 伍伯瑜. 珠江口以西陆架海域环流研究Ⅲ[J]. 台湾海峡, 1990, 9(2): 118−126.Wu Boyu. A study on the circulation in shelf waters west to Zhujiang River Mouth Ⅲ. Shelf circulation model[J]. Journal of Oceanography in Taiwan Strait, 1990, 9(2): 118−126. [12] 严金辉, 陈达森. 粤西水东单点系泊海域潮流和低频流特征[J]. 海洋湖沼通报, 2005(3): 8−15. doi: 10.3969/j.issn.1003-6482.2005.03.002Yan Jinhui, Chen Dasen. The characteristics of low frequency currents in the area of Shuidong anchored floating whelf in the west of Guangdong coastal waters[J]. Transactions of Oceanology and Limnology, 2005(3): 8−15. doi: 10.3969/j.issn.1003-6482.2005.03.002 [13] 杨士瑛, 鲍献文, 陈长胜, 等. 夏季粤西沿岸流特征及其产生机制[J]. 海洋学报, 2003, 25(6): 1−8.Yang Shiying, Bao Xianwen, Chen Changsheng, et al. Analysis on characteristics and mechanism of current system in west coast of Guangdong Province in the summer[J]. Haiyang Xuebao, 2003, 25(6): 1−8. [14] Shi Maochong, Chen Changsheng, Xu Qichun, et al. The role of Qiongzhou Strait in the seasonal variation of the South China Sea circulation[J]. Journal of Physical Oceanography, 2002, 32(1): 103−121. doi: 10.1175/1520-0485(2002)032<0103:TROQSI>2.0.CO;2 [15] 杨毅, 徐艳东, 王发云, 等. 粤西沿岸流和物质输移模型研究及应用[J]. 科学技术与工程, 2015, 15(19): 80−85. doi: 10.3969/j.issn.1671-1815.2015.19.015Yang Yi, Xu Yandong, Wang Fayun, et al. A numerical hydrodynamic and transport model in the west coast of Guangdong Province[J]. Science Technology and Engineering, 2015, 15(19): 80−85. doi: 10.3969/j.issn.1671-1815.2015.19.015 [16] 朱冬琳, 陈波, 唐声全. 基于HYCOM模拟的南海西北部环流[J]. 广西科学, 2019, 26(6): 641−646.Zhu Donglin, Chen Bo, Tang Shengquan. Northwest South China Sea circulation based on HYCOM simulation[J]. Guangxi Sciences, 2019, 26(6): 641−646. [17] 吴锋, 钟万勰. 内机械激波——海洋激流的一种解释[J]. 应用数学和力学, 2019, 40(8): 823−839.Wu Feng, Zhong Wanxie. Internal mechanical shock wave: an explanation of the ocean shock current[J]. Applied Mathematics and Mechanics, 2019, 40(8): 823−839. [18] 修日晨, 顾玉荷, 刘爱菊, 等. 海洋激流的若干观测结果[J]. 海洋学报, 2000, 22(4): 118−124.Xiu Richen, Gu Yuhe, Liu Aiju, et al. Some observational results of sea storm current[J]. Haiyang Xuebao, 2000, 22(4): 118−124. [19] 陈宜展, 曹永港, 肖志建, 等. 海口湾海域潮流季节性特征分析[J]. 中山大学学报(自然科学版), 2019, 58(5): 73−79. doi: 10.13471/j.cnki.acta.snus.2019.05.010Chen Yizhan, Cao Yonggang, Xiao Zhijian, et al. The seasonal variation of tidal currents in the Haikou Bay[J]. Acta Scientiarum Naturalium Universitatis Sunyatseni, 2019, 58(5): 73−79. doi: 10.13471/j.cnki.acta.snus.2019.05.010 -

计量
- 文章访问数: 913
- HTML全文浏览量: 241
- PDF下载量: 114
- 被引次数: 0
