

Study on applicability of GOCI inversion and OSU model sea surface currents field data in the Yellow Sea tidal wave system
-
摘要: 黄海呈现独有的地形条件,且该海域的潮波运动独具特征。本文利用静止海洋水色成像仪(Geostationary Ocean Color Imager,GOCI)遥感反演和俄勒冈州立大学(Oregon State University,OSU)潮流模式分别获取了黄海海域的海表流场,基于该海域独特的潮波系统提出并识别潮波干涉区,进而对GOCI反演的流场做潮流提取,并对两种潮流数据作分区可用性评价,通过实测的漂流浮标数据验证评估。结果表明:利用GOCI反演和OSU潮流模式获取的海表流场具有一定程度的可靠性,GOCI反演的海表流场的流速平均相对大小误差值为0.77,OSU潮流模式获取的海表流场流速平均相对大小误差值为0.49;在靠近潮波干涉区的黄海中部海域,GOCI潮流数据与实测数据在方向上的一致性要优于OSU潮流数据,两者平均角度误差值分别为48.45°和63.10°;在远离潮波干涉区的黄海近岸海域,OSU潮流数据与实测数据在速度大小和方向上的一致性要优于GOCI潮流数据。Abstract: The Yellow Sea presents unique topographic conditions, and the tidal wave movement in this area has unique characteristics. In this paper, Geostationary Ocean Color Imager (GOCI) inversion and Oregon State University (OSU) tidal current model are used to obtain the sea surface currents field in the Yellow Sea. Based on the unique tidal wave system in the sea area, the tidal wave interference area is proposed and identified, and then the currents field of GOCI inversion is extracted. And partition of two kinds of trend data usability evaluation, through the validation of the drifting buoy data evaluation. The results show that the sea surface currents field obtained by GOCI inversion and OSU tidal current model has a certain degree of reliability. The AME value of sea surface currents field velocity obtained by GOCI inversion is 0.77, and that obtained by OSU tidal model is 0.49. On the whole, the currents field data obtained by GOCI inversion and OSU tide model are reliable to a certain extent. In the central area of the Yellow Sea near the tidal wave interference area, the consistency between GOCI tidal currents data and OSU tidal currents data is better than that of OSU tidal currents data, and their AAE values are 48.45° and 63.10°, respectively. In the coastal area of the Yellow Sea far from the tidal wave interference area, the consistency between the OSU tidal currents data and the measured data is better than that of the GOCI tidal currents data in terms of velocity magnitude and direction.
-
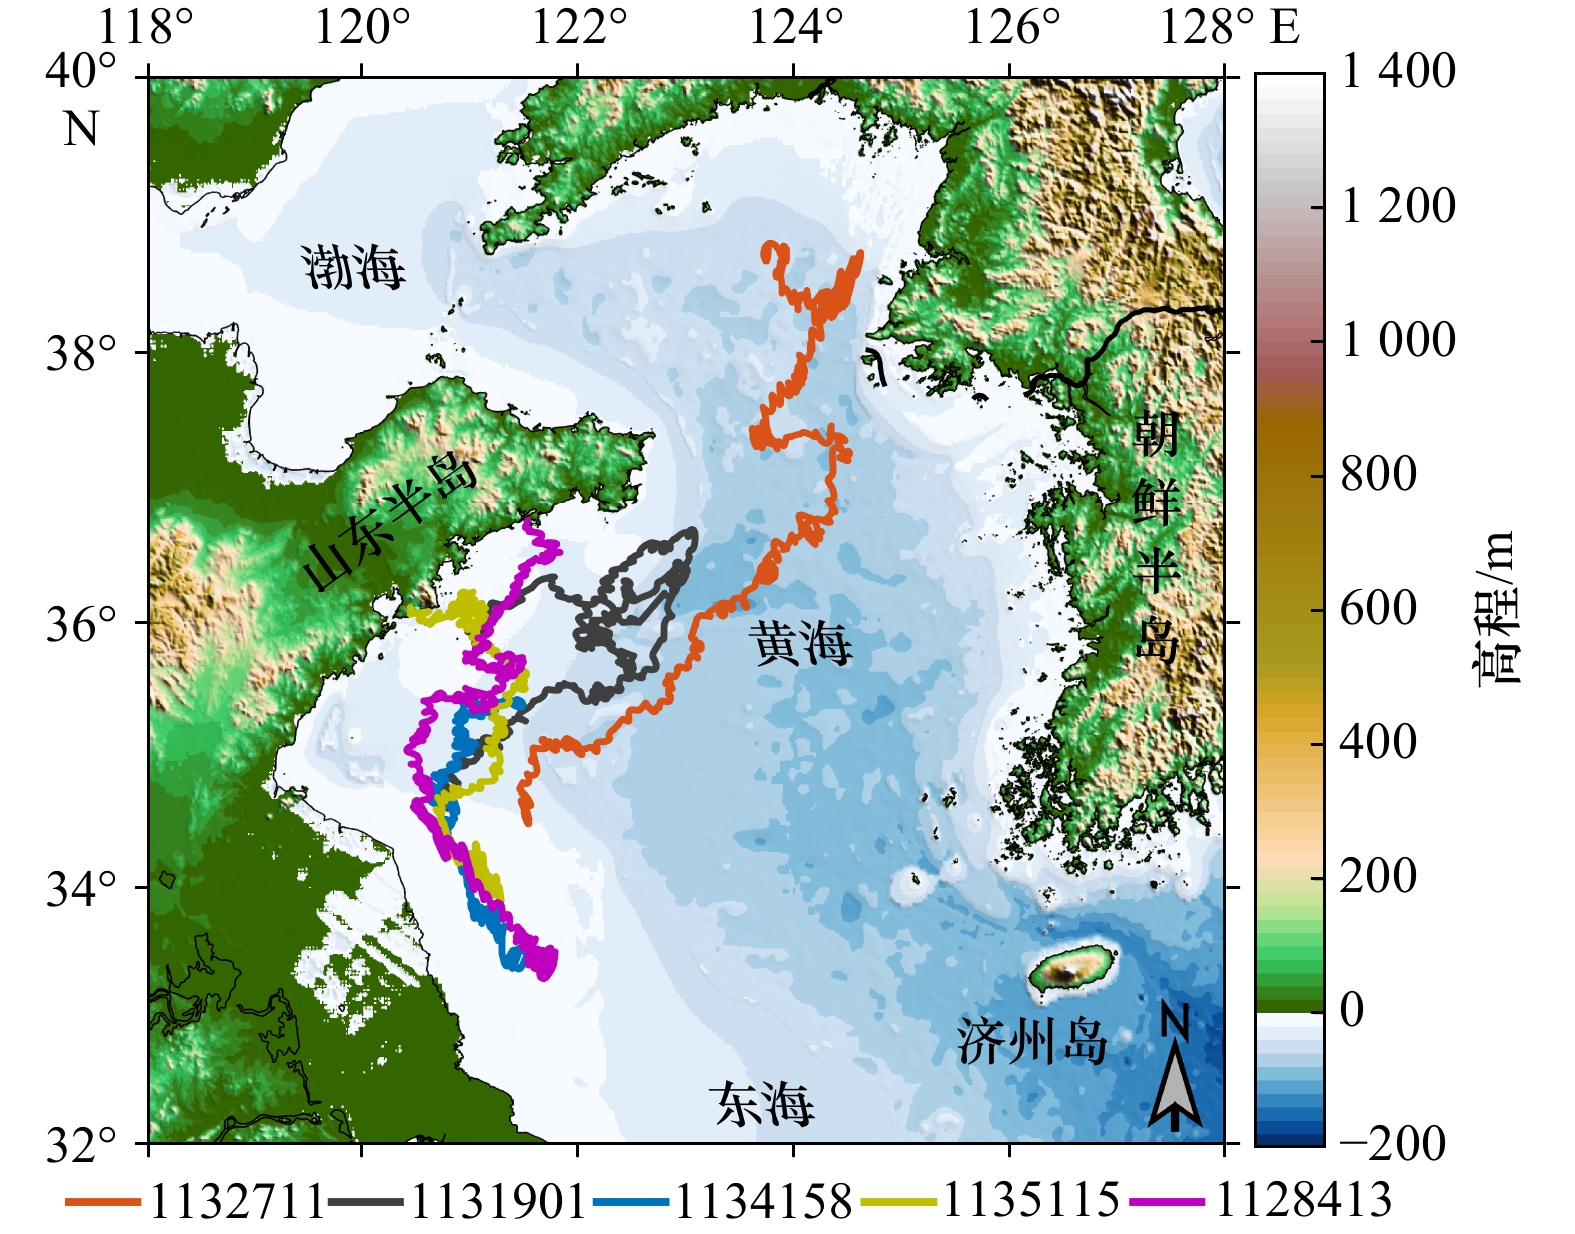
图 1 研究区域及其水深地形
从浅蓝色到深蓝色,水深范围为10~160 m;多色线组为实测漂流浮标轨迹(数字为编号)
Fig. 1 The study area and its bathymetry topography
From light blue to dark blue, the water depth ranges from 10 m to 160 m; the multi-color line group is the measured tracks of drifting buoys (numbers are codes)

图 3 最大相关系数算法估算海表流场的示意图
以首次可反演的流场为例,左侧与右侧的图像分别代表在同一海区、同一天8:30和9:30观测的卫星遥感影像;左图实框为模板窗口;右图实框为匹配窗口;虚框为模板窗口在搜索区域内相同位置的映射
Fig. 3 A schematic diagram of the maximum correlation coefficient algorithm for estimating the sea surface currents field
Take the first invertible currents field as an example, the images on the left and right represent satellite remote sensing images observed in the same sea area and on the same day at 8:30 and 9:30, respectively; the solid line box in the left figure is the template window; the solid line box in the right figure is the matching window; the dotted line box is the mapping of the template window at the same position in the search area

图 4 2012年8月5日7个时段的GOCI反演的海表流场分布
Fig. 4 GOCI-derived sea surface currents field at seven intervals on August 5, 2012

图 5 2012年8月5日7个时段的OSU模式计算的海表流场分布
Fig. 5 OSU-derived sea surface currents field at seven intervals on August 5, 2012
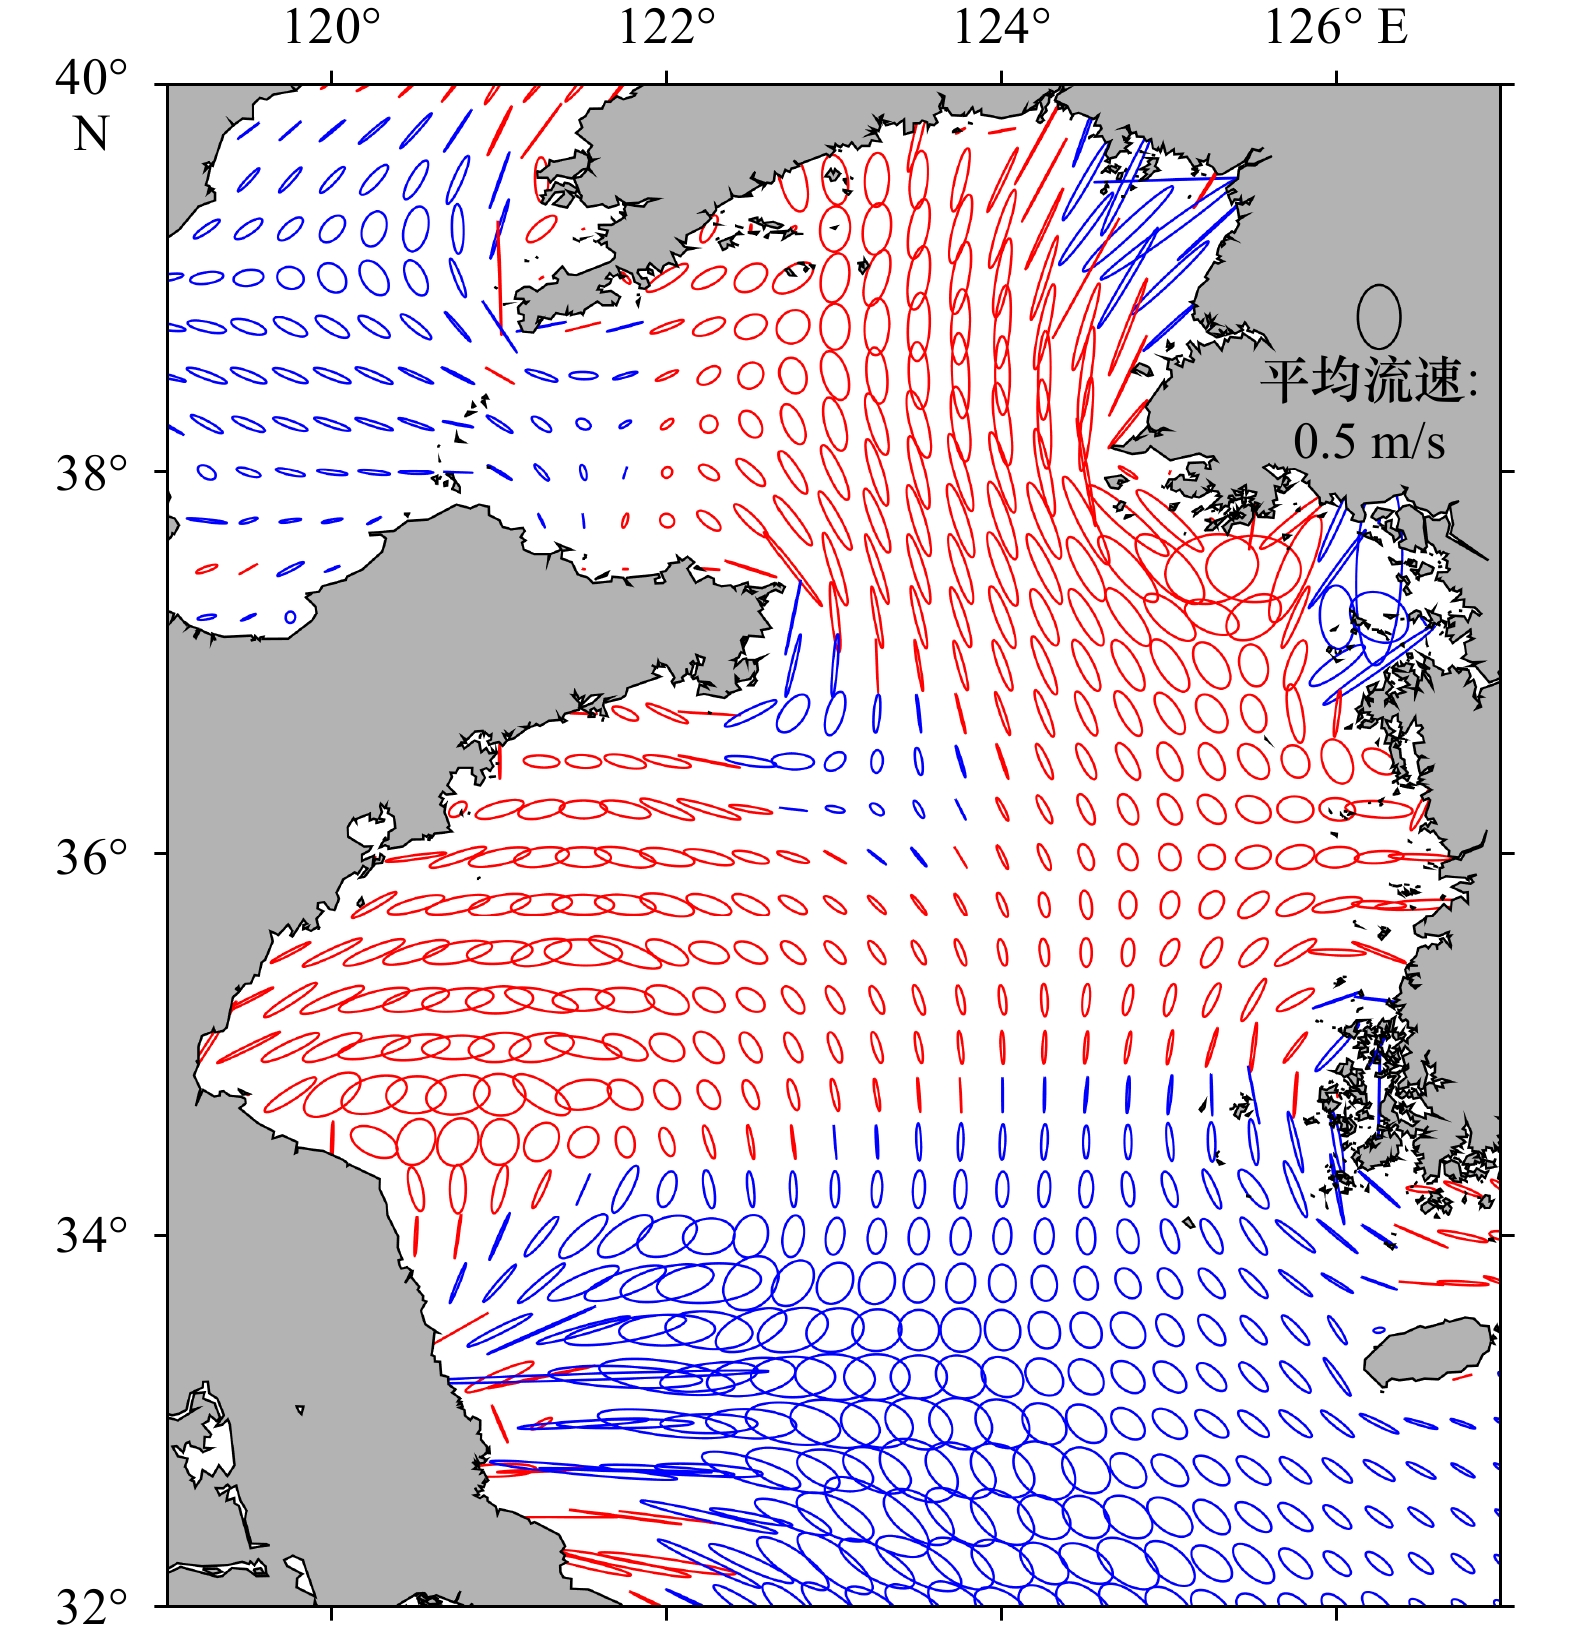
图 6 OSU模式模拟的黄海M2潮流椭圆分布
蓝色(红色)表示顺(逆)时针旋转
Fig. 6 Ellipse distribution of the Yellow Sea M2 tidal current simulated by OSU model
Blue (red) means clockwise (counter-clockwise) rotation

图 7 OSU模式模拟的黄海M2分潮同潮
实线为迟角,单位:(°);虚线为振幅,单位:cm;红点为无潮点位置分布
Fig. 7 The Yellow Sea M2 with the same tide simulated by OSU model
The solid lines are the delay angle, unit is (°); the dashed lines are the amplitude, unit is cm; the red dots are the distribution of no-tide points
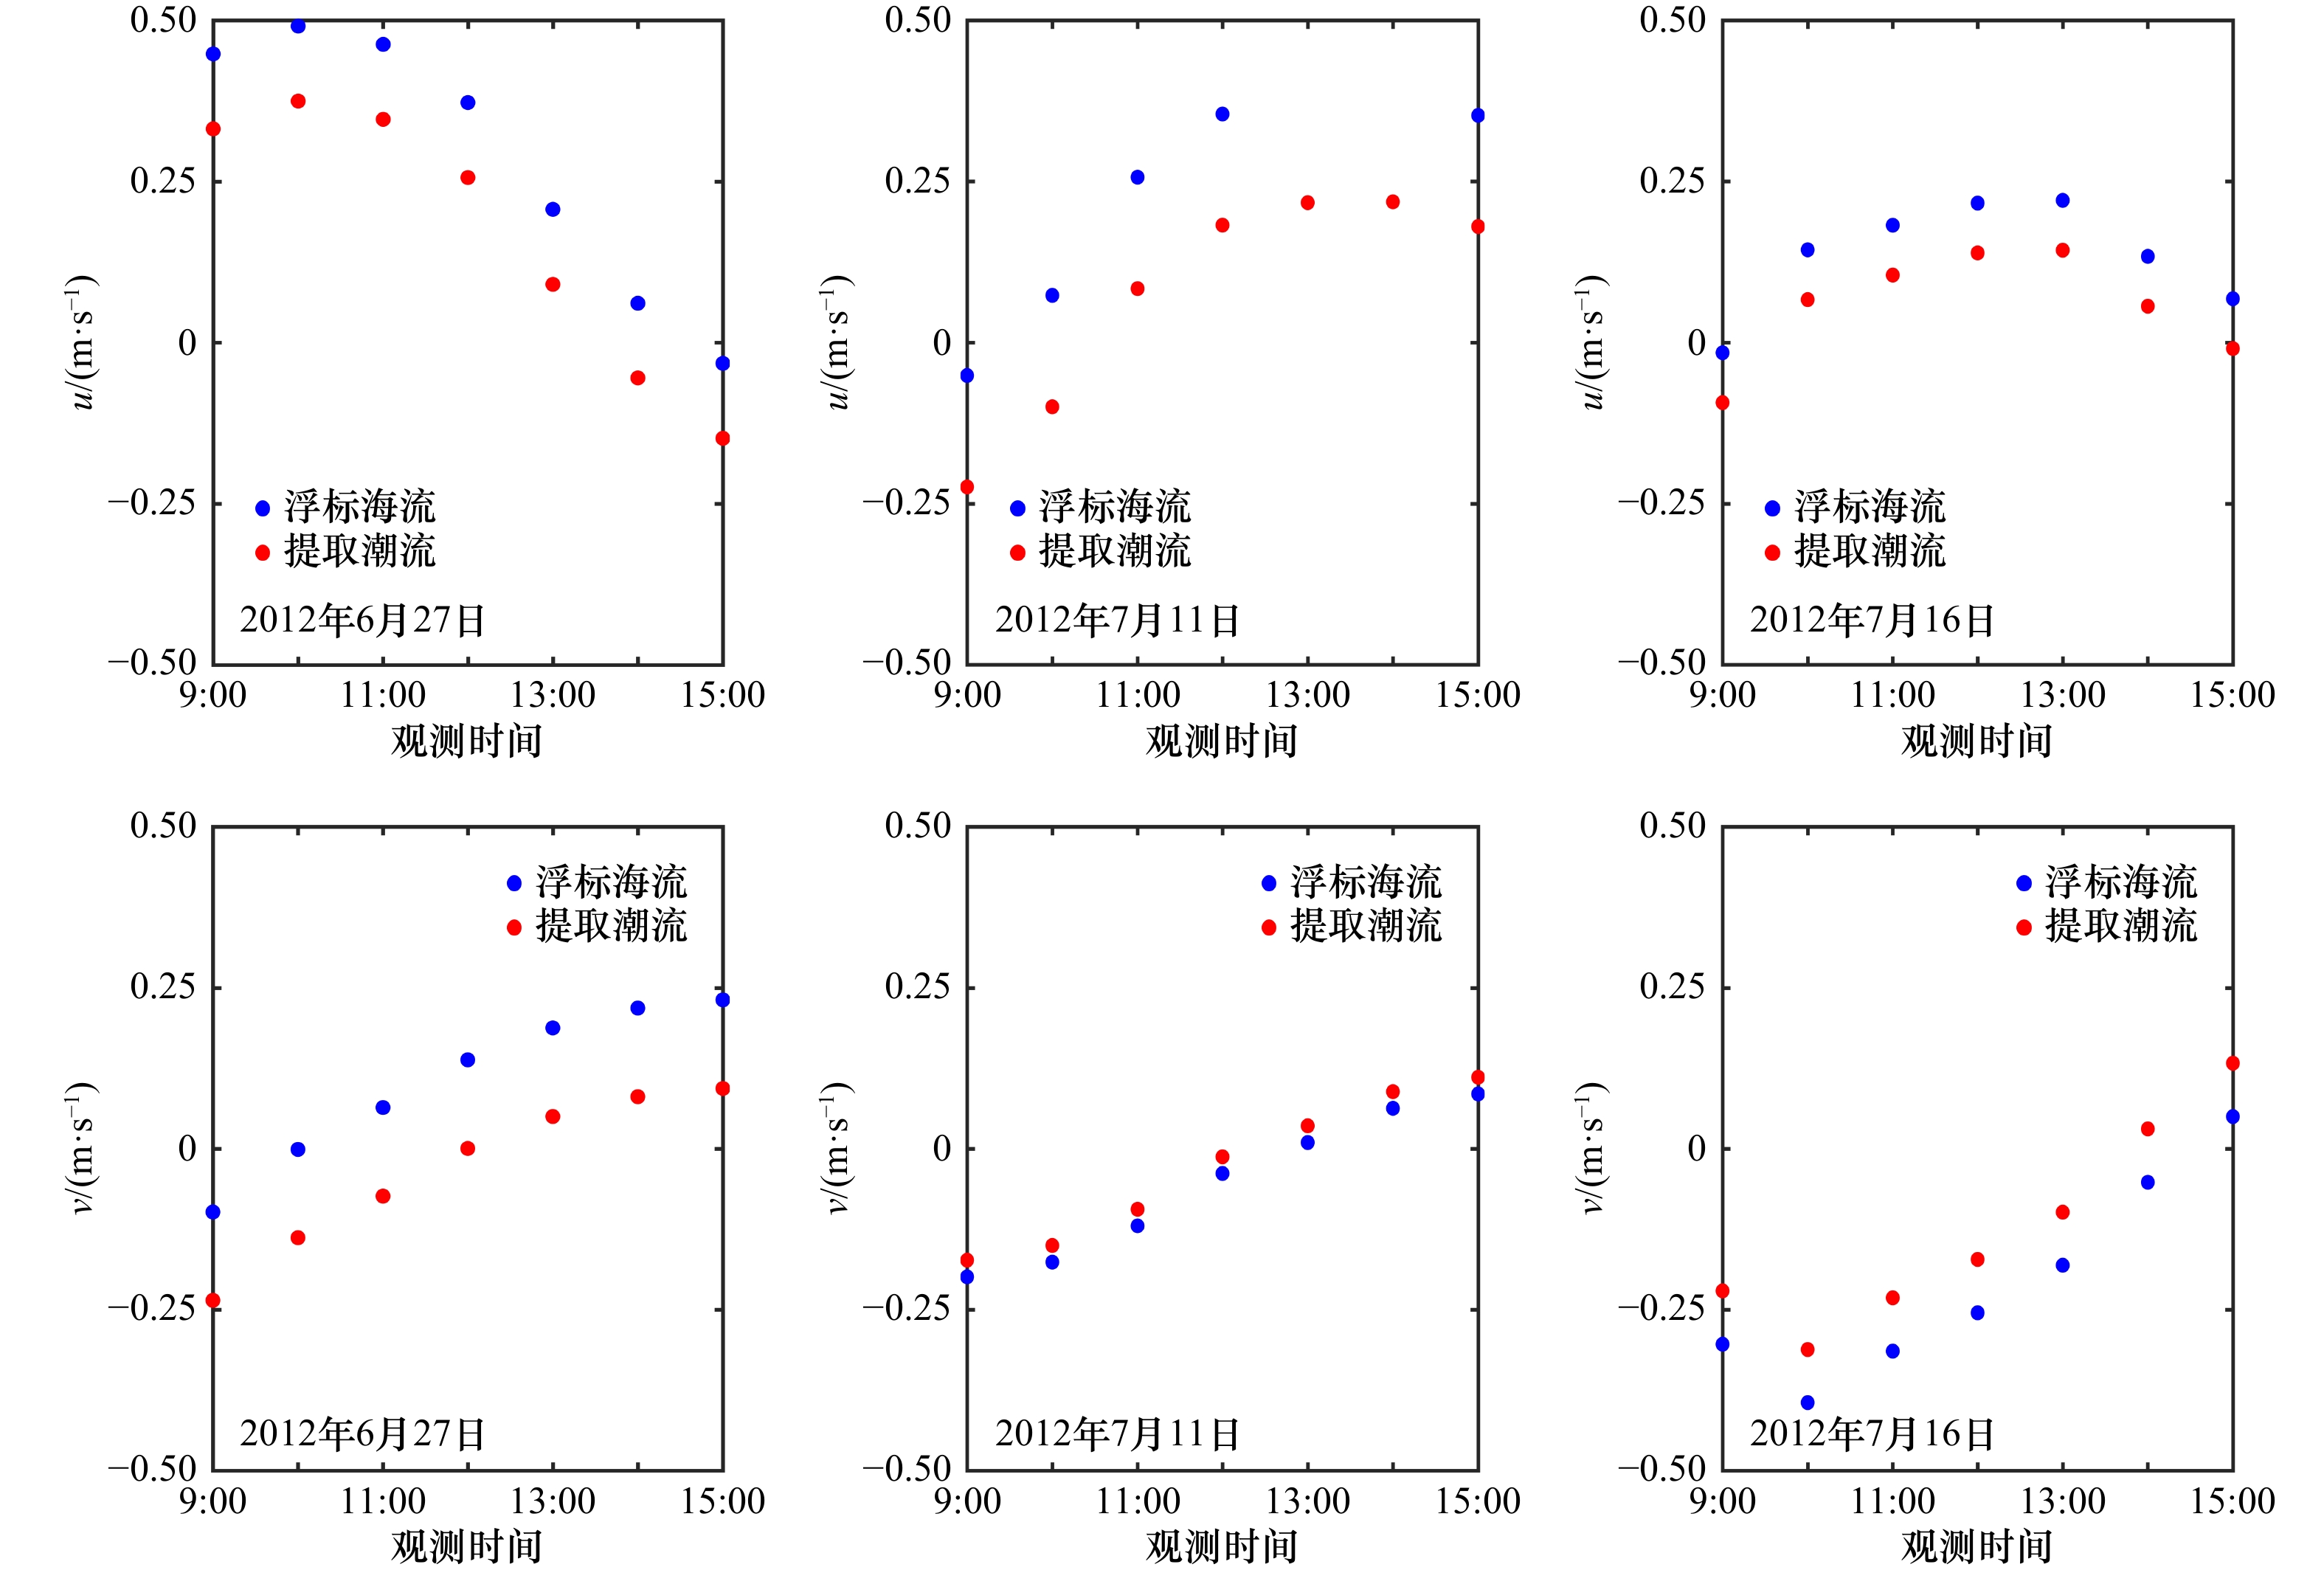
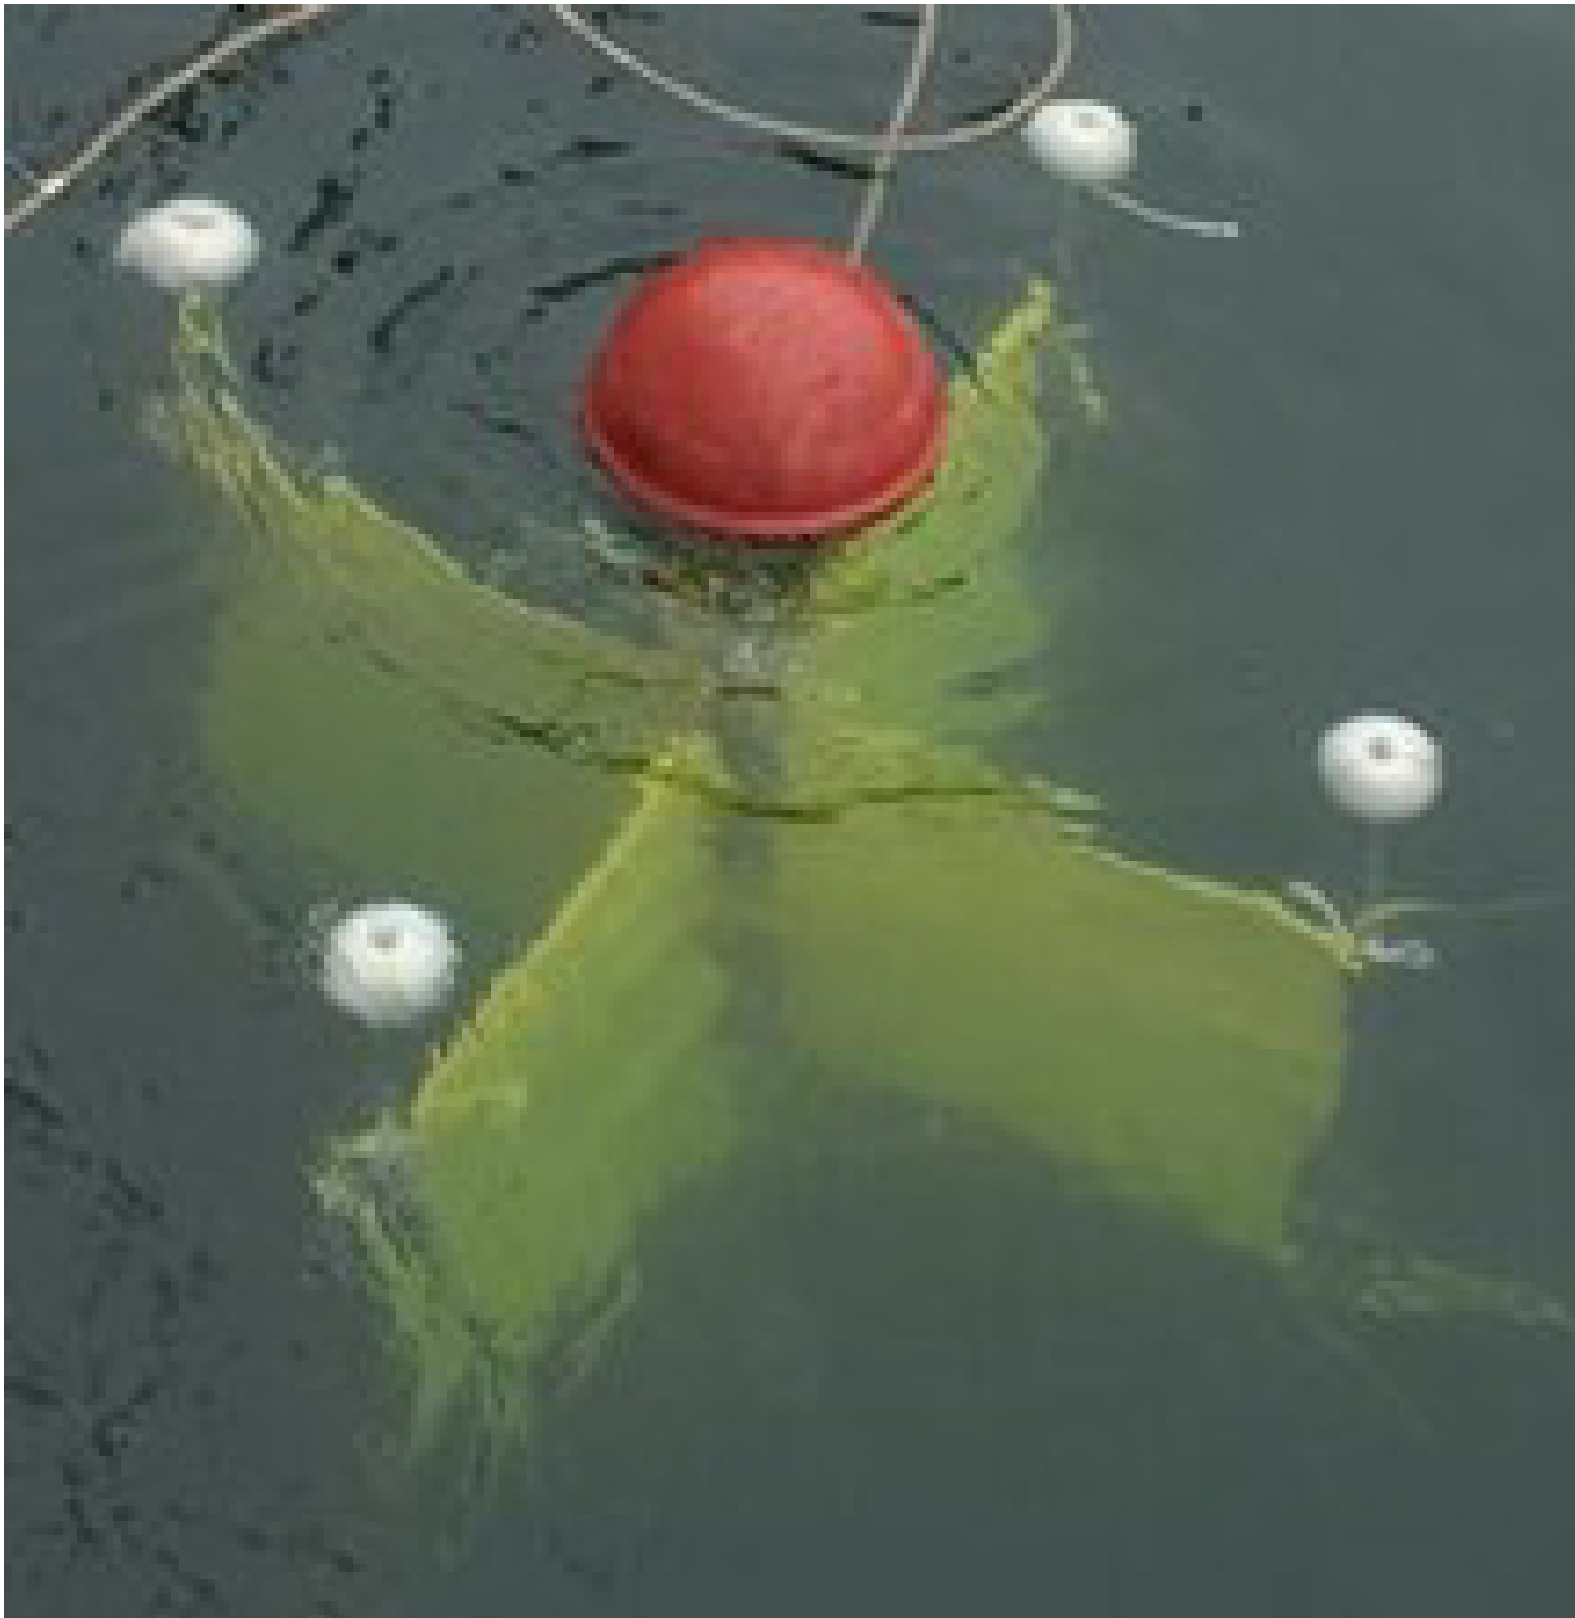
图 8 漂流浮标海流与提取潮流的比较
u分量正负分别代表东向和西向;v分量正负分别代表南向和北向
Fig. 8 Comparison between the following currents of drifting buoys and the extracted tidal currents
The positive and negative of u component represent east and west respectively; the positive and negative of v component represent south and north respectively

图 9 2012年潮流数据分区对比
红点表示选取案例的浮标点位
Fig. 9 Zonal comparison of tidal current data in 2012
The red dots represent the buoy points of the selected cases

图 10 黄海中部海域潮流数据对比
红点M1和M2分别为两个无潮点的位置;蓝色虚框为选取的数据范围
Fig. 10 Comparison of tidal currents data in the central Yellow Sea
The red points M1 and M2 are the positions of two moisture-free points; the blue virtual box is the selected data range

图 11 黄海近岸海域潮流数据对比
红点M1和M2分别为两个无潮点的位置;蓝色虚框为选取的数据范围
Fig. 11 Comparison of tidal currents data in the coastal Yellow Sea
The red points M1 and M2 are the positions of two moisture-free points; the blue virtual box is the selected data range
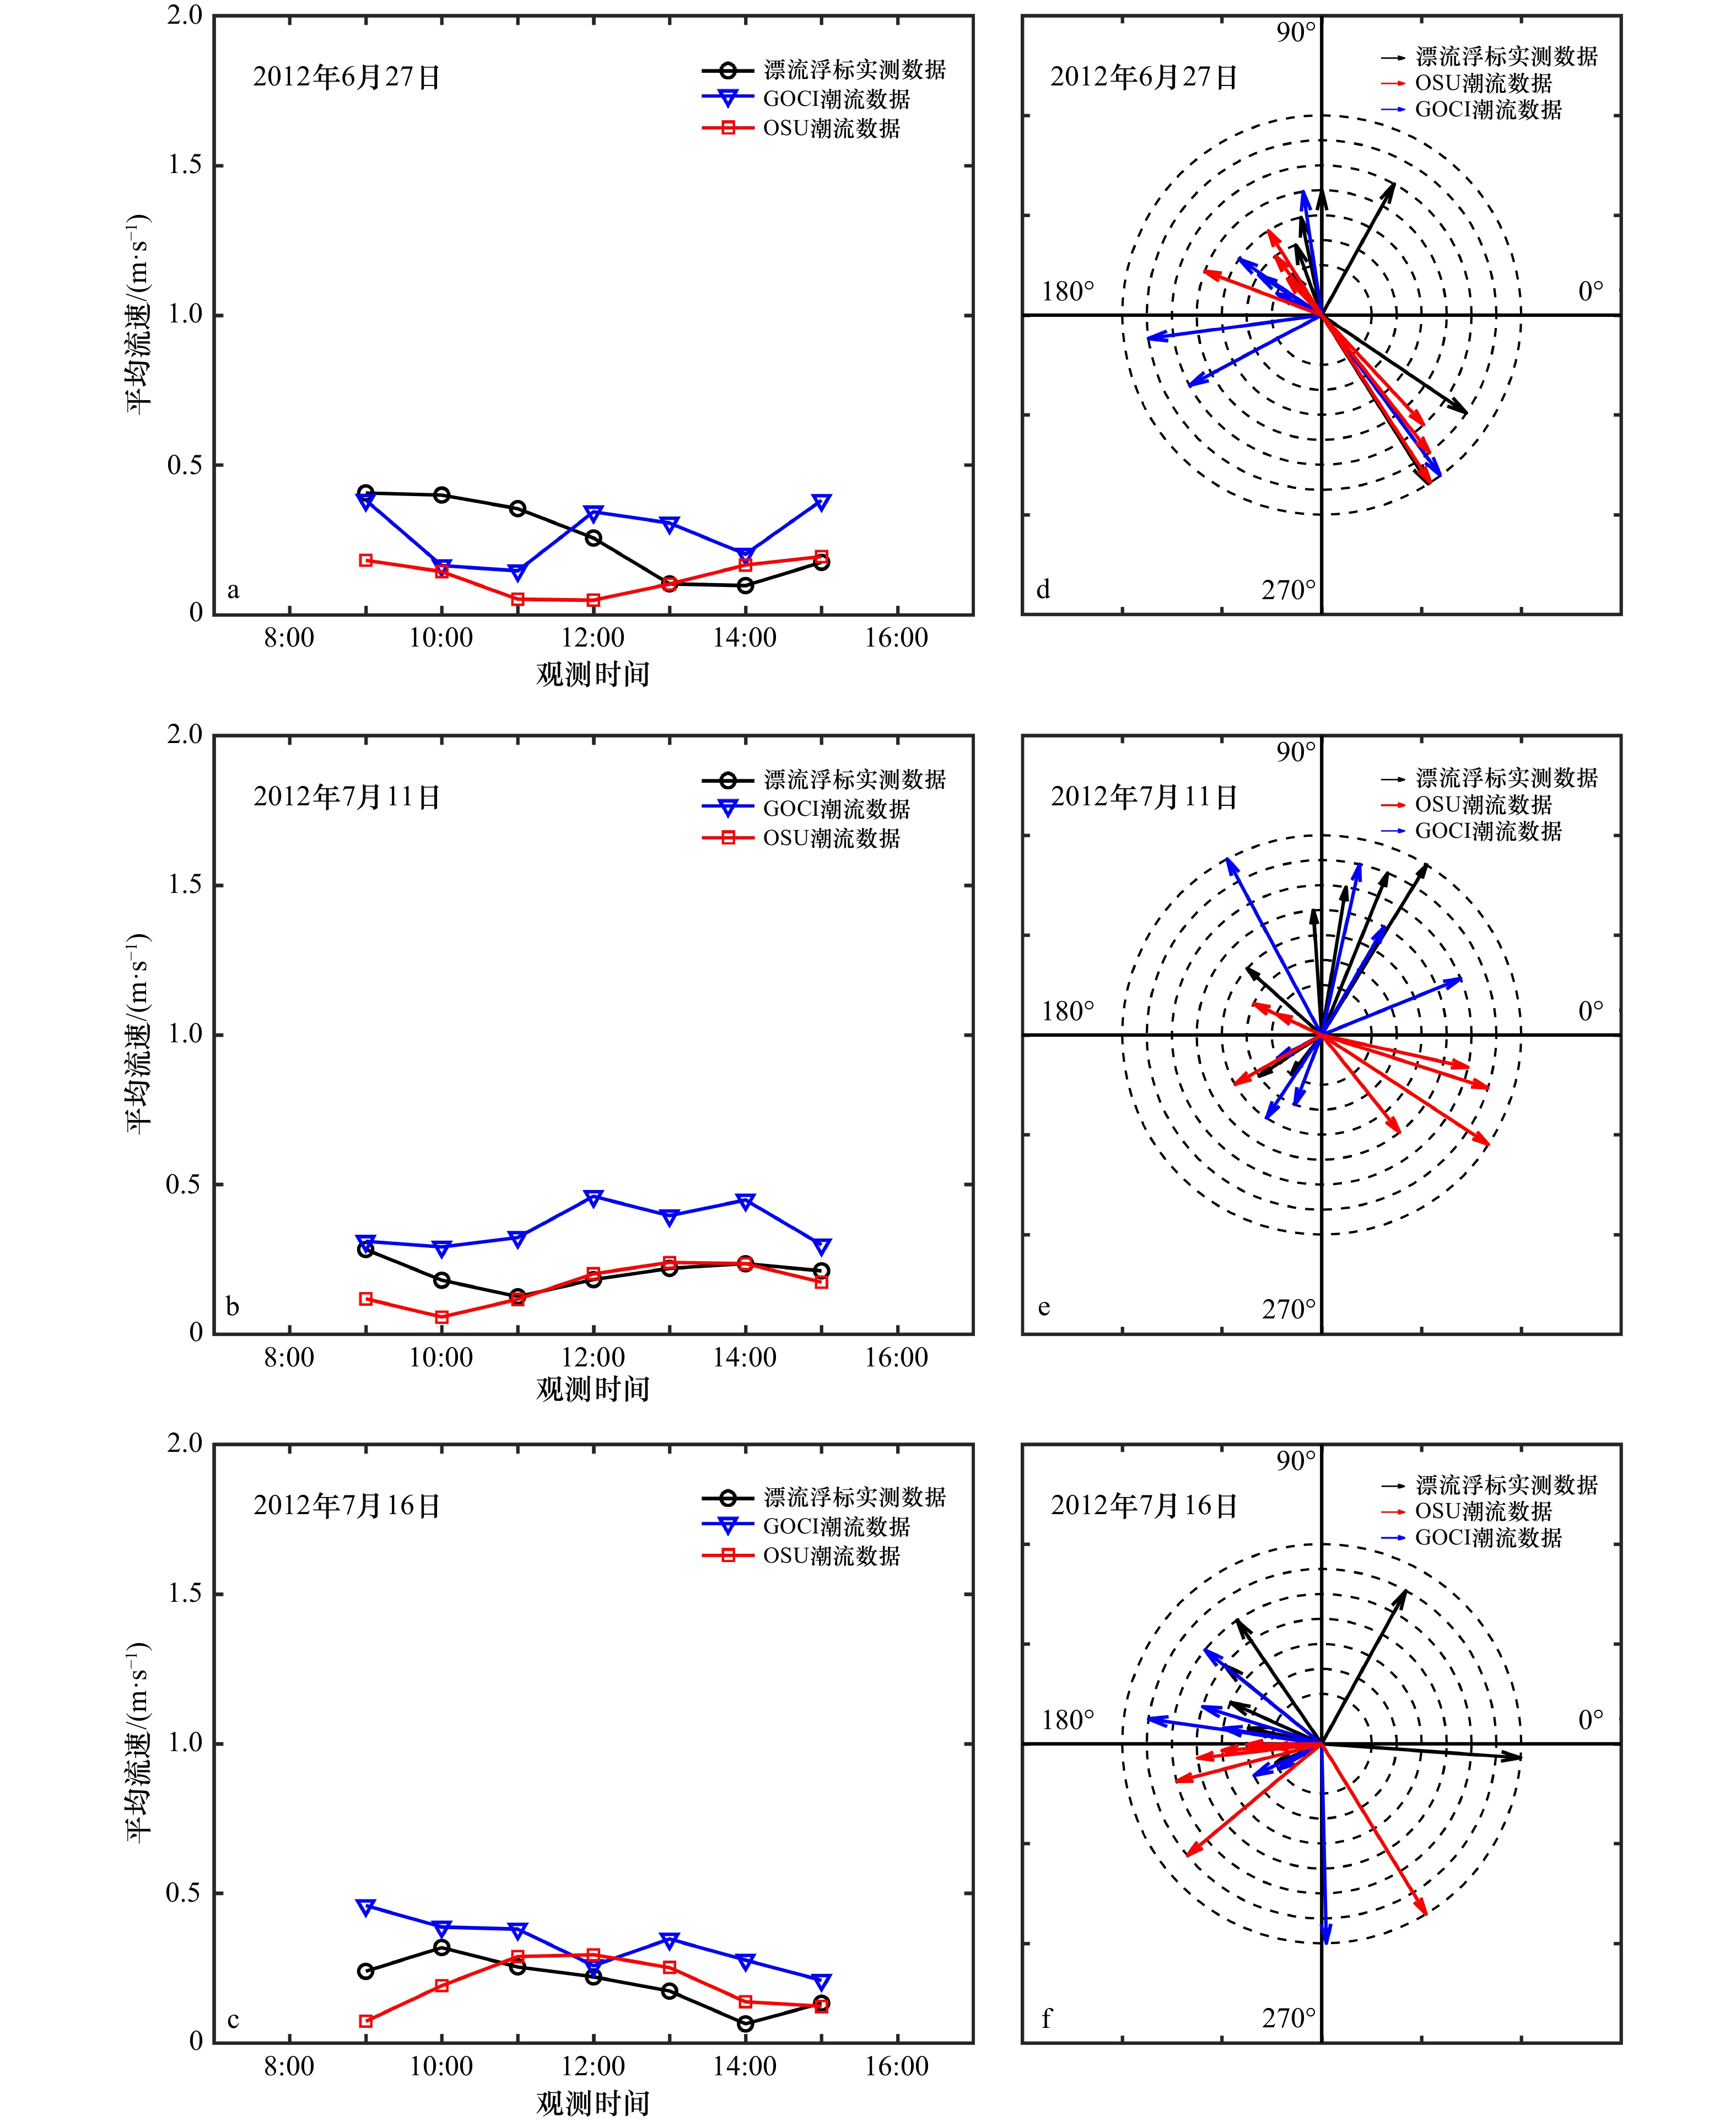
图 12 黄海中部海域潮流数据平均流速(a−c)和流向(d−f)
流向图中半径从小到大的虚线圆代表8:30−15:30 7个时段(获得流速值的时间取自每个时间段的中间,如8:30−9:30的值由9:00的值表示)
Fig. 12 The average currents velocity (a−c) and currents direction (d−f) of the tidal currents data in the central Yellow Sea
The dotted circles with the radius from small to large in the flow graph represent the seven time periods from 8:30−15:30 (the time to obtain the currents velocity value is taken from the middle of each time period, such as the value of 8:30−9:30 is represented by the value of 9:00)
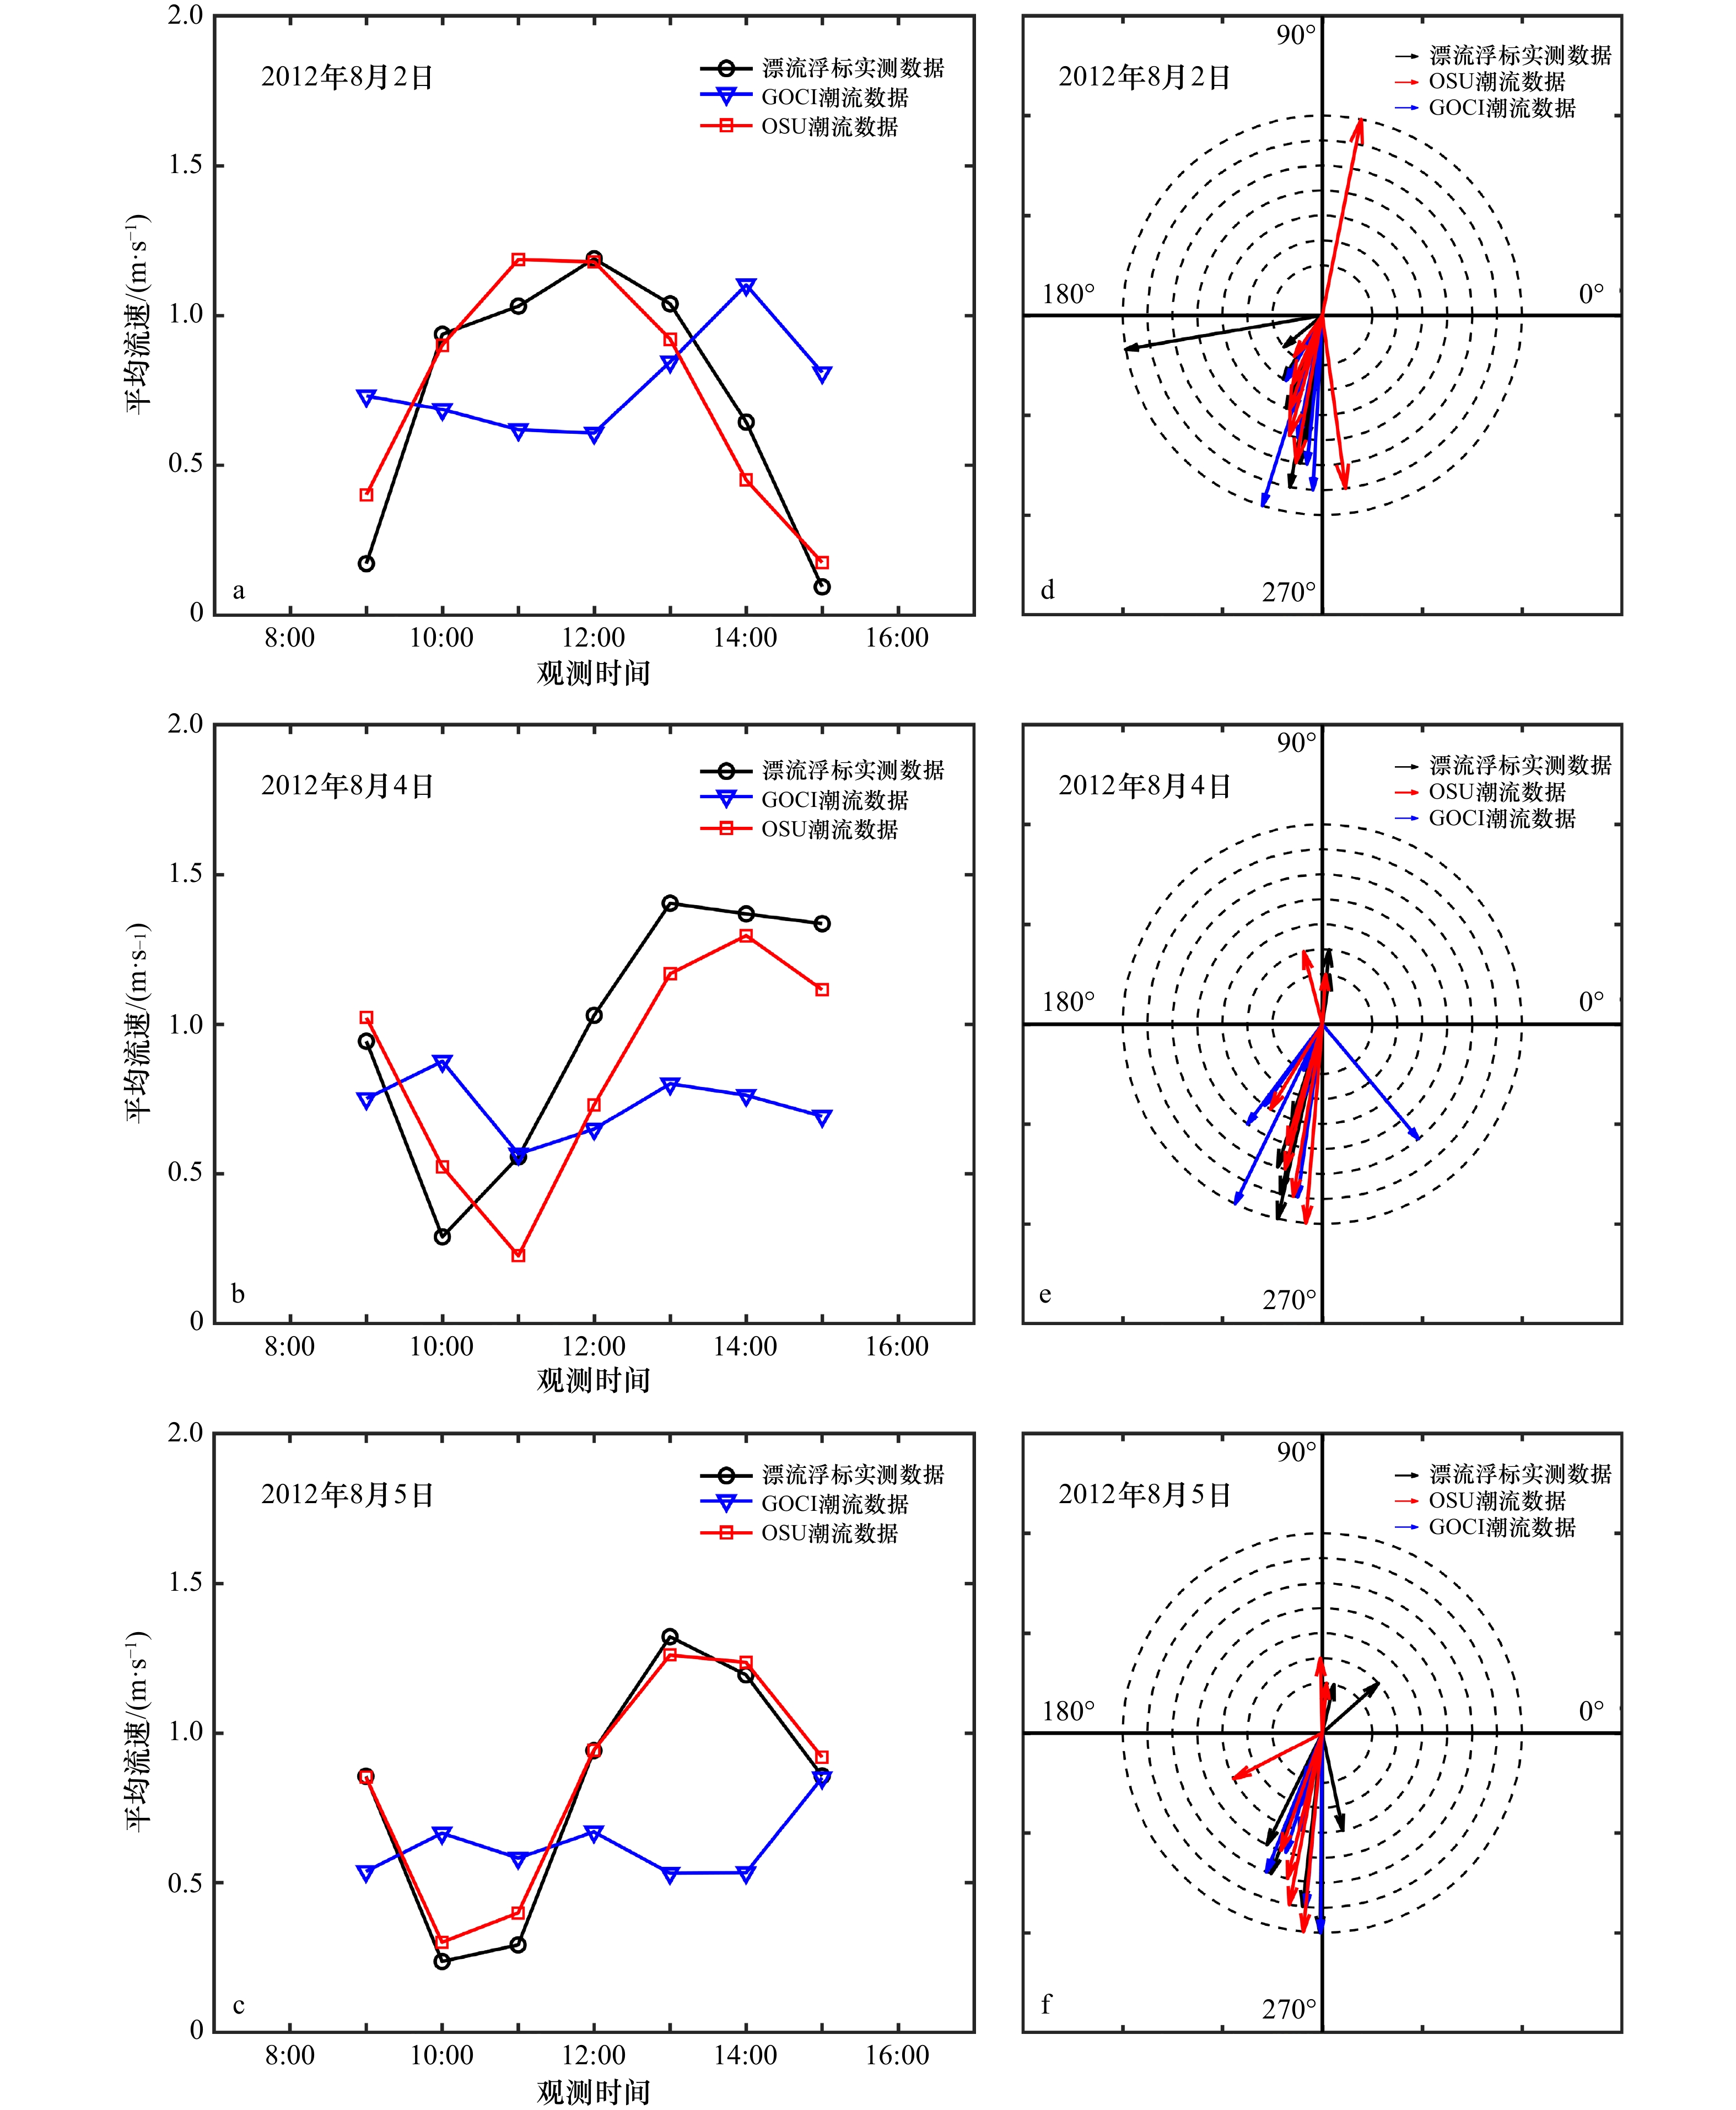
图 13 黄海近岸海域潮流数据平均流速(a−c)和流向(d−f)
流向图中半径从小到大的虚线圆代表8:30−15:30 7个时段(获得流速值的时间取自每个时间段的中间,如8:30−9:30的值由9:00的值表示)
Fig. 13 The average currents velocity (a−c) and currents direction (d−f) of the tidal currents data in the coastal Yellow Sea
The dotted circles with the radius from small to large in the flow graph represent the seven time periods from 8:30−15:30 (the time to obtain the currents velocity value is taken from the middle of each time period, such as the value of 8:30−9:30 is represented by the value of 9:00)

图 14 GOCI反演流场1 d的 7个时段日平均余流
Fig. 14 Daily average residual currents in seven periods of the day of GOCI inversion current field
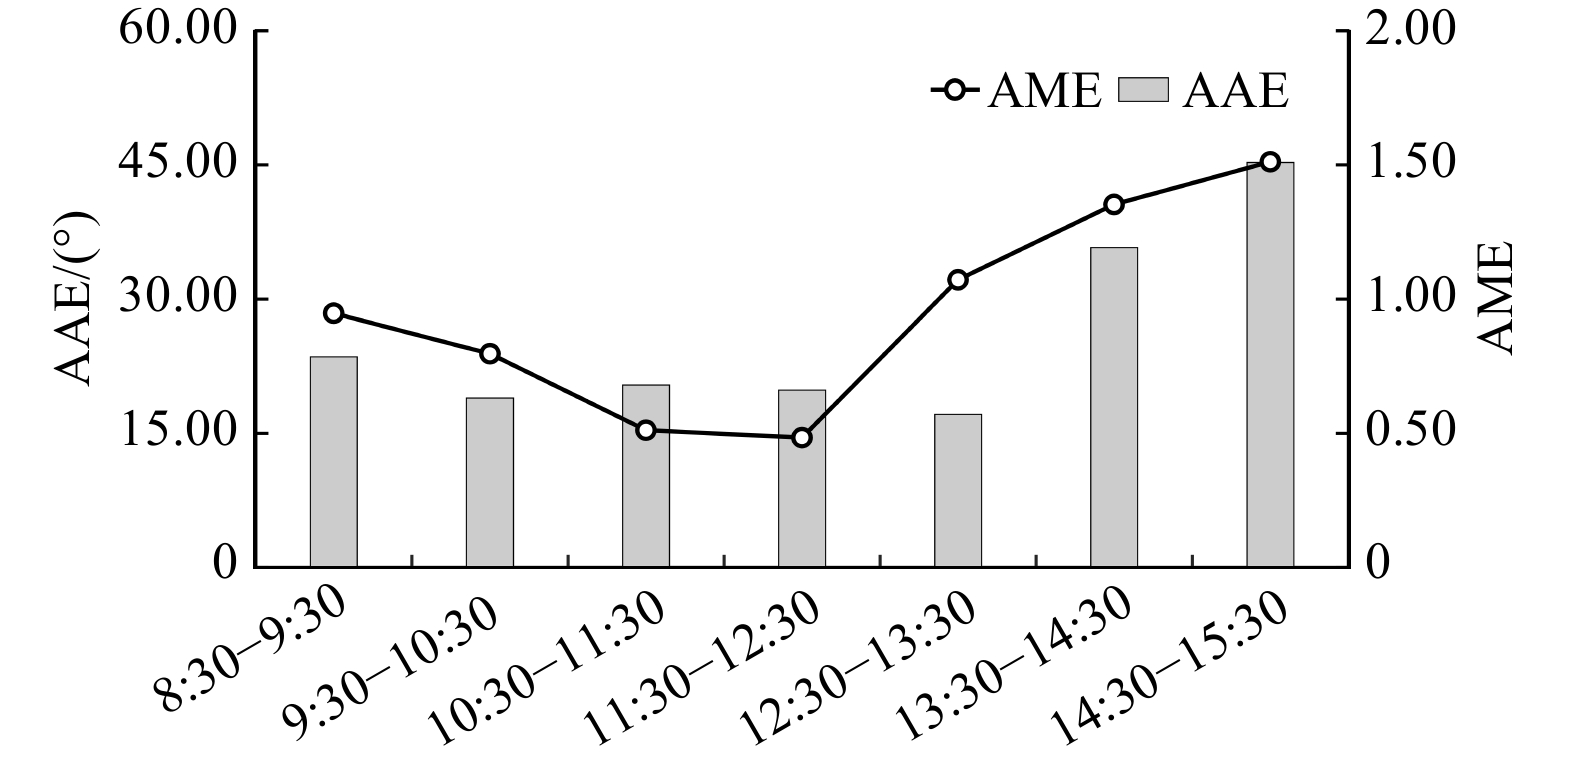
图 15 GOCI反演流场3 d数据AAE和AME的平均值
Fig. 15 Average of AAE and AME of three-day data in GOCI inversion current field

图 16 3种不同示踪物的GOCI流场反演结果对比
Fig. 16 Comparison of GOCI flow field inversion results of three different tracers
表 1 OSU模式计算结果与实测值的比较
Tab. 1 Comparison of OSU mode calculation results and actual measured values
浮标编号 站点数目 实测平均流速/
(m·s−1)OSU平均流速/
(m·s−1)平均角度偏差/
(°)1132711 1 759 0.43 0.41 44.16 1134158 663 0.45 0.52 22.43 1128413 1 366 0.39 0.46 42.85 1135115 930 0.31 0.39 39.19 1131901 1 787 0.28 0.34 49.90 平均 1 301 0.37 0.42 39.71  下载: 导出CSV
表 2 中部区域与近岸区域矢量值的比较
Tab. 2 Comparison of vector values between the central region and the nearshore region
所在区域 矢量数目 实测平均流速/
(m·s−1)OSU平均流速/
(m·s−1)平均角度偏差/
(°)中部区域 300 0.21 0.31 59.29 近岸区域 300 0.69 0.65 25.41
下载: 导出CSV
表 3 黄海中部与近岸海域GOCI与OSU潮流数据的AME值和AAE值
Tab. 3 The AME value and AAE value of GOCI and OSU tidal current data in the central and coastal waters of the Yellow Sea
日期 GOCI OSU AME值 AAE值/(°) AME值 AAE值/(°) 黄海中部海域 6月27日 0.85 49.65 0.55 38.07 7月11日 0.91 57.20 0.34 95.76 7月16日 1.06 38.50 0.48 55.48 平均 0.94 48.45 0.46 63.10 黄海近岸海域 8月2日 1.87 33.38 0.42 31.62 8月4日 0.61 63.12 0.31 23.02 8月5日 0.72 76.89 0.16 9.40 平均 1.07 57.79 0.30 21.34
下载: 导出CSV
表 4 3种不同示踪物的GOCI流场反演结果统计
Tab. 4 Statistics of GOCI currents field inversion results of three different tracers
日期 时段 Chl a浓度 Rrs TSM浓度 流场矢量数目 AME值 AAE值/(°) 流场矢量数目 AME值 AAE值/(°) 流场矢量数目 AME值 AAE值/(°) 6月27日 11:30−12:30 1010 1.13 21.83 955 1.22 27.04 1005 0.67 13.62 12:30−13:30 976 1.90 27.15 952 0.54 16.17 981 1.59 18.31 7月11日 11:30−12:30 472 0.30 13.99 448 0.62 13.51 476 0.53 15.34 12:30−13:30 580 0.25 6.44 487 0.50 16.10 553 0.52 12.54 7月16日 11:30−12:30 467 0.32 24.74 464 0.76 39.16 484 0.32 29.59 12:30−13:30 534 0.73 15.95 503 1.42 24.14 541 0.99 12.34 平均 673 0.77 18.35 634 0.84 22.69 673 0.77 16.96
下载: 导出CSV
-
[1] Paduan J D, Washburn L. High-frequency radar observations of ocean surface currents[J]. Annual Review of Marine Science, 2013, 5: 115−136. doi: 10.1146/annurev-marine-121211-172315 [2] Klemas V. Remote sensing of coastal and ocean currents: An overview[J]. Journal of Coastal Research, 2012, 28(3): 576−586. doi: 10.2112/JCOASTRES-D-11-00197.1 [3] Amin R, Lewis M D, Lawson A, et al. Comparative analysis of GOCI ocean color products[J]. Sensors, 2015, 15(10): 25703−25715. doi: 10.3390/s151025703 [4] Choi J K, Yang H, Han H J, et al. Quantitative estimation of suspended sediment movements in coastal region using GOCI[J]. Journal of Coastal Research, 2013, 65(10065): 1367−1372. [5] Yang H, Choi J K, Park Y J, et al. Application of the geostationary ocean color imager (GOCI) to estimates of ocean surface currents[J]. Journal of Geophysical Research: Oceans, 2014, 119(6): 3988−4000. doi: 10.1002/2014JC009981 [6] Egbert G D, Bennett A F, Foreman M G G. TOPEX/POSEIDON tides estimated using a global inverse model[J]. Journal of Geophysical Research: Oceans, 1994, 99(C12): 24821−24852. doi: 10.1029/94JC01894 [7] Egbert G D, Erofeeva S Y. Efficient inverse modeling of barotropic ocean tides[J]. Journal of Atmospheric and Oceanic Technology, 2002, 19(2): 183−204. doi: 10.1175/1520-0426(2002)019<0183:EIMOBO>2.0.CO;2 [8] Hu Zifeng, Wang Dongping, Pan Delu, et al. Mapping surface tidal currents and Changjiang plume in the East China Sea from geostationary ocean color imager[J]. Journal of Geophysical Research: Oceans, 2016, 121(3): 1563−1572. doi: 10.1002/2015JC011469 [9] 赵强, 侯国锋, 汤志华, 等. 七个海洋潮汐模式在浙江海域的准确度评估[J]. 海洋科学进展, 2018, 36(2): 310−320. doi: 10.3969/j.issn.1671-6647.2018.02.016Zhao Qiang, Hou Guofeng, Tang Zhihua, et al. Accuracy assessment of seven numerical models on simulating tides in the coastal area of Zhejiang[J]. Advances in Marine Science, 2018, 36(2): 310−320. doi: 10.3969/j.issn.1671-6647.2018.02.016 [10] Su Min, Yao Peng, Wang Z B, et al. Tidal wave propagation in the Yellow Sea[J]. Coastal Engineering Journal, 2015, 57(3): 150008. [11] 侍茂崇. 物理海洋学[M]. 济南: 山东教育出版社, 2004.Shi Maochong. Physical Oceanography[M]. Ji’nan: Shandong Education Press, 2004. [12] 章卫胜, 宋志尧, 张金善, 等. 中国近海潮波运动特征分析[M]//第十二届中国海岸工程学术研讨会论文集. 北京: 中国海洋工程学会, 2005.Zhang Weisheng, Song Zhiyao, Zhang Jinshan, et al. Analysis on the characteristics of tide wave movement in China’s Offshore Sea[C]//Proceedings of the 12th China Coastal Engineering Symposium. Beijing: Chinese Society of Ocean Engineering, 2005. [13] 沈育疆. 东中国海潮汐数值计算[J]. 山东海洋学院学报, 1980, 10(3): 26−35.Shen Yujiang. Numerical computation of tides in the East China Sea[J]. Journal of Shandong College of Oceanology, 1980, 10(3): 26−35. [14] 沈育疆, 黄岱岩. 试释黄海半日潮波系统形成机制[J]. 海洋学报, 1993, 15(6): 16−24.Shen Yujiang, Huang Daiyan. A tentative interpretation of the formation mechanism of the semidiurnal tidal wave system in the Yellow Sea[J]. Haiyang Xuebao, 1993, 15(6): 16−24. [15] 金宇豪. 基于GOCI的辐射沙脊群海表流场遥感分析[J]. 地理空间信息, 2017, 15(9): 37−40. doi: 10.3969/j.issn.1672-4623.2017.09.013Jin Yuhao. Remote sensing analysis of sea surface flow field of radiation sand ridge group based on GOCI[J]. Geospatial Information, 2017, 15(9): 37−40. doi: 10.3969/j.issn.1672-4623.2017.09.013 [16] Chen Jian, Chen Jianyu, Cao Zhengyi, et al. Improving surface current estimation from geostationary ocean color imager using tidal ellipse and angular limitation[J]. Journal of Geophysical Research: Oceans, 2019, 124(6): 4322−4333. doi: 10.1029/2019JC015027 [17] 熊学军. 中国近海海洋[M]. 北京: 海洋出版社, 2012.Xiong Xuejun. China Offshore Ocean[M]. Beijing: China Ocean Press, 2012. [18] Hsueh Y. Recent current observations in the eastern Yellow Sea[J]. Journal of Geophysical Research: Oceans, 1988, 93(C6): 6875−6884. doi: 10.1029/JC093iC06p06875 [19] Teague W J, Perkins H T, Hallock Z R, et al. Current and tide observations in the southern Yellow Sea[J]. Journal of Geophysical Research: Oceans, 1998, 103(C12): 27783−27793. doi: 10.1029/98JC02672 [20] 于华明, 鲍献文, 朱学明, 等. 夏季北黄海南部定点高分辨率实测海流分析[J]. 海洋学报, 2008, 30(4): 12−20.Yu Huaming, Bao Xianwen, Zhu Xueming, et al. Analysis of the high-resolution observed current data in the southern area of the North Huanghai Sea in summer[J]. Haiyang Xuebao, 2008, 30(4): 12−20. [21] Zang J, Tang Yuxiang, Zou Emei, et al. Analysis of Yellow Sea circulation[J]. Chinese Science Bulletin, 2003, 48(S1): 12−20. doi: 10.1007/BF02900935 [22] 郭炳火. 黄海物理海洋学的主要特征[J]. 黄渤海海洋, 1993, 11(3): 7−18.Guo Binghuo. Major features of the physical oceanography in the Yellow Sea[J]. Journal of Oceanography of Huanghai & Bohai Seas, 1993, 11(3): 7−18. [23] 王波, 李民, 刘世萱, 等. 海洋资料浮标观测技术应用现状及发展趋势[J]. 仪器仪表学报, 2014, 35(11): 2401−2414.Wang Bo, Li Min, Liu Shixuan, et al. Current status and trend of ocean data buoy observation technology applications[J]. Chinese Journal of Scientific Instrument, 2014, 35(11): 2401−2414. [24] 王军成. 海洋资料浮标原理与工程[M]. 北京: 海洋出版社, 2013.Wang Juncheng. Principle and Engineering of Ocean Data Buoy[M]. Beijing: China Ocean Press, 2013. [25] Hu Zifeng, Pan Delu, He Xianqiang, et al. Assessment of the MCC method to estimate sea surface currents in highly turbid coastal waters from GOCI[J]. International Journal of Remote Sensing, 2017, 38(2): 572−597. doi: 10.1080/01431161.2016.1268737 [26] Lou Xiulin, Shi Aiqin, Zhang Huaguo. Coastal sea surface current observation with GOCI imagery[C]//Proceedings of SPIE 8921, MIPPR 2013: Remote Sensing Image Processing, Geographic Information Systems, and Other Applications. Wuhan: SPIE, 2013. [27] Padman L, Erofeeva S. Tide model driver (TMD) manual[Z/OL]. [2021−11−20]. www.esr.org/polar_tide_models/README_TMD.pdf. [28] Ryu J H, Han H J, Cho S, et al. Overview of geostationary ocean color imager (GOCI) and GOCI data processing system (GDPS)[J]. Ocean Science Journal, 2012, 47(3): 223−233. doi: 10.1007/s12601-012-0024-4 [29] Barton I J. Ocean currents from successive satellite images: The reciprocal filtering technique[J]. Journal of Atmospheric and Oceanic Technology, 2002, 19(10): 1677−1689. doi: 10.1175/1520-0426(2002)019<1677:OCFSSI>2.0.CO;2 [30] Sun Hequan, Song Qingtao, Shao Ruoli, et al. Estimation of sea surface currents based on ocean colour remote-sensing image analysis[J]. International Journal of Remote Sensing, 2016, 37(21): 5105−5121. doi: 10.1080/01431161.2016.1226526 [31] Chen Wei. Surface velocity estimation from satellite imagery using displaced frame central difference equation[J]. IEEE Transactions on Geoscience and Remote Sensing, 2012, 50(7): 2791−2801. doi: 10.1109/TGRS.2011.2176134 [32] 丁文兰. 渤海和黄海潮汐潮流分布的基本特征[M]//中国科学海洋研究所. 海洋科学集刊: 第 25 集. 北京: 科学出版社, 1985: 27-40.Ding Wenlan. Basic characteristics of tidal current distribution in Bohai Sea and Yellow Sea[M]//China Institute of Oceanography. Anthology of Marine Science: Episode 25. Beijing: Science Press, 1985: 27−40. [33] 陈宗镛. 潮汐学[M]. 北京: 科学出版社, 1980.Chen Zongyong. Tidal Science[M]. Beijing: Science Press, 1980. [34] 苏纪兰. 中国近海的环流动力机制研究[J]. 海洋学报, 2001, 23(4): 1−16.Su Jilan. A review of circulation dynamics of the coastal oceans near China[J]. Haiyang Xuebao, 2001, 23(4): 1−16. [35] Yuan Dongliang, Li Yao, Wang Bin, et al. Coastal circulation in the southwestern Yellow Sea in the summers of 2008 and 2009[J]. Continental Shelf Research, 2017, 143: 101−117. doi: 10.1016/j.csr.2017.01.022 [36] 李豪, 何贤强, 陶邦一, 等. 大太阳天顶角下水色卫星叶绿素遥感探测能力研究[J]. 海洋学报, 2018, 40(11): 128−140.Li Hao, He Xianqiang, Tao Bangyi, et al. Research on chlorophyll detection ability under high solar zenith angle[J]. Haiyang Xuebao, 2018, 40(11): 128−140. [37] Yang Haoping, Arnone R, Jolliff J. Estimating advective near-surface currents from ocean color satellite images[J]. Remote Sensing of Environment, 2015, 158: 1−14. doi: 10.1016/j.rse.2014.11.010 -

计量
- 文章访问数: 914
- HTML全文浏览量: 383
- PDF下载量: 91
- 被引次数: 0
