

A refined imagery algorithm to extract green tide in the Yellow Sea from HY-1C satellite CZI measurements
-
摘要: 海洋一号C(HY-1C)卫星是中国首颗海洋水色业务卫星,其搭载的海岸带成像仪(CZI)在近海海洋环境监测中正发挥越来越重要的作用;随着搭载有相同传感器的HY-1D卫星发射,双星组网观测,可形成3天2次的高频次、大范围对海观测能力,在海洋漂浮藻类、海洋溢油等目标探测方面具备优异的效能。高空间分辨率光学数据中包含了丰富的海洋环境信息,给特定目标的识别提取带来一定干扰。本研究面向HY-1C卫星CZI载荷开展中国近海漂浮藻类识别提取的业务化应用需求,发展基于藻类缩放指数与虚拟基线高度融合的海洋漂浮藻类识别提取算法,算法优选适用于无短波红外波段国产数据的虚拟基线高度指数来增强藻类信号,通过藻类缩放指数滑动窗口运算,有效剔除高空间分辨率光学数据中的复杂干扰信息,实现了基于CZI数据的海洋漂浮藻类高精度提取,且具有较好的计算运行效率。此外,结合准同步高分卫星16 m多光谱数据,开展CZI数据含藻像元的不确定性分析,发现CZI数据反演结果对近海小斑块漂浮藻类存在不可忽视的高估现象。研究还指出,光学数据用于漂浮藻类监测,其不确定性不仅来源于传感器的空间分辨率差异,还与海洋漂浮藻类形态特征的空间分异性有关。明晰海洋漂浮藻类的形态学空间分异特征,将有助于提高光学数据反演结果的精度,并阐明不确定性。Abstract: As China’s first operational ocean color sensor, the coastal zone imager (CZI) carried by Haiyang-1C (HY-1C) satellite is playing an increasingly significant role in offshore ocean environmental monitoring. After the launch of HY-1D satellite, the combination of CZI sensors can provide two observations in three days for coastal zone through dual-satellite system. CZI sensors have demonstrated prominent application advantages for monitoring marine floating algae, oil spill and so on. Since the high spatial resolution optical data contains abundant information about the marine environment, it also brings some distraction to the identification and extraction of specific ocean targets. In this work, a novel CZI algorithm was developed based on cooperation of scaled algae index (SAI) and virtual baseline floating macroalgae height (VB-FAH) to extract floating green tide information in the Yellow Sea from HY-1C satellite CZI measurements. VB-FAH method can be used to enhance the difference between floating algae and sea water, especially for satellite’s sensors with no short-wave infrared bands. After that, the algorithm efficiently rejects the complex interference information in the ocean high spatial resolution optical data by SAI sliding window. The algorithm has high accuracy and time efficiency in the extraction of floating green tide from CZI measurements. Moreover, the study carried out an uncertainty analysis for the area of algae-containing pixels between HY-1C satellite CZI data with 50 m spatial resolution and GF-1 satellite WFV1 data with 16 m spatial resolution. The result indicates that the uncertainty in the inversion results of CZI data mainly comes from the over estimation of small patches of floating algae. The study also pointed out that the uncertainty of optical data for floating algae monitoring is not only from the difference of spatial resolution between two sensors, but also related to the spatial variability of the morphological size of floating algae. Exploring the morphological spatial variability of floating algae will help improve the accuracy of optical data inversion results and clarify the uncertainty.
-

图 1 2019年黄海大型漂浮藻类标准假彩色影像
HY-1C卫星CZI数据,R: 825 nm,G: 650 nm,B: 560 nm
Fig. 1 Standard false color images of macroalgae in the Yellow Sea during 2019
Data from HY-1C satellite CZI, R: 825 nm, G: 650 nm, B: 560 nm

图 2 滑动窗口尺寸变化下的缩放藻类指数图像
a. 研究区RGB合成图像(R: 825 nm, G: 650 nm, B: 560 nm);b, c, d中漂浮藻类斑块大小差异显著,其中红色框表示该区域的最佳滤波窗口尺寸
Fig. 2 Scaled algae index images with changing size of sliding window
a. Red-Green-Blue composite image by bands 4 (R, 825 nm), 3 (G, 650 nm) and 2 (B, 560 nm) in study area. Floating algal patches in b, c, d show significant differences in size. The red box in b, c and d indicate the optimal sliding window size for the region
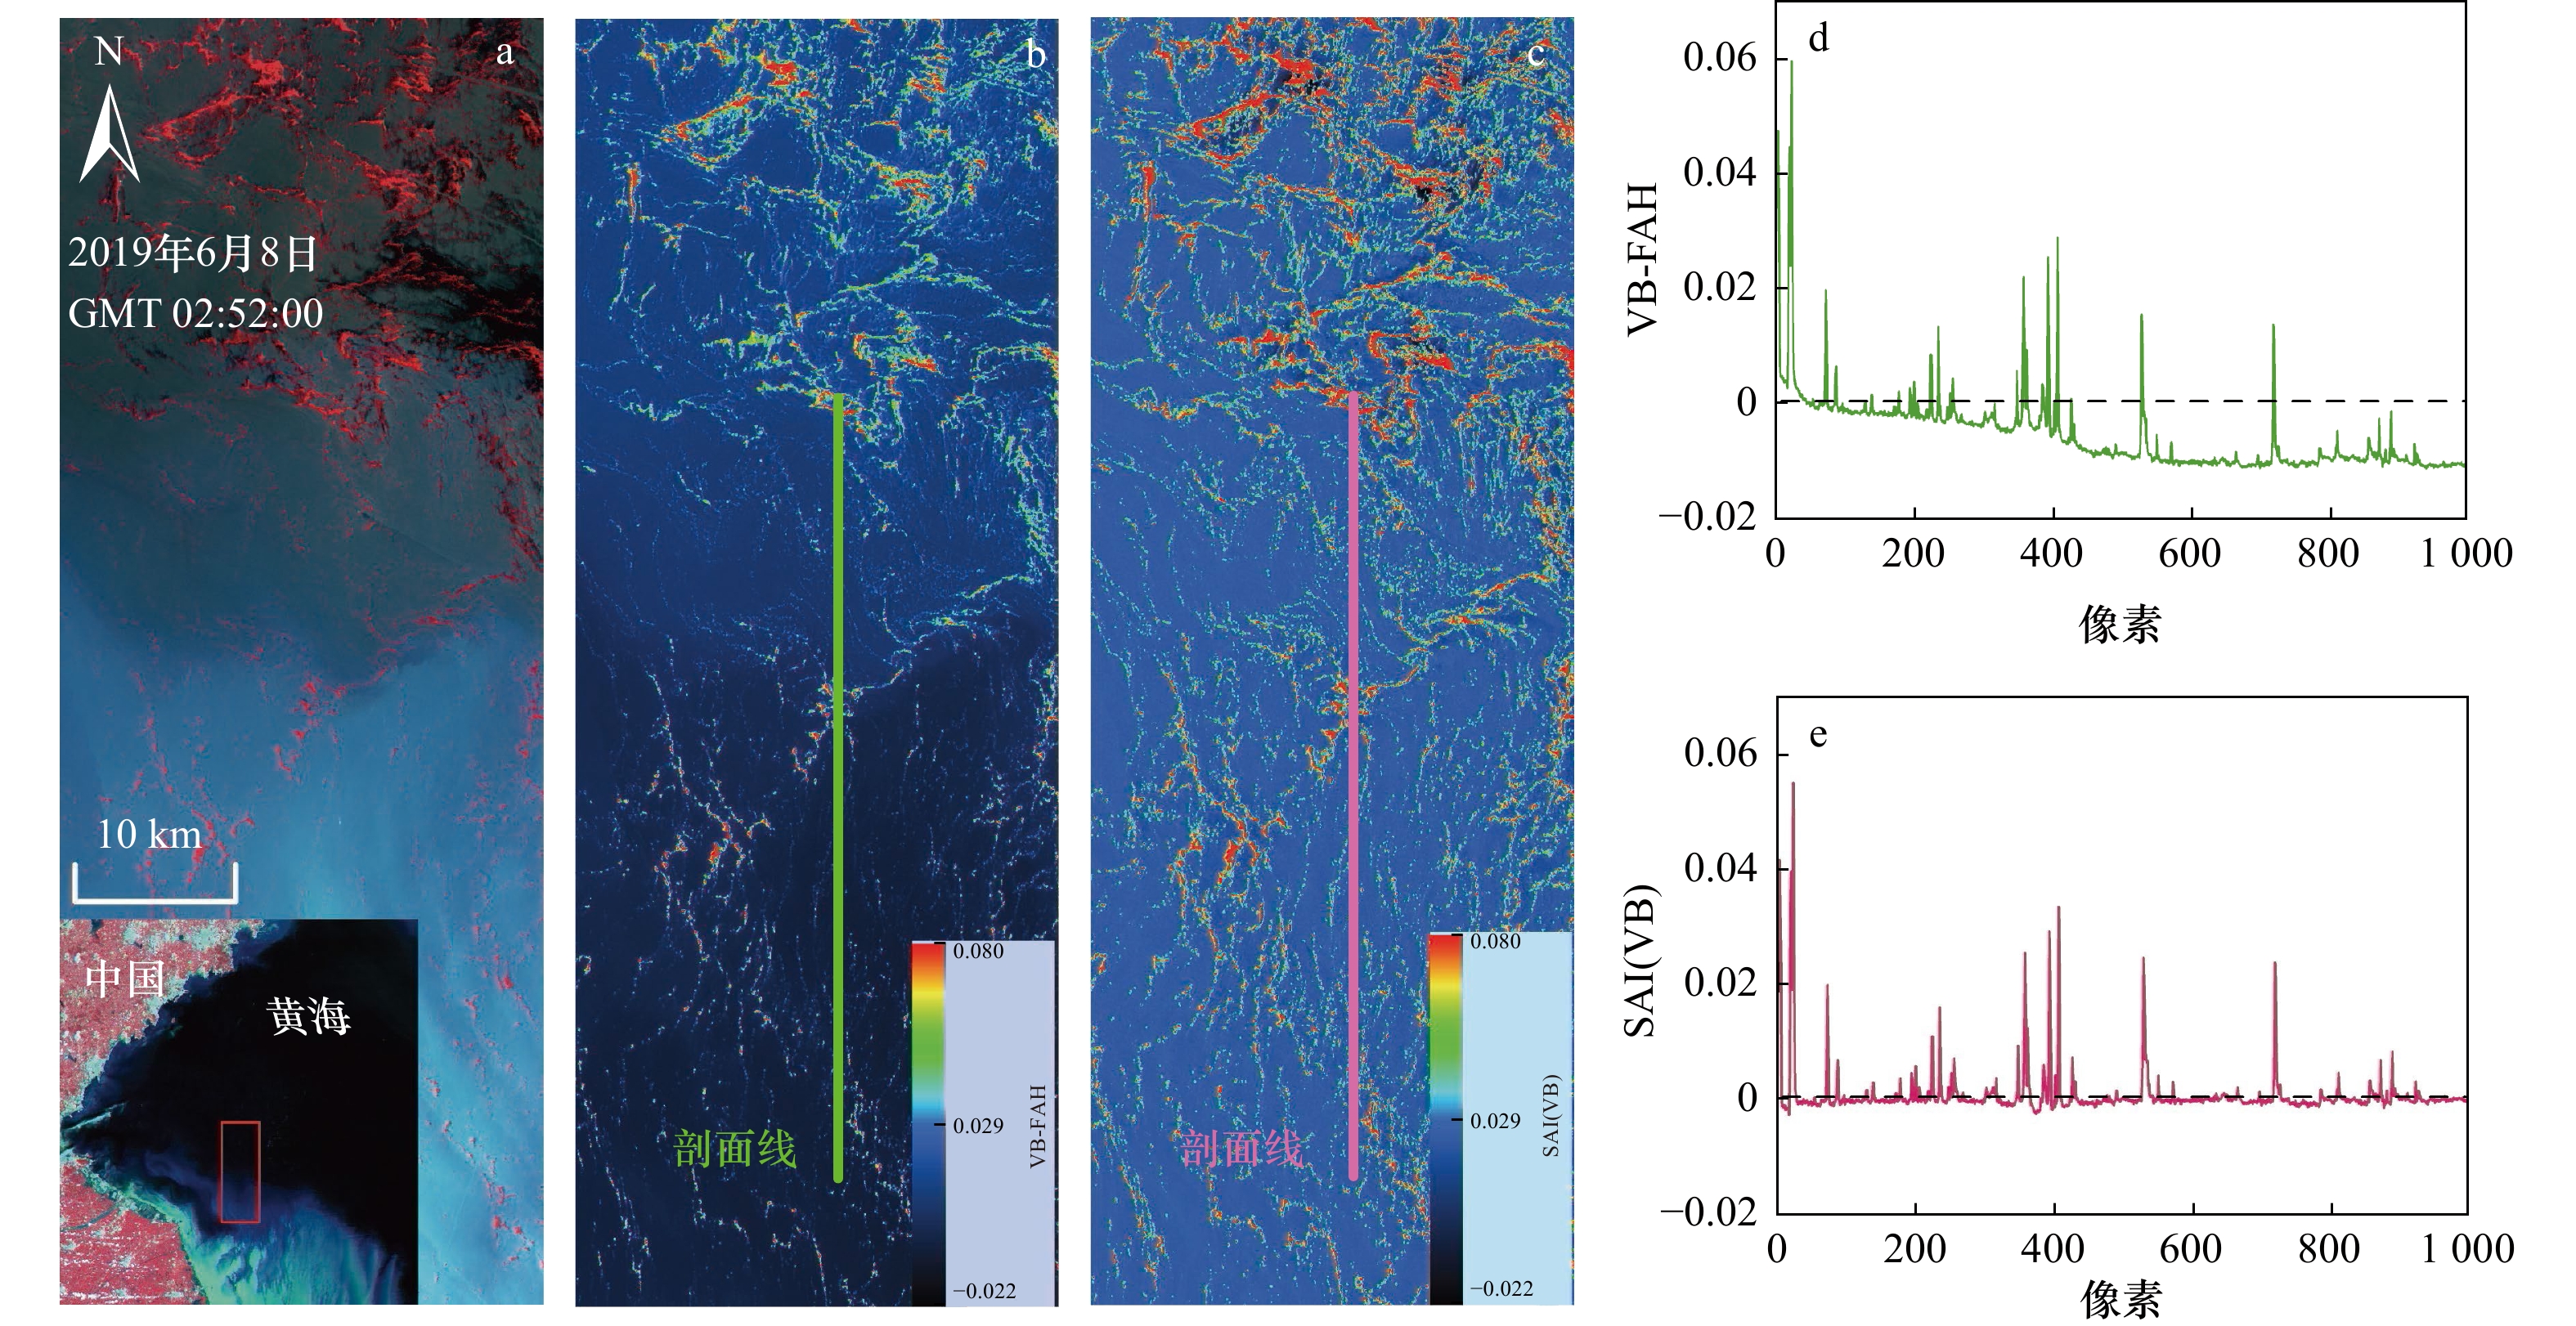
图 3 大型漂浮藻类虚拟基线高度法(VB-FAH)与对VB-FAH图像经过缩放藻类指数计算后值(SAI(VB))对比图
a. 2019年6月8日HY-1C卫星CZI传感器RGB合成影像(R: 825 nm, G: 650 nm, B: 560 nm);b. 大型漂浮藻类虚拟基线高度法图;c. SAI (VB)指数图;d. VB-FAH垂直剖面;e. SAI (VB)垂直剖面
Fig. 3 Comparison between virtual baseline floating macroalgae height (VB-FAH) and SAI (VB)
a. HY-1C/CZI Red-Green-Blue composite image by bands 4 (R, 825 nm), 3 (G, 650 nm) and 2 (B, 560 nm) acquired on June 8, 2019; b. image of VB-FAH; c. image of SAI (VB); d. vertical profile of VB-FAH; e. vertical profile of SAI (VB)

图 4 基于SAI(RED)的小云斑干扰信息的剔除
Fig. 4 Elimination for confusion signal of cloud spots based on SAI (RED)

图 5 海面目标误判信息剔除与修正结果
Fig. 5 Results of elimination and correction for misclassification of sea surface targets

图 6 基于HY-1C星CZI数据提取的2019年海面漂浮绿潮
图中“面积”表示含藻像元面积
Fig. 6 The information of floating green tides in 2019 extracted from HY-1C CZI measurements
The “area” in the figure represents the area of algae-containing pixels

图 7 感兴趣区域内人工解译结果与算法提取结果的对比分析
Fig. 7 Comparative study between manual interpretation and algorithm extraction within the regions of interest
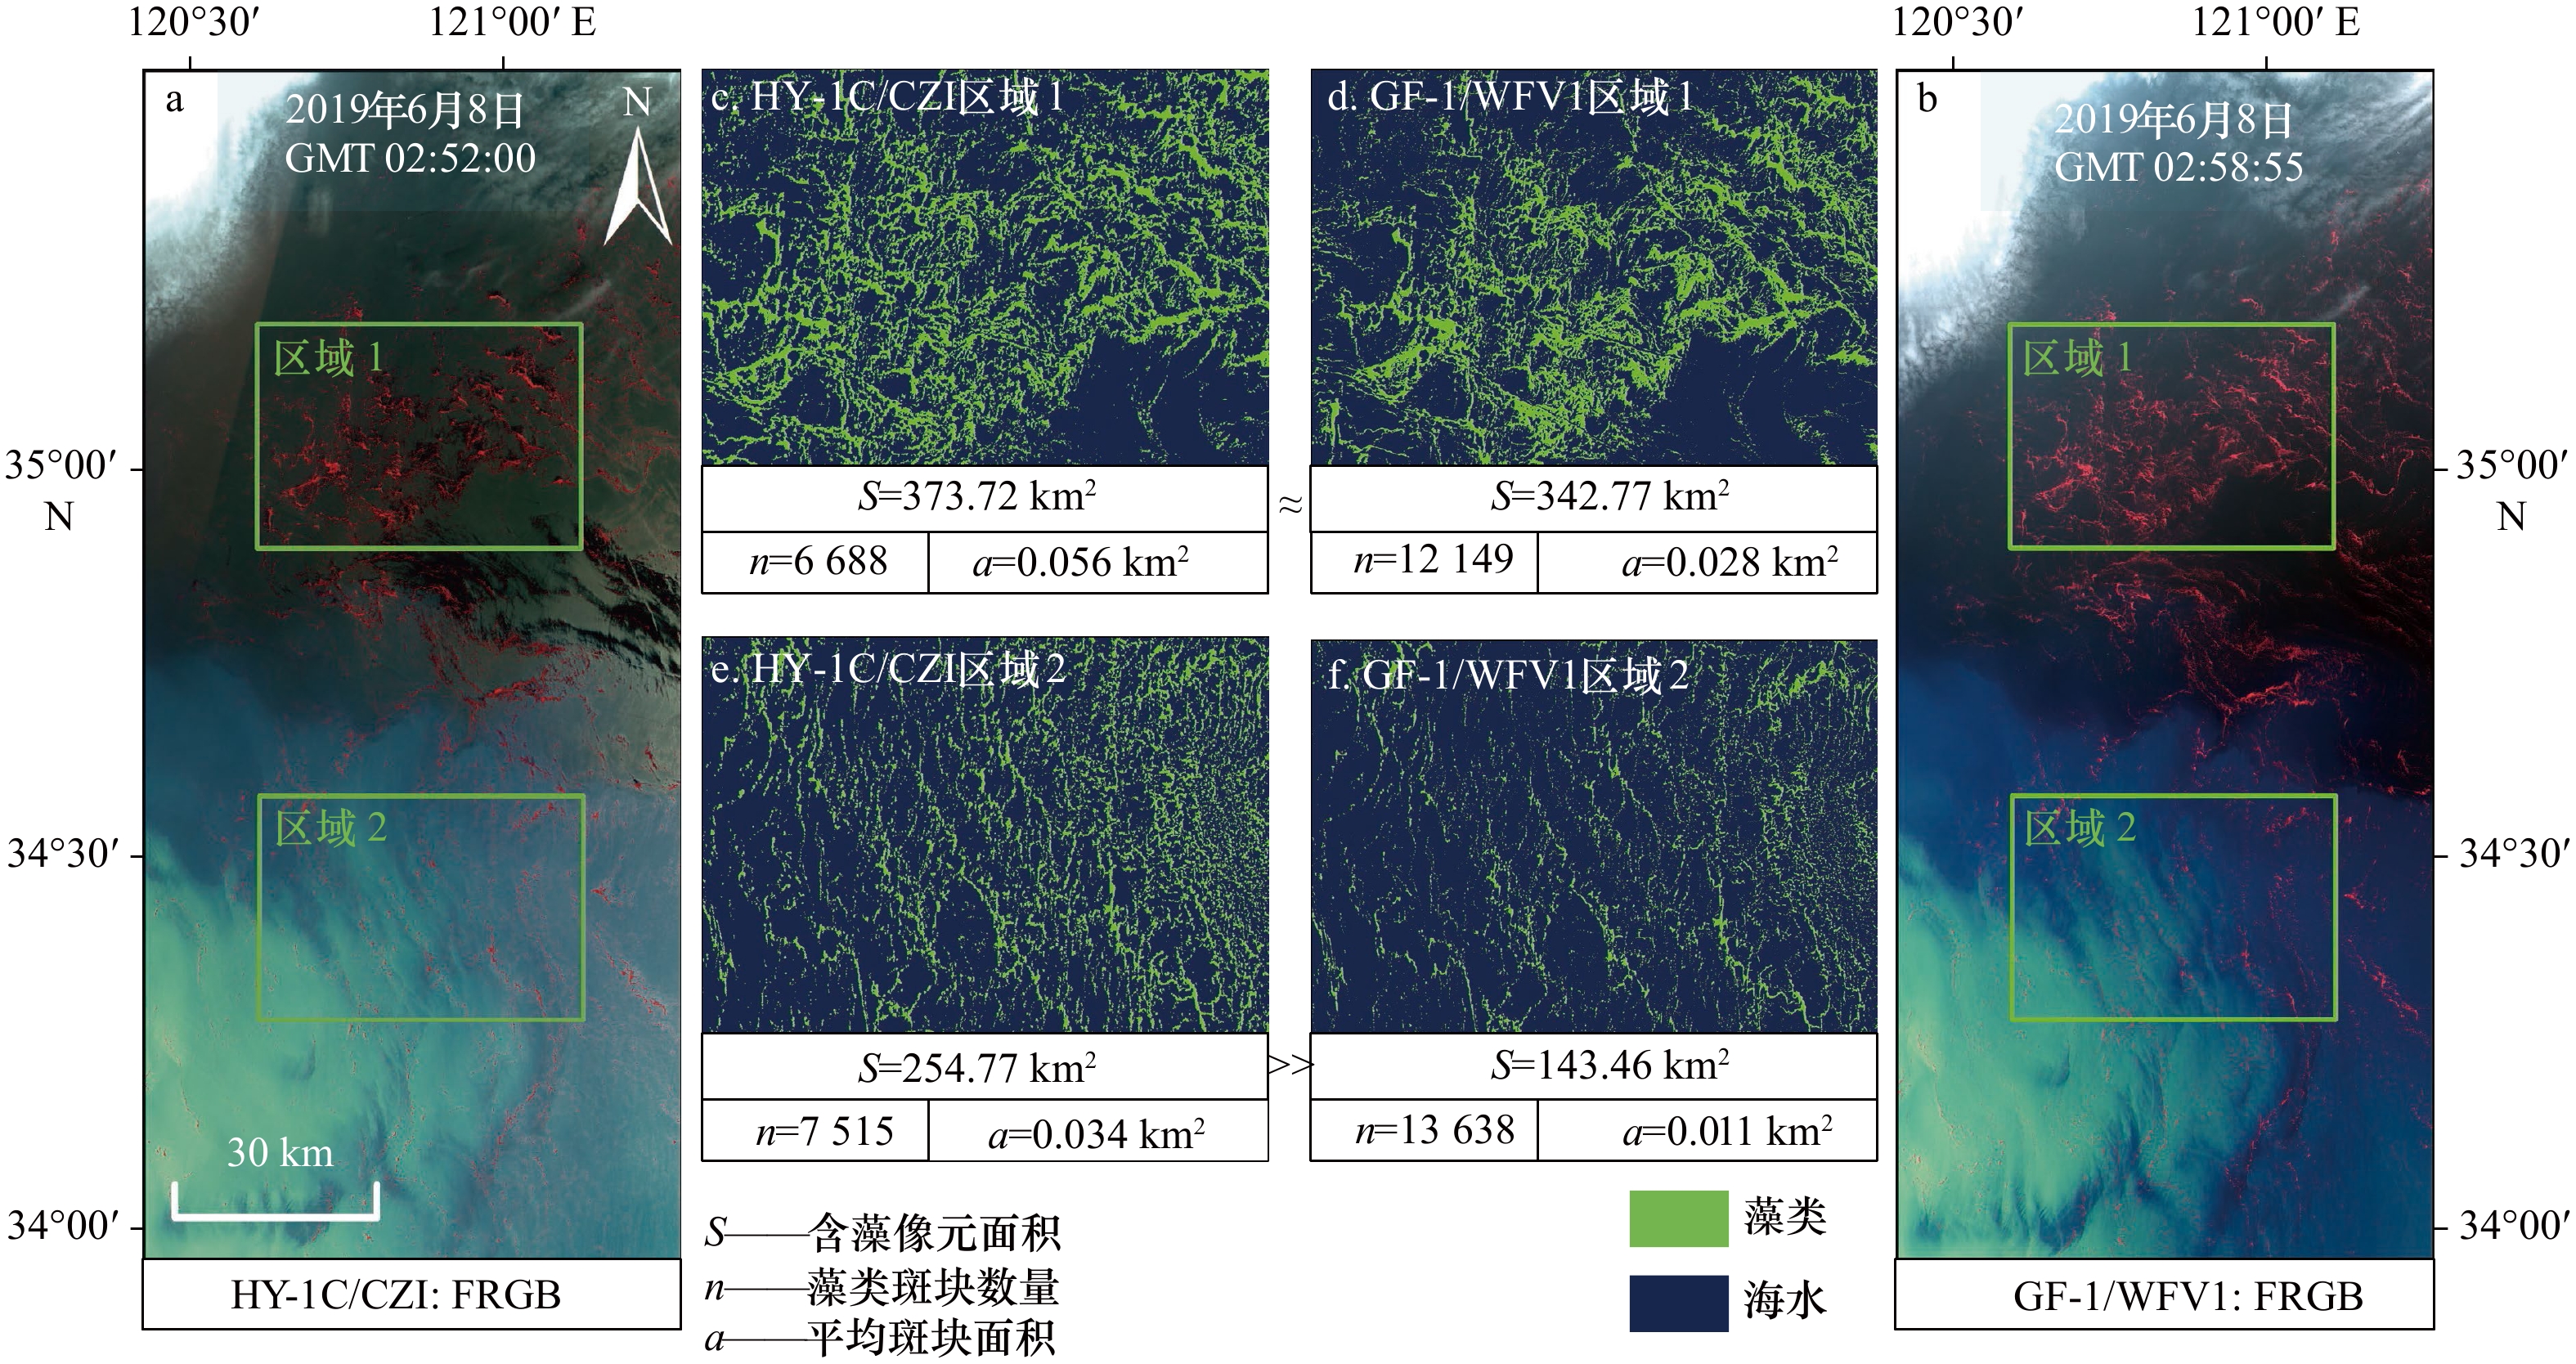
图 8 2019年6月8日HY-1C/CZI和GF-1/WFV1准同步数据反演结果比较
Fig. 8 Comparison of inversion results between image of HY-1C/CZI and quasi-synchronous image of GF-1/WFV1 on June 8, 2019
表 1 精度评价
Tab. 1 Accuracy evaluation
区域编号 人工解译/像元数 算法提取/像元数 λ/% 1 126 907 125 600 1.03 2 104 782 97 021 2.37 3 94 963 92 345 2.76 4 68 722 74 452 8.34  下载: 导出CSV
-
[1] Nelson T A, Haberlin K, Nelson A V, et al. Ecological and physiological controls of species composition in green macroalgal blooms[J]. Ecology, 2008, 89(5): 1287−1298. doi: 10.1890/07-0494.1 [2] Ye Naihao, Zhang Xiaowen, Mao Yuze, et al. ‘Green tides’ are overwhelming the coastline of our blue planet: taking the world’s largest example[J]. Ecological Research, 2011, 26(3): 477−485. doi: 10.1007/s11284-011-0821-8 [3] Wang X H, Li L, Bao X, et al. Economic cost of an algae bloom cleanup in China’s 2008 Olympic sailing venue[J]. Eos, Transactions American Geophysical Union, 2009, 90(28): 238−239. doi: 10.1029/2009EO280002 [4] Li Hongmei, Zhang Yongyu, Tang Hongjie, et al. Spatiotemporal variations of inorganic nutrients along the Jiangsu coast, China, and the occurrence of macroalgal blooms (green tides) in the southern Yellow Sea[J]. Harmful Algae, 2017, 63: 164−172. doi: 10.1016/j.hal.2017.02.006 [5] Liu Dongyan, Keesing J K, Dong Zhijun, et al. Recurrence of the world’s largest green-tide in 2009 in Yellow Sea, China: Porphyra yezoensis aquaculture rafts confirmed as nursery for macroalgal blooms[J]. Marine Pollution Bulletin, 2010, 60(9): 1423−1432. doi: 10.1016/j.marpolbul.2010.05.015 [6] Liu Dongyan, Keesing J K, Xing Qianguo, et al. World’s largest macroalgal bloom caused by expansion of seaweed aquaculture in China[J]. Marine Pollution Bulletin, 2009, 58(6): 888−895. doi: 10.1016/j.marpolbul.2009.01.013 [7] Liu Dongyan, Keesing J K, He Peimin, et al. The world’s largest macroalgal bloom in the Yellow Sea, China: formation and implications[J]. Estuarine, Coastal and Shelf Science, 2013, 129: 2−10. doi: 10.1016/j.ecss.2013.05.021 [8] Zhang Xiaowen, Mao Yuze, Zhuang Zhimeng, et al. Morphological characteristics and molecular phylogenetic analysis of green tide Enteromorpha sp. occurred in the Yellow Sea[J]. Journal of Fishery Sciences of China, 2008, 15(5): 822−829. [9] Liang Zongying, Lin Xiangzhi, Ma Mu, et al. A preliminary study of the Enteromorpha prolifera drift gathering causing the green tide phenomenon[J]. Periodical of Ocean University of China, 2008, 38(4): 601−604. [10] Gower J, Hu Chuanmin, Borstad G, et al. Ocean color satellites show extensive lines of floating Sargassum in the gulf of Mexico[J]. IEEE Transactions on Geoscience and Remote Sensing, 2006, 44(12): 3619−3625. doi: 10.1109/TGRS.2006.882258 [11] Hu Chuanmin, Li Daqiu, Chen Changsheng, et al. On the recurrent Ulva prolifera blooms in the Yellow Sea and East China Sea[J]. Journal of Geophysical Research: Oceans, 2010, 115(C5): C05017. [12] Hu Chuanmin, He Mingxia. Origin and offshore extent of floating algae in Olympic sailing area[J]. Eos, Transactions American Geophysical Union, 2008, 89(33): 302−303. doi: 10.1029/2008EO330002 [13] Hu Lianbo, Zeng Kan, Hu Chuanmin, et al. On the remote estimation of Ulva prolifera areal coverage and biomass[J]. Remote Sensing of Environment, 2019, 223: 194−207. doi: 10.1016/j.rse.2019.01.014 [14] Shi Wei, Wang Menghua. Green macroalgae blooms in the Yellow Sea during the spring and summer of 2008[J]. Journal of Geophysical Research: Oceans, 2009, 114(C12): C12010. doi: 10.1029/2009JC005513 [15] Hu Chuanmin. A novel ocean color index to detect floating algae in the global oceans[J]. Remote Sensing of Environment, 2009, 113(10): 2118−2129. doi: 10.1016/j.rse.2009.05.012 [16] Xing Qianguo, Hu Chuanmin. Mapping macroalgal blooms in the Yellow Sea and East China Sea using HJ-1 and Landsat data: Application of a virtual baseline reflectance height technique[J]. Remote Sensing of Environment, 2016, 178: 113−126. doi: 10.1016/j.rse.2016.02.065 [17] Keesing J K, Liu Dongyan, Fearns P, et al. Inter-and intra-annual patterns of Ulva prolifera green tides in the Yellow Sea during 2007–2009, their origin and relationship to the expansion of coastal seaweed aquaculture in China[J]. Marine Pollution Bulletin, 2011, 62(6): 1169−1182. doi: 10.1016/j.marpolbul.2011.03.040 [18] Wang Mengqiu, Hu Chuanmin. Mapping and quantifying Sargassum distribution and coverage in the Central West Atlantic using MODIS observations[J]. Remote Sensing of Environment, 2016, 183: 350−367. doi: 10.1016/j.rse.2016.04.019 [19] Garcia R A, Fearns P, Keesing J K, et al. Quantification of floating macroalgae blooms using the scaled algae index[J]. Journal of Geophysical Research: Oceans, 2013, 118(1): 26−42. doi: 10.1029/2012JC008292 [20] Gordon H R, Wang Menghua. Retrieval of water-leaving radiance and aerosol optical thickness over the oceans with SeaWiFS: a preliminary algorithm[J]. Applied Optics, 1994, 33(3): 443−452. doi: 10.1364/AO.33.000443 [21] Wang Menghua. Remote sensing of the ocean contributions from ultraviolet to near-infrared using the shortwave infrared bands: simulations[J]. Applied Optics, 2007, 46(9): 1535−1547. doi: 10.1364/AO.46.001535 [22] Qi Lin, Hu Chuanmin, Mikelsons K, et al. In search of floating algae and other organisms in global oceans and lakes[J]. Remote Sensing of Environment, 2020, 239: 111659. doi: 10.1016/j.rse.2020.111659 [23] Qi Lin, Hu Chuanmin. To what extent can Ulva and Sargassum be detected and separated in satellite imagery?[J]. Harmful Algae, 2021, 103: 102001. doi: 10.1016/j.hal.2021.102001 -

计量
- 文章访问数: 1217
- HTML全文浏览量: 429
- PDF下载量: 151
- 被引次数: 0
