

Study on spatial-temporal distribution characteristics of tidal skewness in the Wenzhou Bay
-
摘要: 人类活动引起的岸线变化影响着近岸海域的潮波在传播过程中的运动特征。本研究基于瓯江口与乐清湾5个验潮站,时间跨度为1984−2019年的逐时潮位实测资料,分析了该海域潮波形态的时空变化规律并解构造成潮汐不对称性的主要分潮簇的贡献度。研究发现,温州湾海域瓯江河口与乐清湾潮形有明显的不同,潮汐不对称性在瓯江河口涨潮占优,且向上游方向持续增大,但在乐清湾内则落潮占优。该海域潮汐不对称性呈现出明显的季节性变化特征。在6−7月、12月至翌年1月时
$ \gamma $ 值达到最大。该海域潮汐不对称性主要由分潮组合M2/M4、M2/S2/MS4、M2/N2/MN4等分潮簇控制,分潮簇如M2/S2/MS4、M2/N2/MN4、O1/K1/M2的不对 称贡献度则表现出明显的季节性变化。从2000年起,温州湾海域涨潮占优的潮汐不对称性呈现逐渐减弱的趋势,这与瓯江河口频繁的海岸工程存在一定的联系。Abstract: The changes of shoreline caused by human activities affect the kinematic characteristics of tidal wave in the propagation process. Based on the hourly tidal level data from five tidal stations in the Wenzhou Bay from 1984 to 2019, the temporal and spatial variation of tidal wave patterns in this area and deconstructed the contribution of major tidal clusters to the tidal asymmetry is analyzed in this study . The results show that the tidal patterns in Oujiang Estuary and Yueqing Bay, two semi-enclosed embayments of the Wenzhou Bay, are obviously different. The tidal symmetry of Oujiang Estuary is flood-dominant tide and the tidal asymmetry increases continuously in the upstream direction, whilst tide is ebb-dominant in Yueqing Bay. Moreover, the tidal asymmetry shows distinct seasonal variation. The skewness ($ \gamma $ ) reaches maximum in June to July and December to January in the Wenzhou Bay. The tidal asymmetry in this area is mainly controlled by the component groups such as M2/M4, M2/S2/MS4 and M2/N2/MN4. The skewness caused by nonlinear interactions from M2/S2/MS4, M2/N2/MN4, O1/K1/M2 shows obvious seasonal variation. Since 2000, the tidal asymmetry of Wenzhou Bay has been decreasing, which is related to the frequent reclamation surrounding the Oujiang Estuary.-
Key words:
- tidal skewness /
- Wenzhou Bay /
- tidal clusters /
- shoreline changes /
- seasonal variability /
- yearly variability /
- flood-dry seasons
-

图 2 各测站2019年2−3月份潮位、潮差及偏度
Fig. 2 Tidal level, tidal range and skewness at each station during February to March of 2019

图 3 2019年各测站年内月均偏度变化(a)、温州站1984−2019年期间月均偏度值(b)和1984−2019年期间温州湾海域岸线变动(c)
Fig. 3 Tidal skewness annual variability at each station in 2019 (a), monthly-mean of tidal skewness at Wenzhou Station from 1984 to 2019 (b), and coastline changes from 1984 to 2019 (c)

图 4 2019年各测站主要分潮振幅(a)和温洲站1984−2019年主要分潮振幅(b)
Fig. 4 The amplitude of main tidal constituent at each station during 2019 (a) and the amplitude of main tidal constituent at Wenzhou Station from 1984 to 2019 (b)

图 5 2019年温州海域每月总降雨量(a)、2019年各测站枯汛期偏度比较(b)和温州站历年枯汛期偏度比较(c)
Fig. 5 Precipitation over year 2019 in Wenzhou waters (a), scatter plots of tidal skewness in flooding season vs. dry season at different stations (b) and scatter plots of tidal skewness in flooding season vs. dry season at Wenzhou Station for different years (c)

图 6 2019年各测站最主要3大分潮簇对潮汐不对称性的贡献度月际变化
a. 测站年均β值最大的分潮组合;b. 测站年均β值第二的分潮组合;c. 测站年均β值第三的分潮组合
Fig. 6 Monthly variability of the contribution to tidal duration asymmetry from the top three primary combinations of tidal constituents at each station in 2019
a. The tidal combination with the largest annual average β value of the station; b. the tidal combination with the second annual average β value of the station; c. the third tidal combination with the third annual average β value of the station

图 7 2019年各测站3大分潮簇对潮汐不对称性的月均贡献度与年均贡献度比值
a. 测站年均β值最大的分潮组合;b. 测站年均β值第二的分潮组合;c. 测站年均β值第三的分潮组合
Fig. 7 The ratio of monthly contribution to tidal duration asymmetry over annual contribution to tidal duration asymmetry by the top three primary combinations of tidal constituents at each station in 2019
a. The tidal combination with the largest annual average β value of the station; b. the tidal combination with the second annual average β value of the station; c. the third tidal combination with the third annual average β value of the station

图 8 温州站与龙湾站不同年份的主要分潮组合对潮汐不对称性的贡献度和占总不对称性指标权重
Fig. 8 Contributions and weights to tidal duration asymmetry by primary combinations of tidal constituents at Wenzhou Station and Longwan Station of varied years
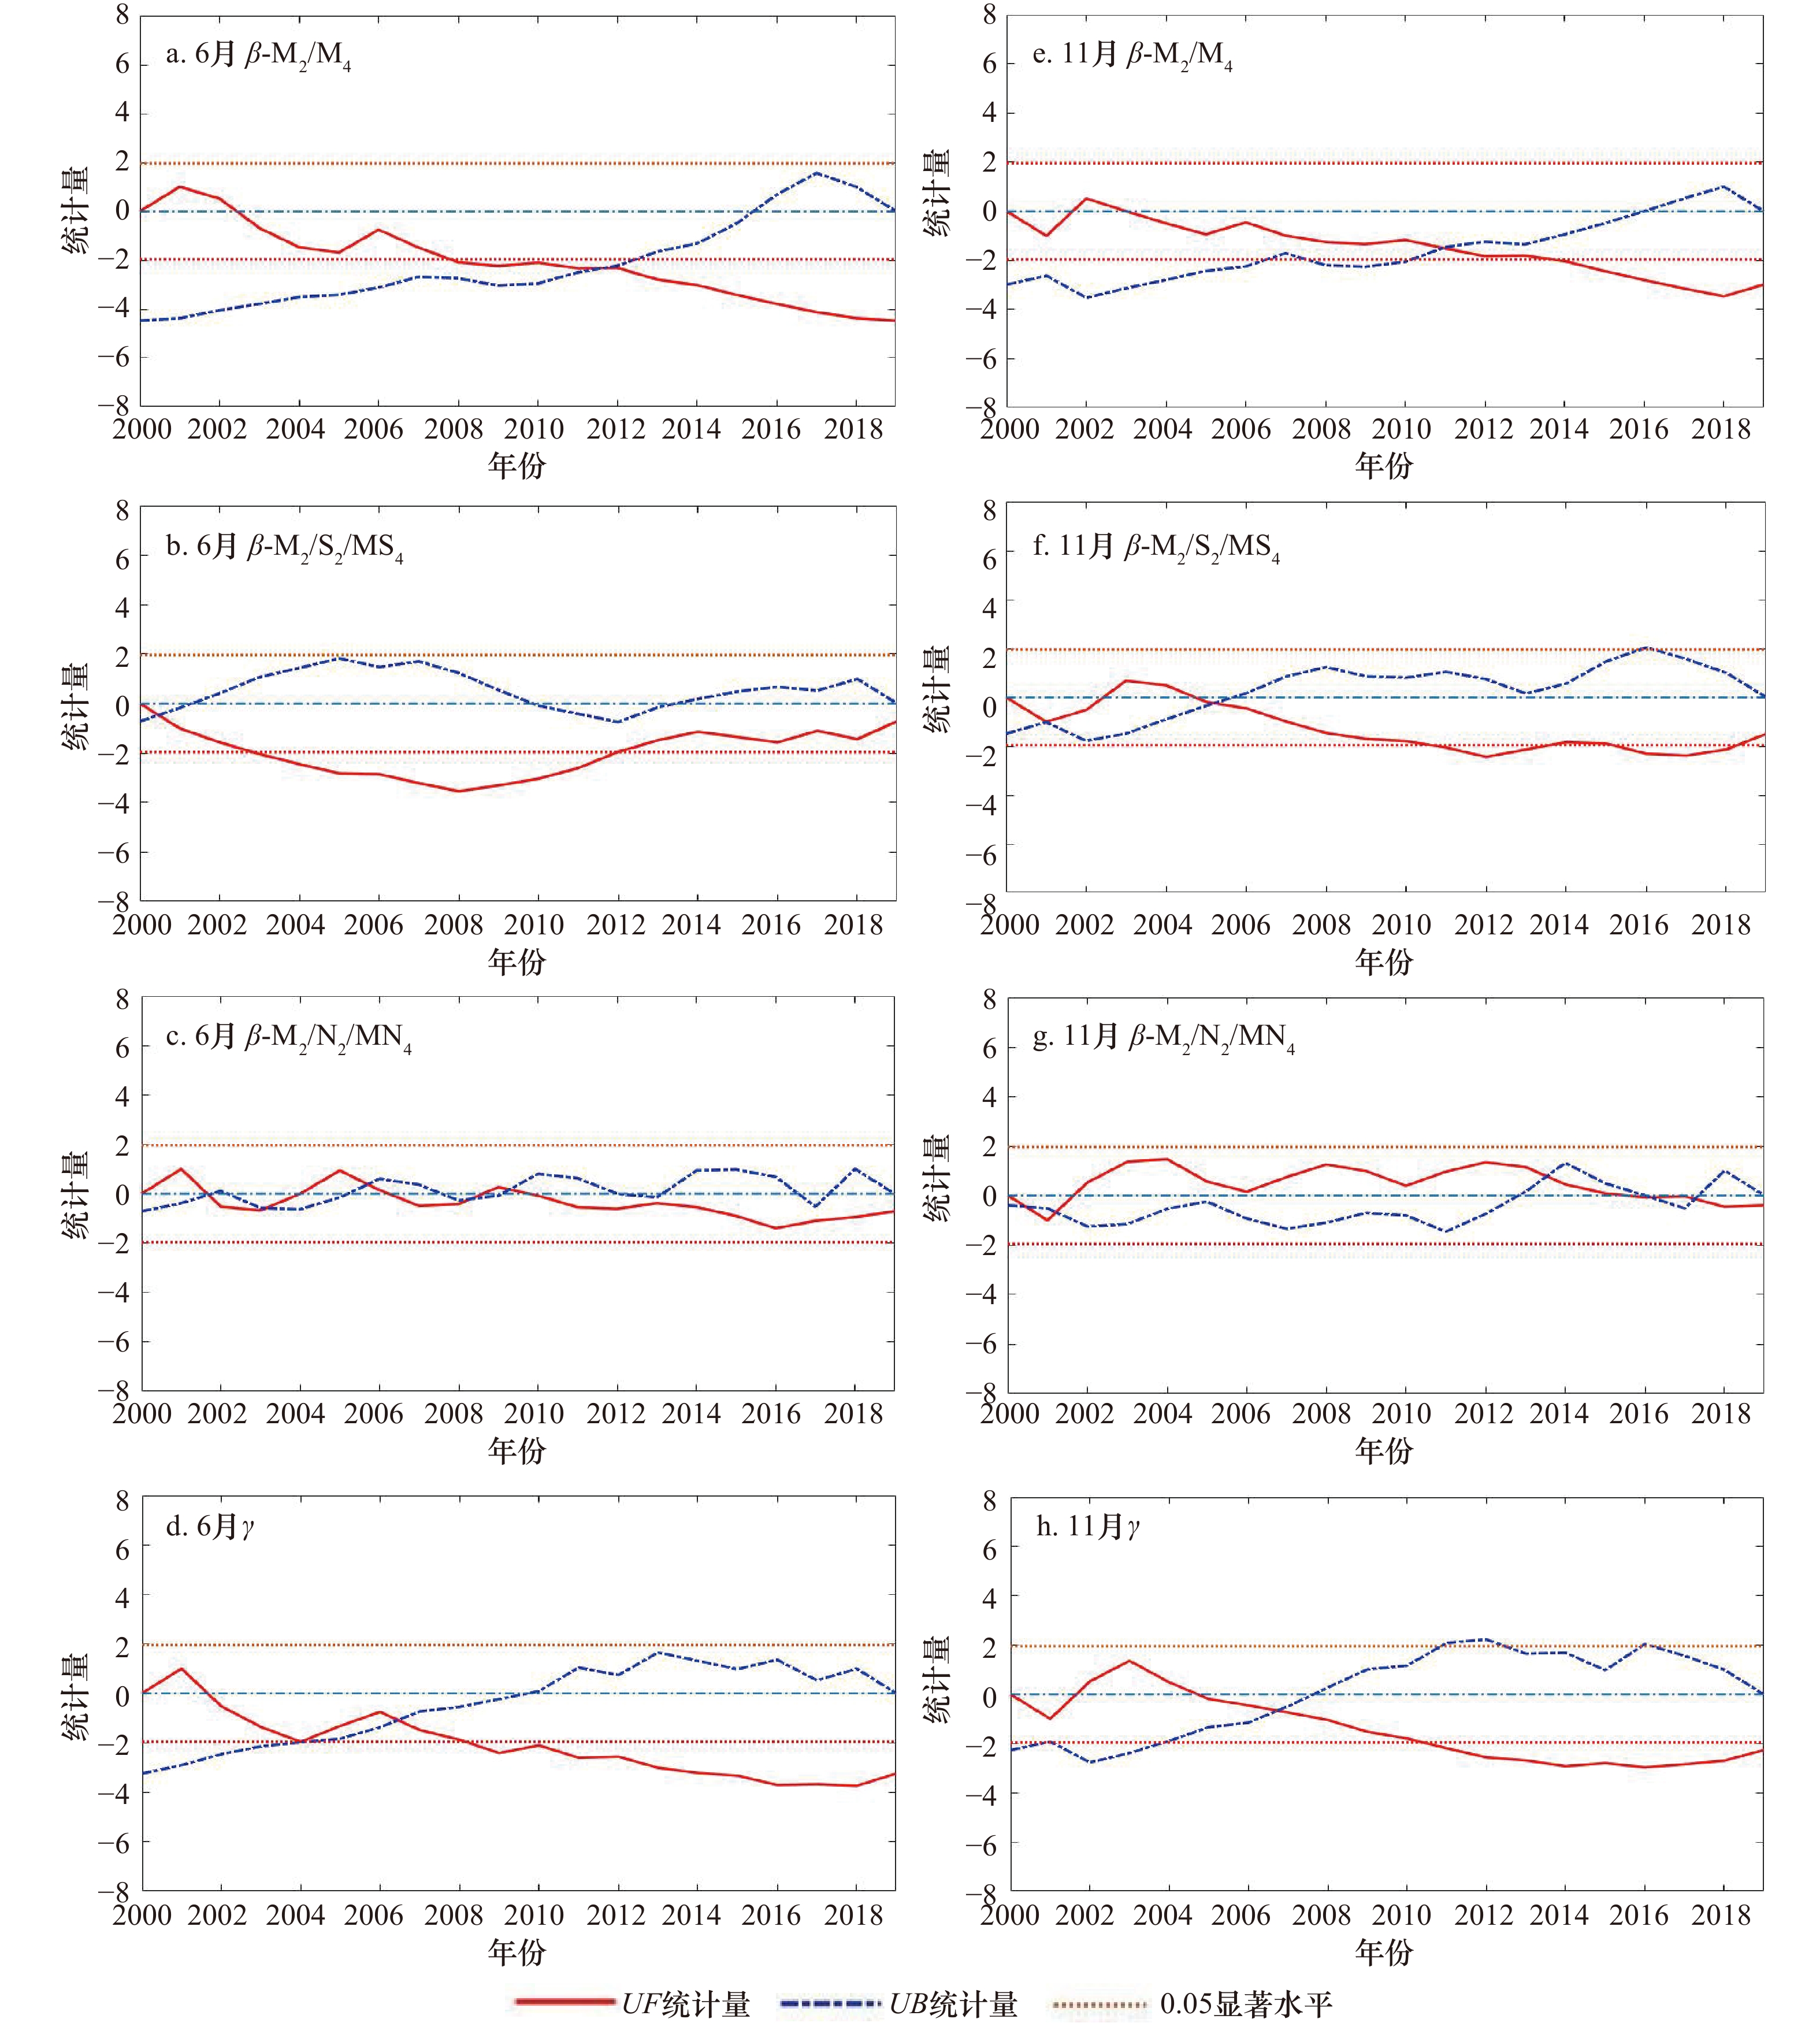
图 9 温州站 2000−2019 年典型月份主要分潮簇对潮汐不对称性的贡献β值及偏态指标γ值 Mann-Kendall 跃变检验结果
Fig. 9 Test result of Mann-Kendall break of contribution to tidal duration asymmetry from the primary combinations of tidal constituents denoted by β and tidal skewness index (γ) in typical months at Wenzhou Station from year 2000 to 2019
表 1 2019年各测站潮波基本特征
Tab. 1 Characteristics of tidal wave at each station in 2019
测站 南麂山 大门岛 龙湾 温州 东门村 最大潮差/m 7.15 8.04 8.19 7.53 8.56 最大潮差发生时间(月/日) 7/3 7/3 7/3 7/3 7/4 最小潮差/m 1.41 1.56 1.99 2.22 1.70 最小潮差发生时间(月/日) 12/6 12/6 1/29 12/6 2/28 年均潮汐偏度($ \mathrm{\gamma } $) 0.03 0.05 0.25 0.43 −0.16  下载: 导出CSV
表 2 各测站2019年7个主要分潮簇
Tab. 2 The seven primary combinations of tidal constituents at each station in 2019
分潮簇 南麂山站 大门岛站 龙湾站 温州站 东门村站 1 O1/K1/M2 M2/S2/MS4 M2/M4 M2/M4 M2/M4 2 M2/S2/MS4 O1/K1/M2 M2/S2/MS4 M2/S2/MS4 M2/S2/MS4 3 K1/M2/MK3 M2/M4 M2/N2/MN4 M2/N2/MN4 O1/K1/M2 4 M2/O1/MO3 M2/K1/MK3 M2/K1/MK3 M2/M4/M6 K1/P1/S2 5 M2/N2/MN4 M2/O1/MO3 M2/K2/MK4 M2/MS4/2MS6 K1/K2 6 K1/P1/S2 M2/N2/MN4 M2/K1/O1 MU2/S2/M4 MU2/S2/M4 7 M2/K2/MK4 S2/S4 M2/O1/MO3 M2/K2/MK4 M2/M4/M6
下载: 导出CSV
表 3 温州站2000−2019年6月和11月份主要分潮簇对潮汐不对称性贡献值及月潮位偏度Mann-Kendall检验值
Tab. 3 Mann-Kendall test value of contributions to tidal duration asymmetry by primary combinations of tidal constituents and tidal skewness at Wenzhou Station in June and November over 2000 to 2019
时间 β−M2/M4 β−M2/S2/MS4 β−M2/N2/MN4 γ 6月 −4.44 −0.68 −0.68 −3.21 11月 −2.95 −1.46 −0.36 −2.24
下载: 导出CSV
-
[1] Nidzieko N J. Tidal asymmetry in estuaries with mixed semidiurnal/diurnal tides[J]. Journal of Geophysical Research:Oceans, 2010, 115(C8): C08006. [2] 张蔚, 郁夏琰, 徐怡, 等. 三峡流量调节对长江口潮汐不对称的影响[J]. 河海大学学报(自然科学版), 2020, 48(2): 143−149.Zhang Wei, Yu Xiayan, Xu Yi, et al. Influence of discharge regulation by Three Gorges Dam on tidal asymmetry in Yangtze Estuary[J]. Journal of Hohai University (Natural Sciences), 2020, 48(2): 143−149. [3] Feng Xi, Feng Hui. On the role of anthropogenic activity and sea-level-rise in tidal distortion on the open coast of the Yellow Sea Shelf[J]. Journal of Geophysical Research: Oceans, 2021, 126(3): e2020JC016583. [4] 童朝锋, 安福伟, 章家保, 等. 乐清湾内外潮波变形及不对称性分析[J]. 海洋工程, 2020, 38(3): 113−123.Tong Chaofeng, An Fuwei, Zhang Jiabao, et al. Analysis of deformation and asymmetry of tidal waves inside and outside Yueqing Bay[J]. The Ocean Engineering, 2020, 38(3): 113−123. [5] 李谊纯, 徐群. 瓯江口内外潮汐不对称研究[J]. 水利水运工程学报, 2013(5): 61−65. doi: 10.3969/j.issn.1009-640X.2013.05.009Li Yichun, Xu Qun. A study of tidal asymmetry in Oujiang Estuary[J]. Hydro-Science and Engineering, 2013(5): 61−65. doi: 10.3969/j.issn.1009-640X.2013.05.009 [6] 张伯虎, 潘冬子, 胡成飞. 瓯江河口潮汐特征变化及其原因分析[J]. 长江流域资源与环境, 2017, 26(11): 1857−1864. doi: 10.11870/cjlyzyyhj201711014Zhang Bohu, Pan Dongzi, Hu Chengfei. Change of tidal characteristics in the Ou-Jiang Estuary[J]. Resources and Environment in the Yangtze Basin, 2017, 26(11): 1857−1864. doi: 10.11870/cjlyzyyhj201711014 [7] Song Dehai, Wang Xiaohua, Kiss A E, et al. The contribution to tidal asymmetry by different combinations of tidal constituents[J]. Journal of Geophysical Research: Oceans, 2011, 116(C12): C12007. doi: 10.1029/2011JC007270 [8] Pawlowicz R, Beardsley B, Lentz S. Classical tidal harmonic analysis including error estimates in MATLAB using T_TIDE[J]. Computers & Geosciences, 2002, 28(8): 929−937. [9] Blanton B O, Werner F E, Seim H E, et al. Barotropic tides in the South Atlantic Bight[J]. Journal of Geophysical Research: Oceans, 2004, 109(C12): C12024. doi: 10.1029/2004JC002455 [10] Feng Xi, Feng Hui, Li Huichao, et al. Tidal responses to future sea level trends on the Yellow Sea Shelf[J]. Journal of Geophysical Research: Oceans, 2019, 124(11): 7285−7306. doi: 10.1029/2019JC015150 [11] Idier D, Paris F, Cozannet G L, et al. Sea-level rise impacts on the tides of the European Shelf[J]. Continental Shelf Research, 2017, 137: 56−71. doi: 10.1016/j.csr.2017.01.007 [12] Feng Hui, Feng Xi, Feng Weibing, et al. Sensitivity of tides and tidal components to sea-level-rise in the Radial Sand Ridges[J]. Regional Studies in Marine Science, 2021, 47: 101918. doi: 10.1016/j.rsma.2021.101918 -


计量
- 文章访问数: 919
- HTML全文浏览量: 355
- PDF下载量: 107
- 被引次数: 0
