

Turbulence denoising based on proper orthogonal decomposition
-
摘要: 在近岸河口湍流研究中,实测的湍流资料往往容易受到噪声的影响,导致湍流特征量的估算出现偏差。本征正交分解是一种将流场在能量上进行分解再重构的方法,基于该方法,结合数值实验和野外实测资料,对包含噪声的湍流数据进行了去噪处理。结果表明:(1)本征正交分解能有效去除湍流中的噪声。在进行信号重构时,应将保留能量的百分比与湍流能量占比保持一致。去噪的效果与噪声占比有关,噪声占比越高,去噪效果越明显。(2)在实测资料中,憩流时刻的噪声占比要显著大于非憩流时刻,水平方向的噪声占比要大于垂直方向。经过本征正交分解去噪后,各湍流特征量的估算更加合理。Abstract: In the studies of turbulence in coastal and estuary, the turbulence data from field observation is often influenced by noise, which leads to deviate the estimation of turbulence properties. Proper orthogonal decomposition is a method which decompose and reconstruct the flow structure in energy filed. Based on this method, the turbulence data containing noise is denoised combined with numerical experiments and field observation data. The results show that: (1) Proper orthogonal decomposition can remove the noise in turbulence effectively. The percentage of retained energy in reconstruction should be consistent with the percentage of turbulence energy in the raw signal. The results of denoising are related to the percentage of noise, the higher the percentage of noise, the effect of denoising is more obvious. (2) In the field observation, the percentage of noise in the slack tide is obviously higher than the noise which in the non-slack tide, while the percentage of noise in the horizontal direction is higher than that in the vertical direction. The estimation of each turbulence properties is more reasonable after using the proper orthogonal decomposition to denoise.
-
Key words:
- proper orthogonal decomposition /
- turbulence /
- denoising /
- energy spectrum /
- turbulence properties
-
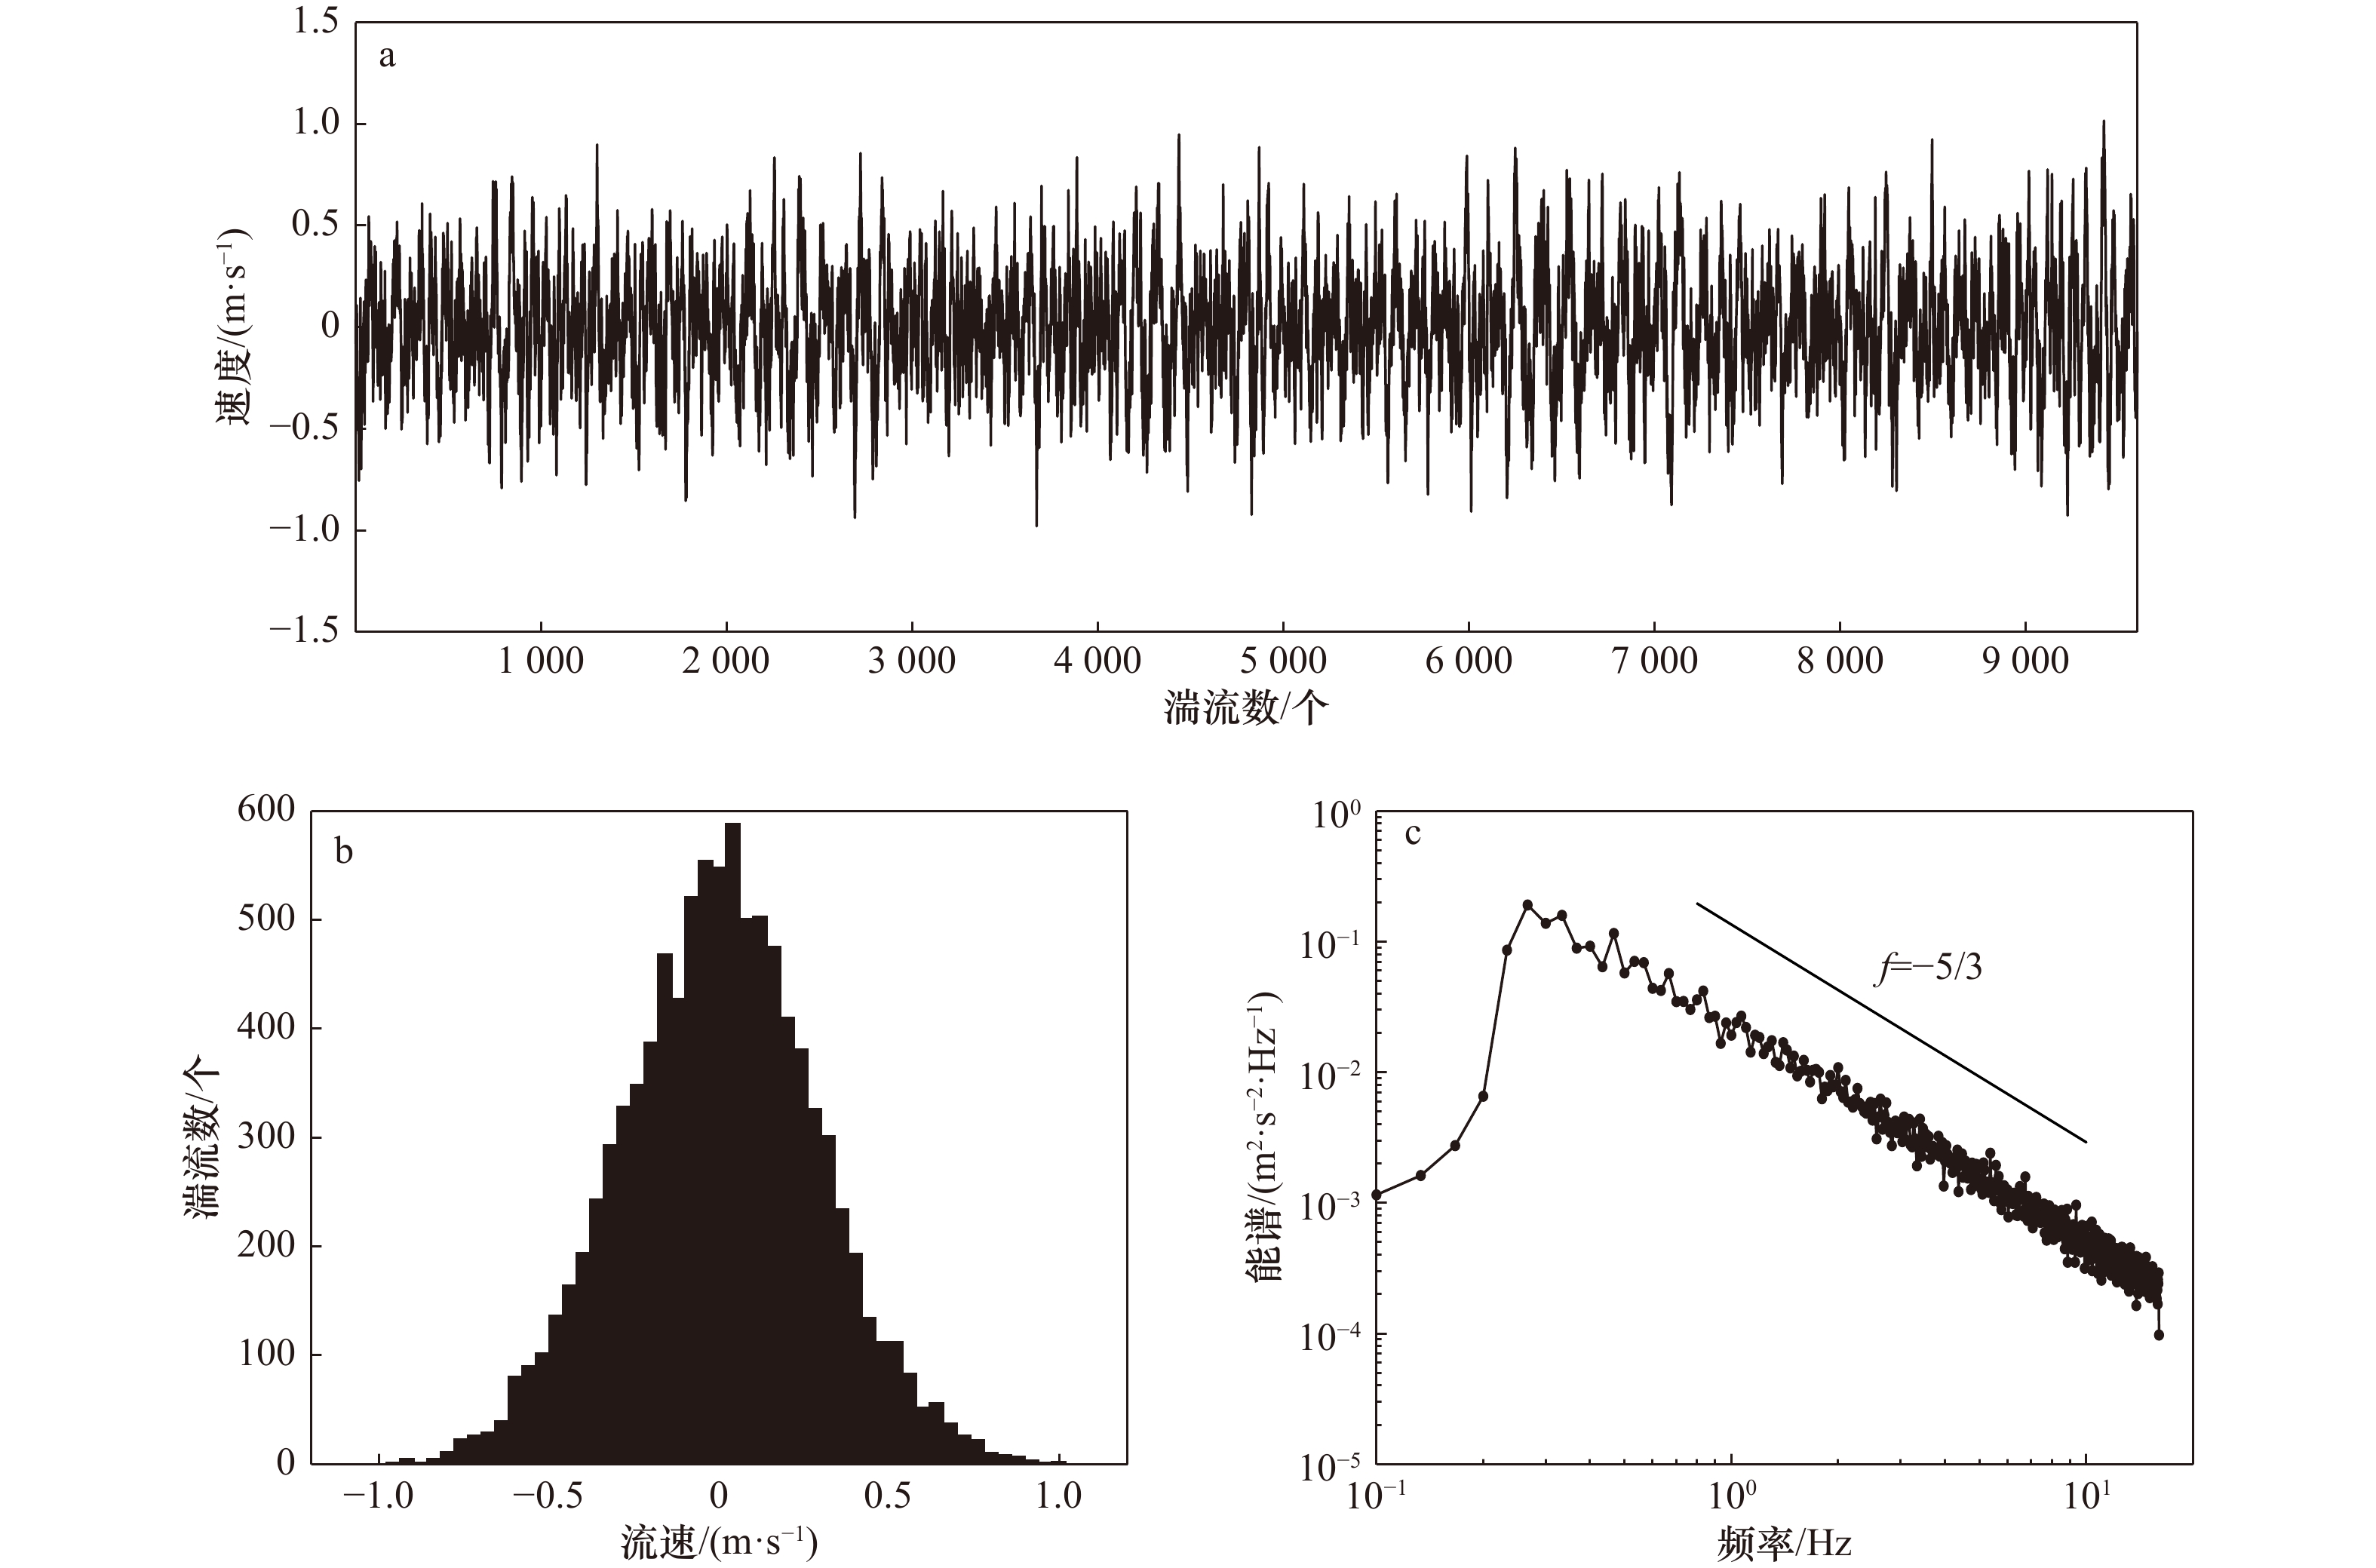
图 1 脉动速度特征时间序列(a)、概率分布(b)和能谱(c)
Fig. 1 Properties of fluctuation velocity time series (a), probability distribution (b), and energy spectrum (c)

图 2 不同湍流能量占比90%(a)、80%(b)、70%(c)和60%(d) 下均方误差(MSE)随保留能量的变化曲线
Fig. 2 Relationship between mean squared error (MSE) and remaining energy at different ratio of turbulent energy 90% (a), 80% (b), 70% (c) and 60% (d)
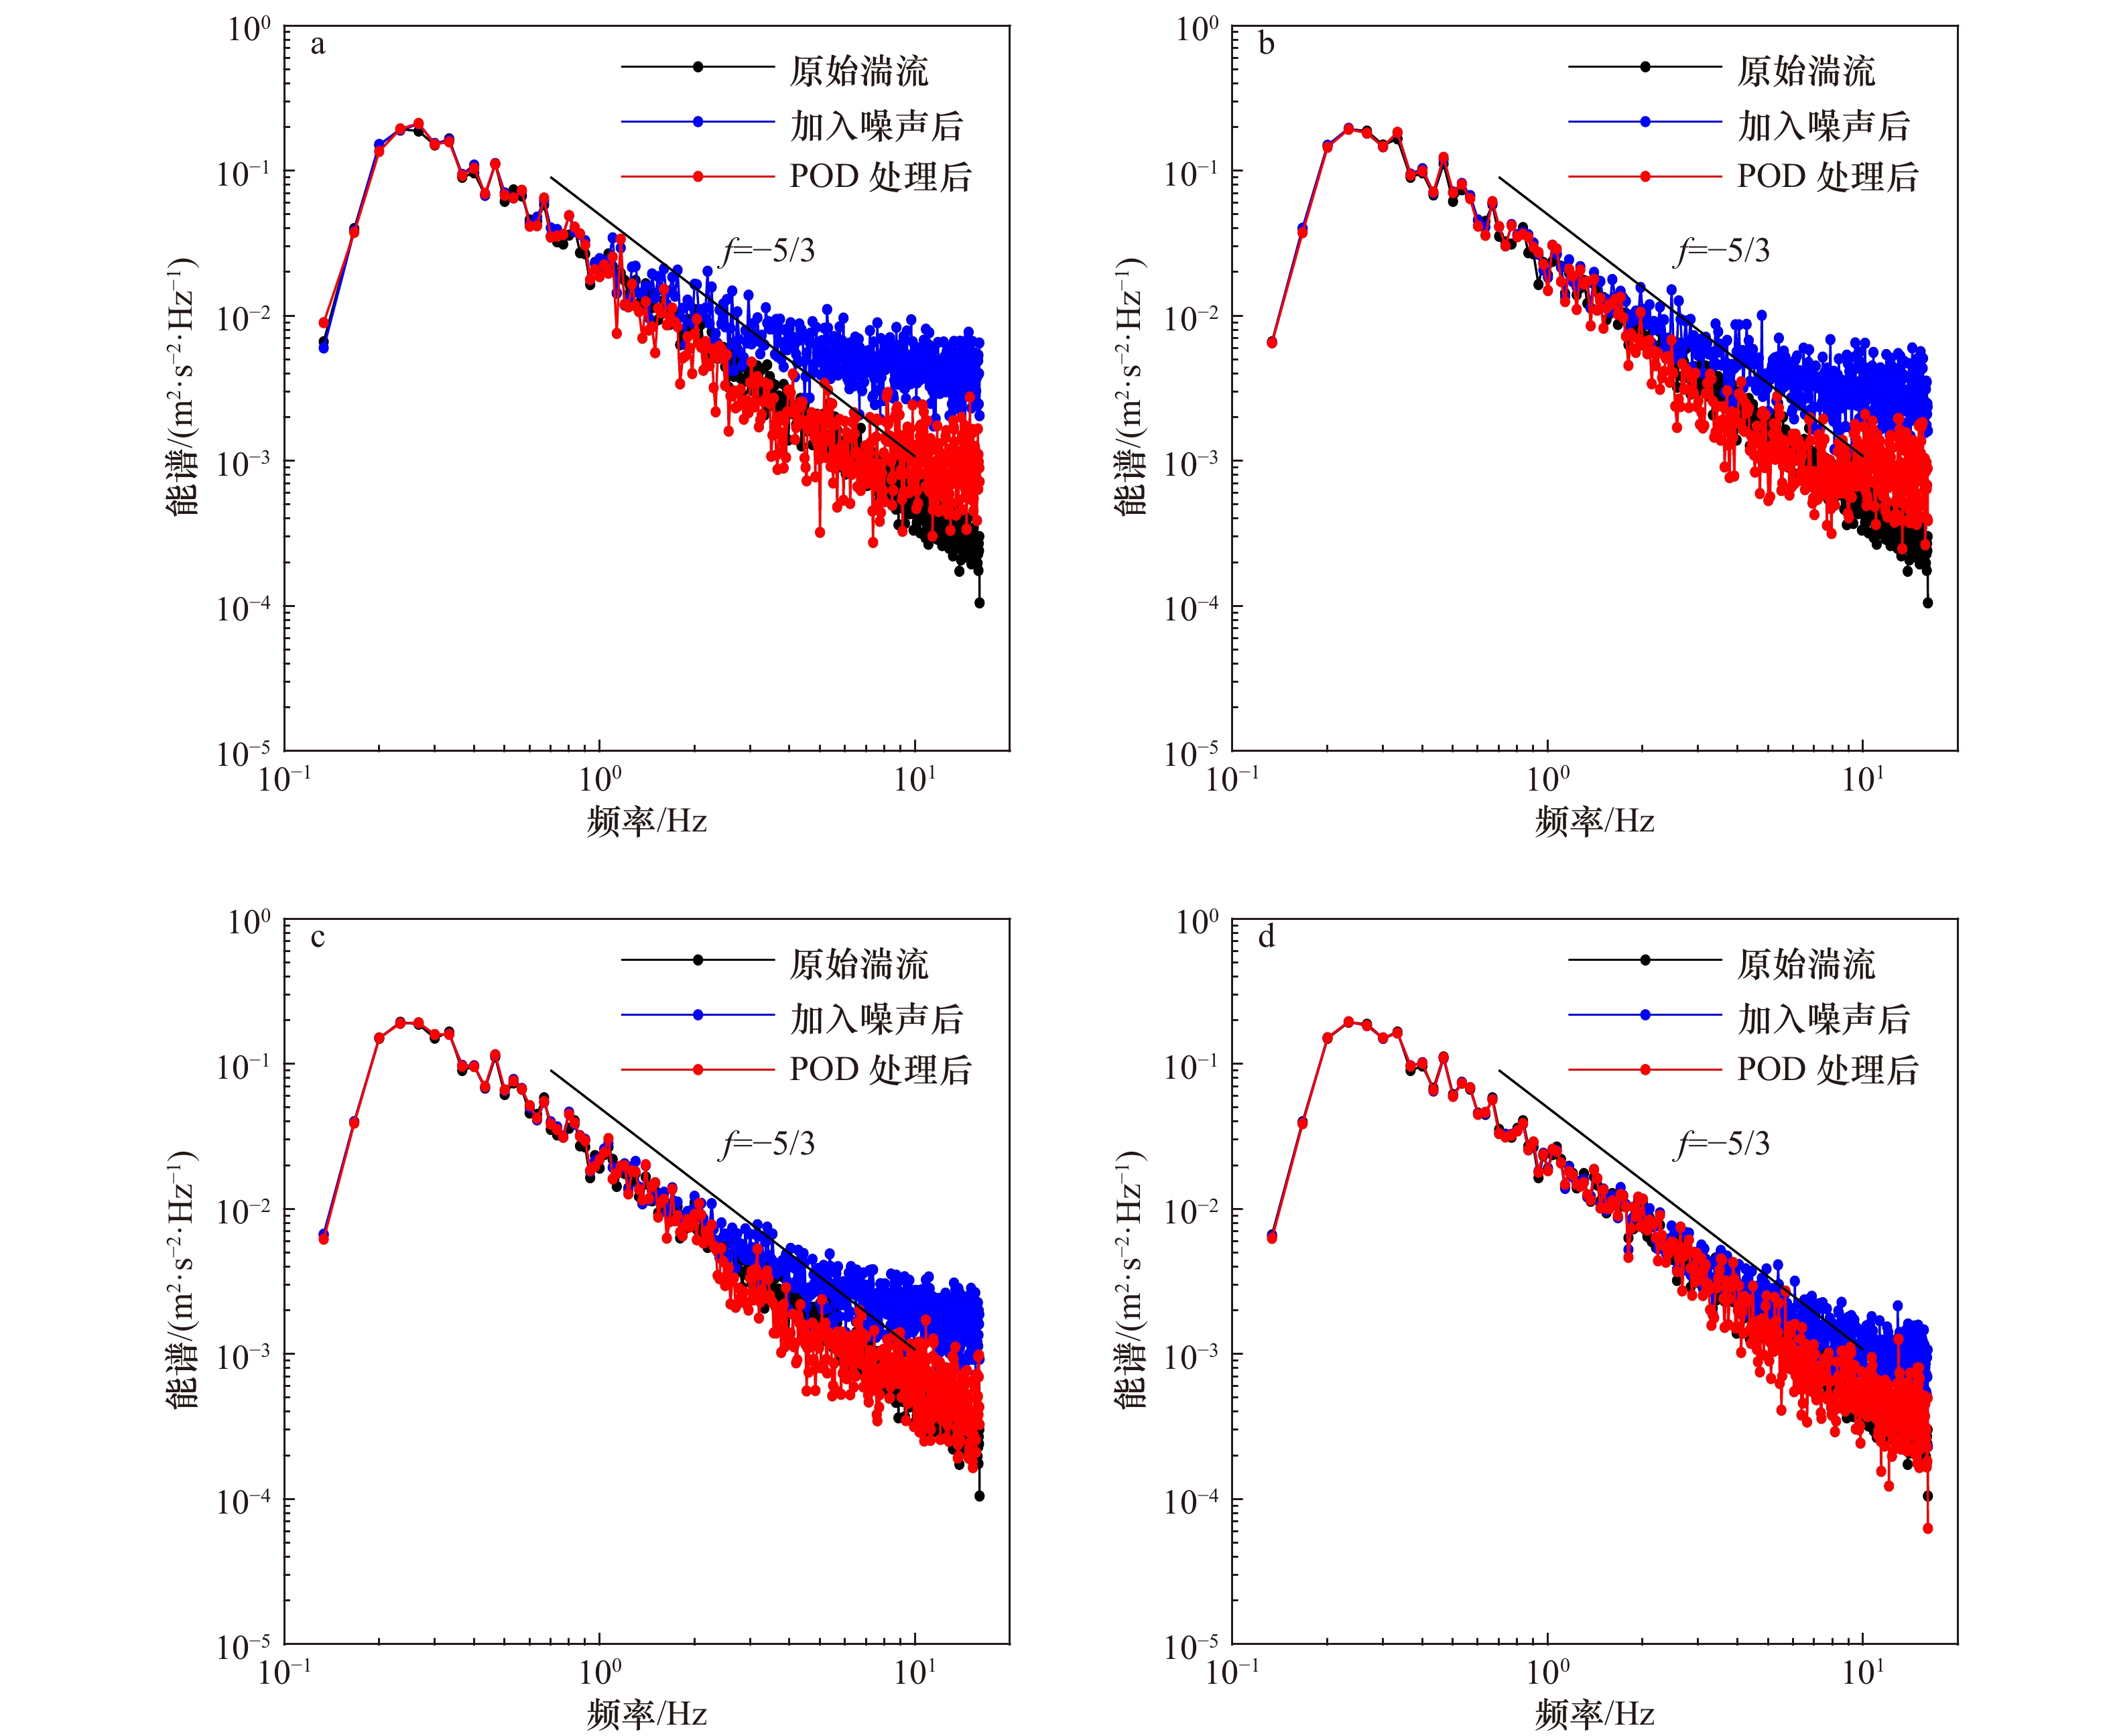
图 3 不同湍流能量占比60%(a)、70%(b)、80%(c)和90%(d)去噪前后垂直方向能谱对比
Fig. 3 Comparison of energy spectrum in vertical direction before and after denoising at different ratio of turbulent energy 60% (a), 70% (b), 80% (c), and 90% (d)
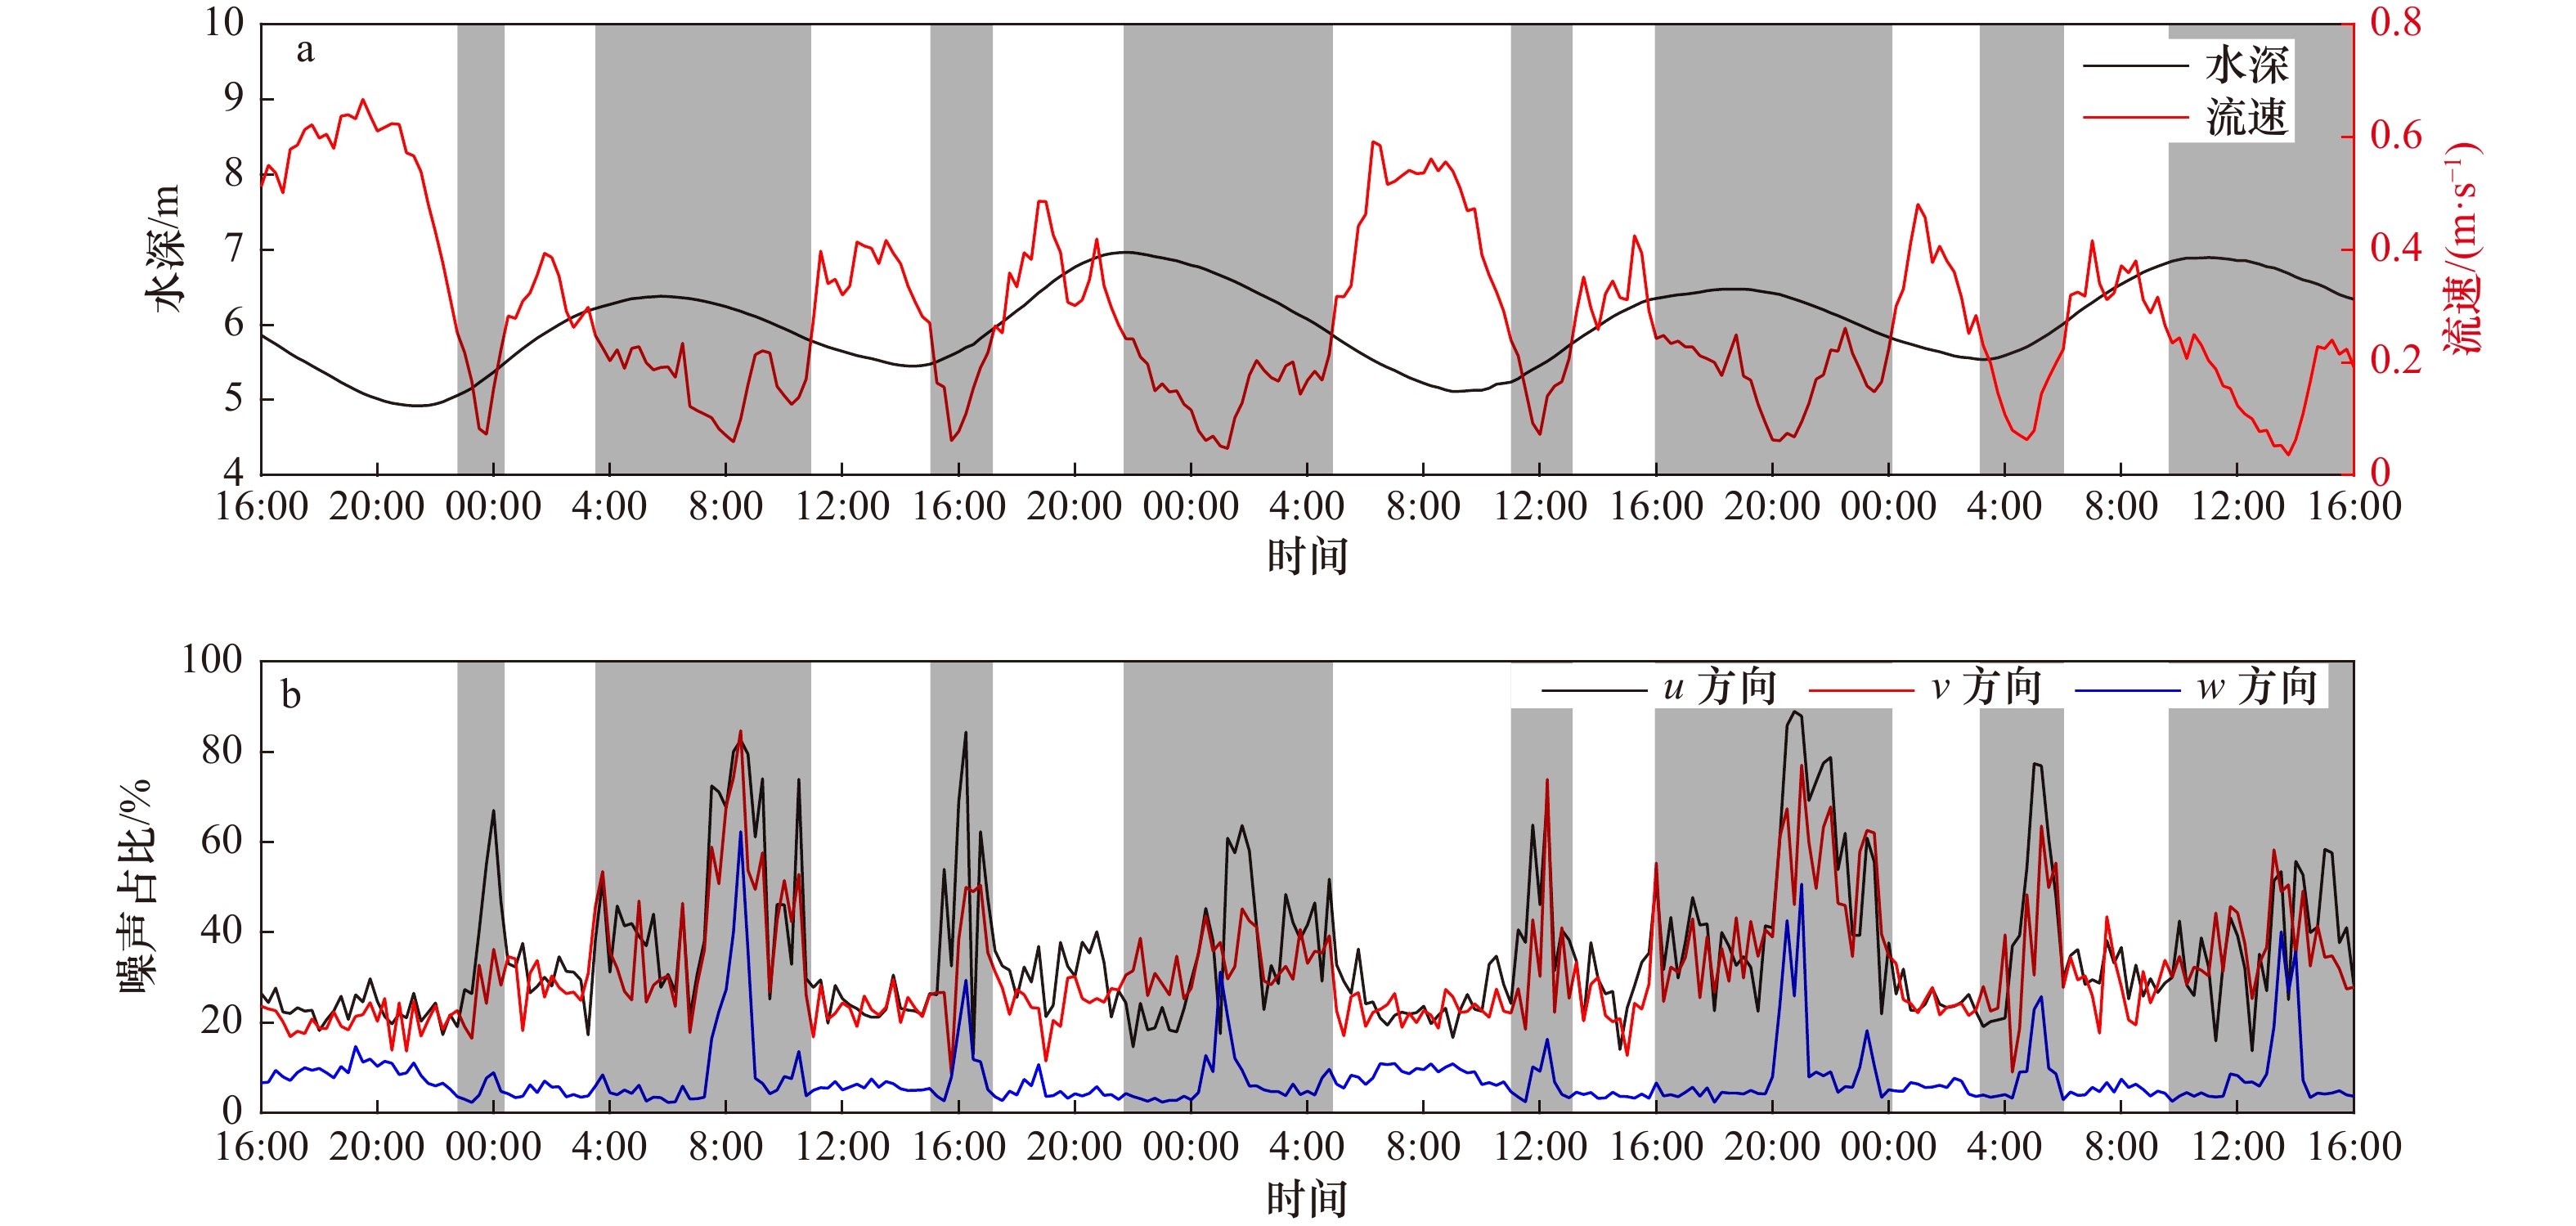
图 5 野外观测各要素的时间序列深度和平均流速(a)和 u、v、w方向的噪声占比(b)
图中阴影表示憩流时刻;观测时间为2019年8月18日16:00至20日16:00
Fig. 5 Time series of each features from field observation depth and average velocity (a) and the proportion of the noise in u, v, and w directions (b)
The shadow indicates slack tide; the observation time is 16:00 UTC on August 18 to 16:00 UTC on August 20 , 2019
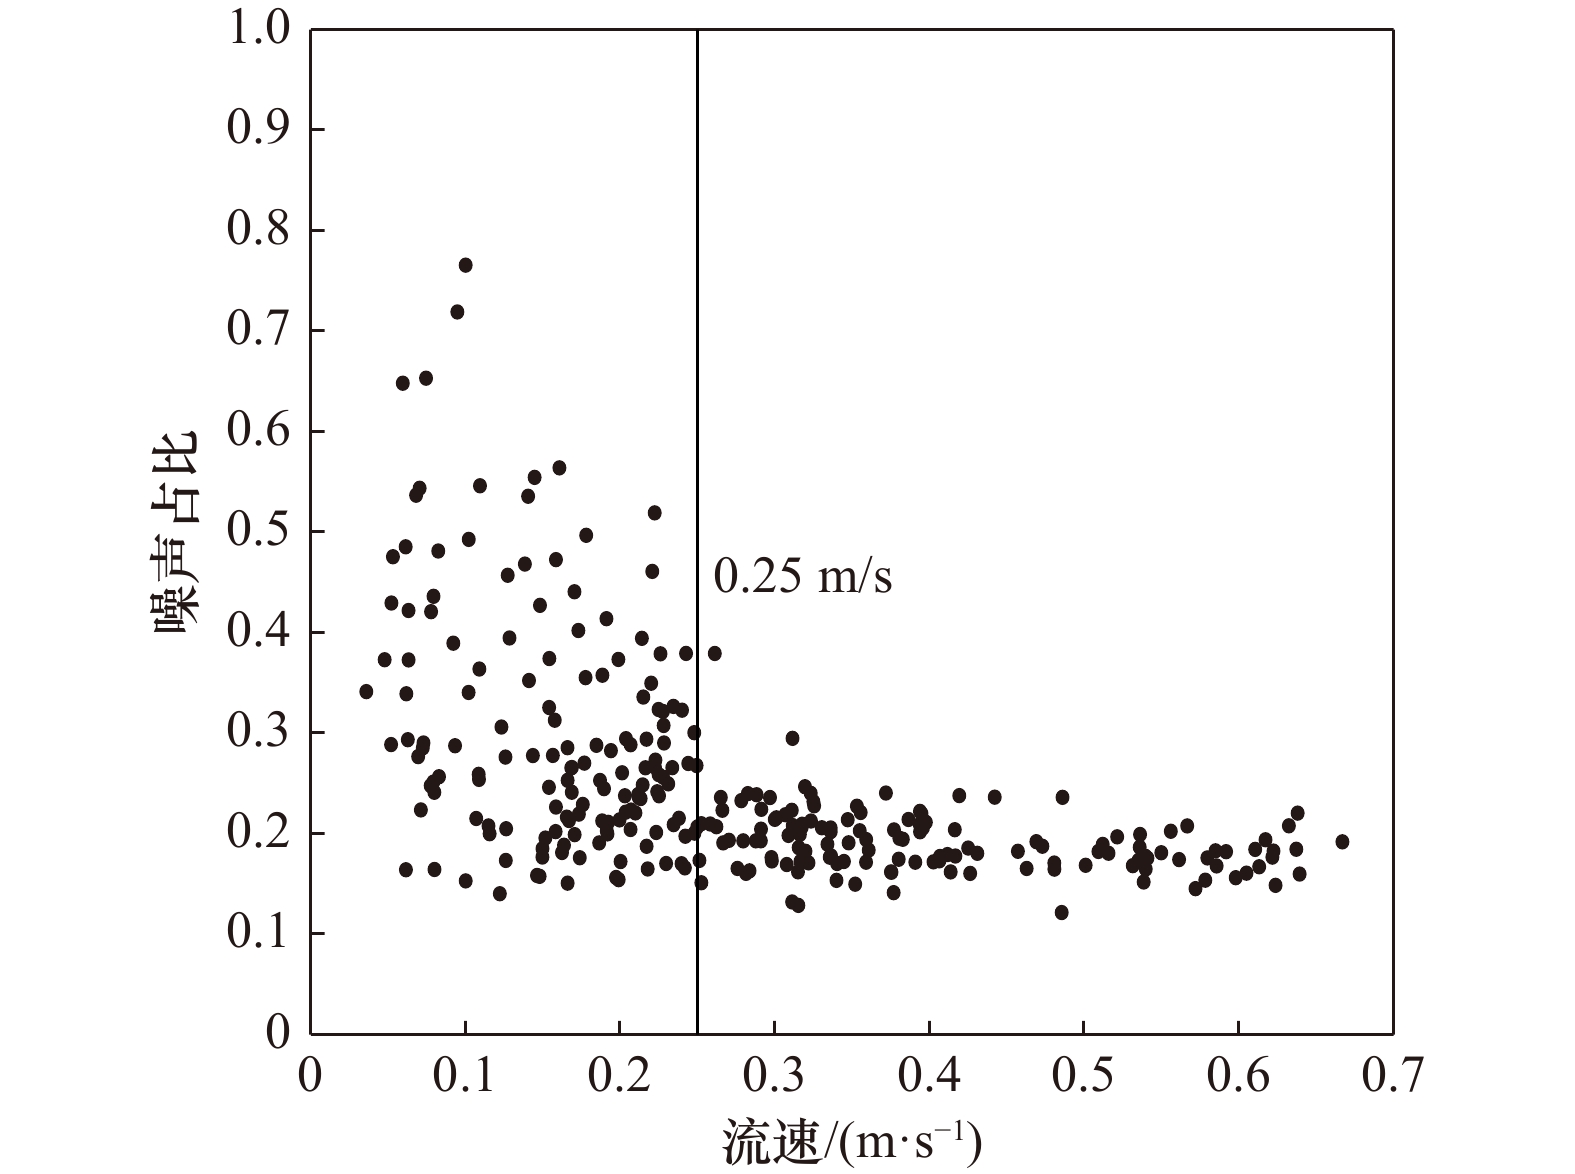
图 6 平均流速与平均噪声占比关系
Fig. 6 The relationship between average velocity and proportion of average noise

图 7 u方向(a)、v方向(b)和w方向(c)脉动流速能谱曲线
灰色实线为单组(300 s)的能谱,黑色实线为非憩流时刻系综平均能谱,黑色虚线为憩流时刻系综平均能谱
Fig. 7 Energy spectrum of fluctuation velocity in u direction (a), v direction (b), and w direction (c)
The gray solid line is the energy spectrum of a single group (300 s), the black solid line is the ensemble average energy spectrum of non-slack tide, and the black dotted line is the ensemble average energy spectrum of slack tide

图 8 去噪前后各方向脉动流速系综平均能谱
a. 憩流u方向;b. 憩流v方向;c. 憩流w方向;d. 非憩流u方向;e. 非憩流v方向;f. 非憩流w方向;黑色点线和红色点线分别为憩流时刻和非憩流时刻满足准各向同性比(R)的区间(在5.2.2节中讨论)
Fig. 8 Ensemble average energy spectrum of fluctuation velocity in different direction before and after denoising
a. u direction at slack; b v direction at slack; c. w direction at slack; d. u direction at non-slack; e. v direction at non-slack; f. w direction at non-slack. The black dotted lines and red dotted lines are the intervals that satisfy the quasi isotropic ratio of slack tide and non-slack tide respectively (discussed in Section 5.2.2)

图 9 去噪前后湍流特征量时间序列
图中阴影表示憩流时刻;观测时间为2019年8月18日16:00至20日16:00
Fig. 9 Time series of turbulence properties before and after denoising
The shadow indicates slack tide; the observation time is 16:00 UTC on August 18 to 16:00 UTC on August 20 , 2019
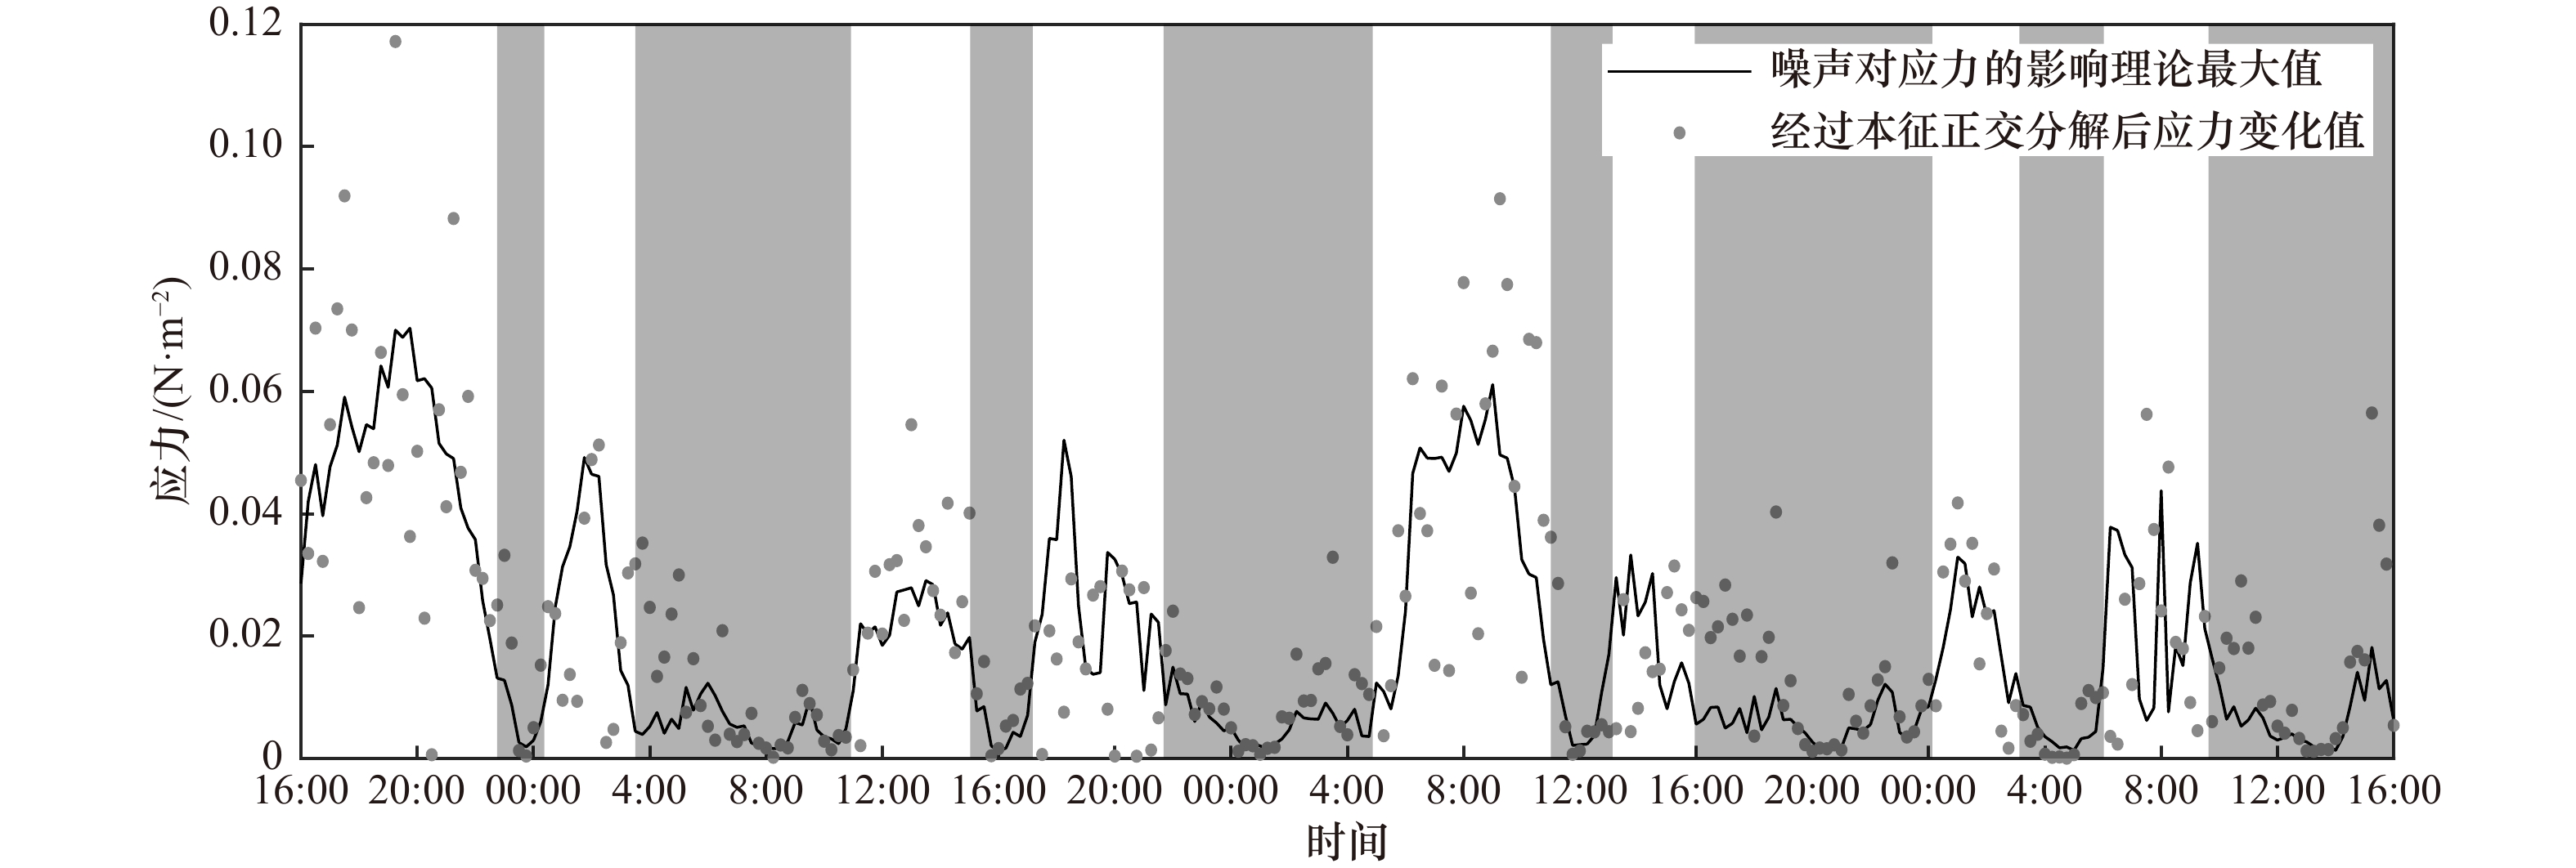
图 10 去噪前后雷诺应力的时间序列
图中阴影表示憩流时刻;观测时间为2019年8月18日16:00至20日16:00
Fig. 10 Time series of Reynolds stress before and after denoising
The shadow indicates slack tide; the observation time is 16:00 UTC on August 18 to 16:00 UTC on August 20 , 2019
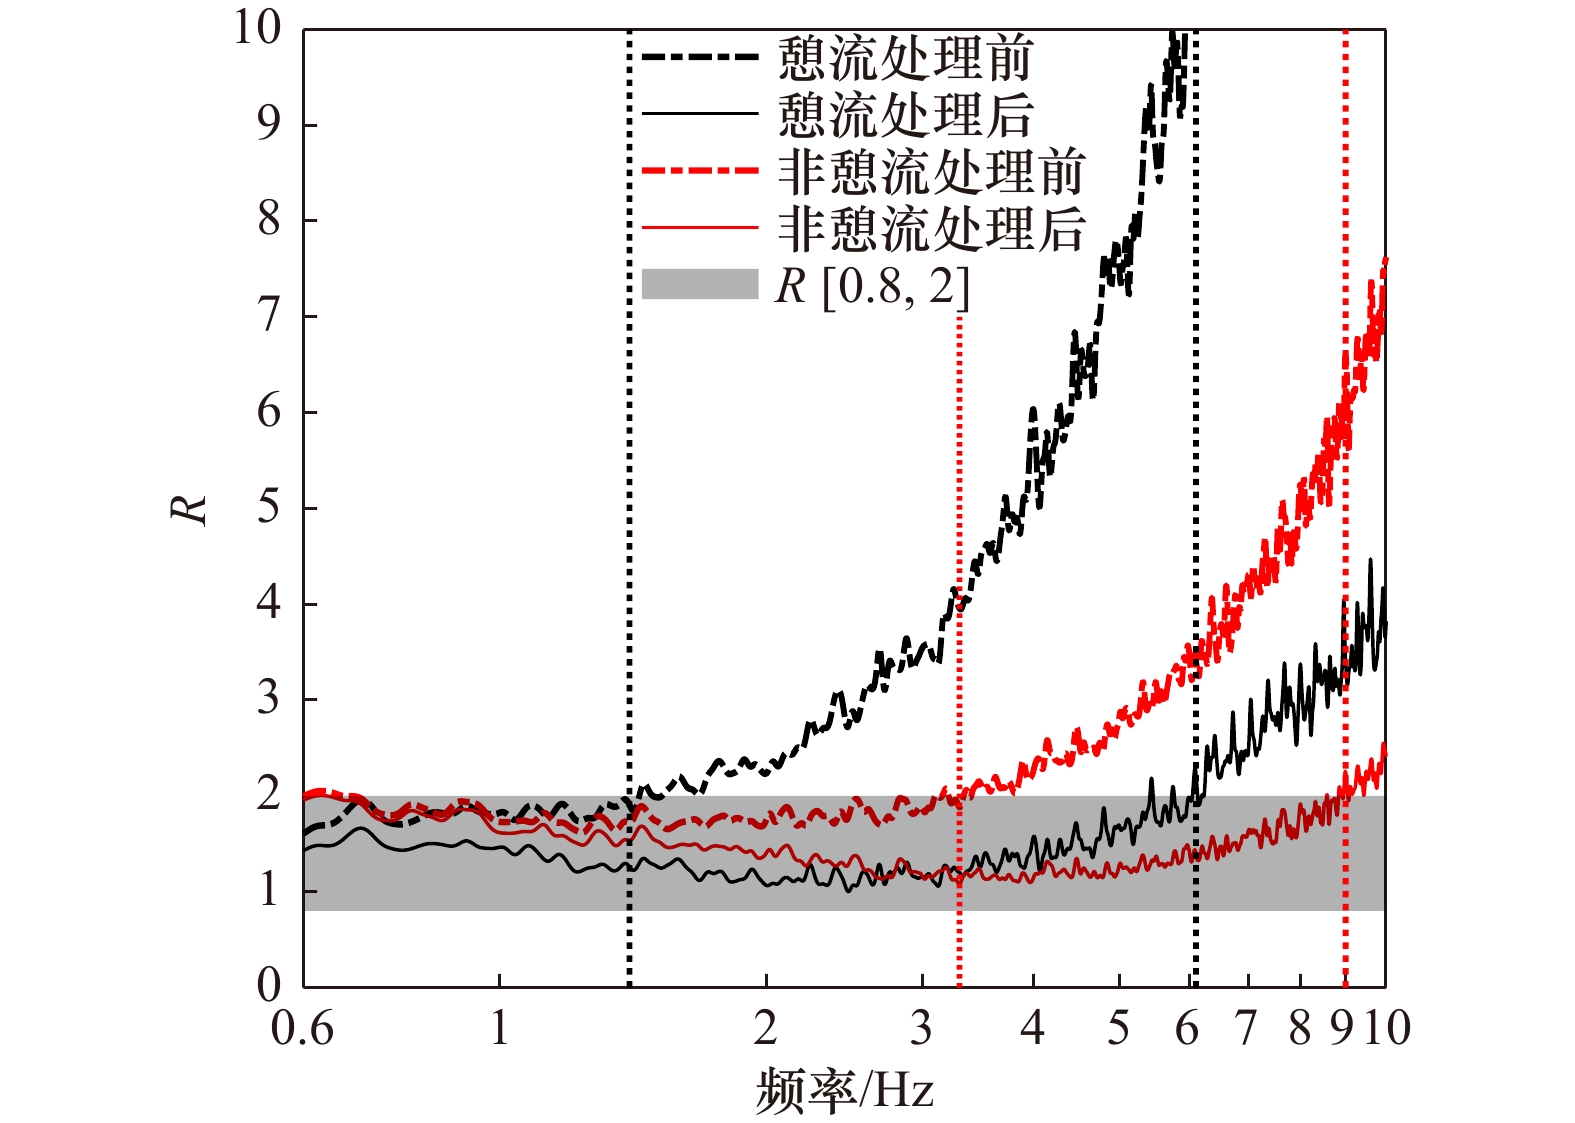
图 12 去噪前后准各向同性比(R)随频率的变化曲线
黑色和红色垂直虚线分别为憩流和非憩流时刻去噪前后开始偏离0.8~2(阴影区间)的频率
Fig. 12 Variation of the ratio of spectra for horizontal and vertical components (R) as a function of frequency before and after denoising
The black and red vertical dashed lines indicate the frequency range before and after denoising at the slack tide and the non-slack tide that deviate from 0.8 to 2 (the shadow interval)
表 1 脉动速度统计量
Tab. 1 Fluctuation velocity statistics
统计量 脉动速度 纵向(u) 侧向(v) 垂向(w) 标准差/(m·s–1) 0.364 0.338 0.287 偏态系数 –0.024 0.050 0.003 峰度系数 2.898 3.082 2.990  下载: 导出CSV
表 2 去噪前后湍流统计量对比(湍流能量占比70%,保留能量70%)
Tab. 2 Comparison of turbulent statistics before and after denoising (70% of turbulent energy, 70% of remaining energy)
统计量 原始脉动速度 加入噪声后脉动速度 去噪后脉动速度 纵向(x) 侧向(y) 垂向(z) 纵向(x) 侧向(y) 垂向(z) 纵向(x) 侧向(y) 垂向(z) 标准差/(m·s−1) 0.364 0.338 0.287 0.438 0.407 0.343 0.367 0.341 0.289 偏态系数 –0.024 0.050 0.003 0.019 0.036 –0.010 0.053 0.071 –0.003 峰度系数 2.898 3.082 2.990 2.990 3.074 3.015 3.016 3.074 3.103
下载: 导出CSV
-
[1] Wright L D. Benthic boundary layers of estuarine and coastal environments[J]. Reviews in Aquatic Sciences, 1989, 1(1): 75−96. [2] Sukhodolov A N, Uijttewaal W S J. Assessment of a river reach for environmental fluid dynamics studies[J]. Journal of Hydraulic Engineering, 2010, 136(11): 880−888. doi: 10.1061/(ASCE)HY.1943-7900.0000267 [3] 刘欢, 吴超羽. 河口湍流数据现场采集和后处理[J]. 海洋工程, 2011, 29(2): 122−128, 134. doi: 10.3969/j.issn.1005-9865.2011.02.018Liu Huan, Wu Chaoyu. Turbulence measurement in estuary and data post-processing[J]. The Ocean Engineering, 2011, 29(2): 122−128, 134. doi: 10.3969/j.issn.1005-9865.2011.02.018 [4] García C M, Cantero M I, Niño Y, et al. Turbulence measurements with acoustic Doppler velocimeters[J]. Journal of Hydraulic Engineering, 2005, 131(12): 1062−1073. doi: 10.1061/(ASCE)0733-9429(2005)131:12(1062) [5] Blanckaert K, Lemmin U. Means of noise reduction in acoustic turbulence measurements[J]. Journal of Hydraulic Research, 2006, 44(1): 3−17. doi: 10.1080/00221686.2006.9521657 [6] Thomson J, Polagye B, Durgesh V, et al. Measurements of turbulence at two tidal energy sites in puget sound, WA[J]. IEEE Journal of Oceanic Engineering, 2012, 37(3): 363−374. doi: 10.1109/JOE.2012.2191656 [7] 李士心, 刘鲁源, 舒玮. 子波去噪技术在湍流信号处理中的应用[J]. 实验力学, 2001, 16(4): 433−437. doi: 10.3969/j.issn.1001-4888.2001.04.013Li Shixin, Liu Luyuan, Shu Wei. Turbulent signal processing based on wavelet transform de-noising technique[J]. Journal of Experimental Mechanics, 2001, 16(4): 433−437. doi: 10.3969/j.issn.1001-4888.2001.04.013 [8] 汪健生, 张金钟, 舒玮. 提取壁湍流相干结构的数字滤波法[J]. 力学学报, 1995, 27(4): 398−405.Wang Jiansheng, Zhang Jinzhong, Shu Wei. The digital filter method of extracting the coherent structurein wall turbulence[J]. Acta Mechanica Sinica, 1995, 27(4): 398−405. [9] Kumar P, Foufoula-Georgiou E. Wavelet analysis for geophysical applications[J]. Reviews of Geophysics, 1997, 35(4): 385−412. doi: 10.1029/97RG00427 [10] Piera J, Roget E, Catalan J. Turbulent patch identification in microstructure profiles: a method based on wavelet denoising and thorpe displacement analysis[J]. Journal of Atmospheric and Oceanic Technology, 2002, 19(9): 1390−1402. doi: 10.1175/1520-0426(2002)019<1390:TPIIMP>2.0.CO;2 [11] 张斌, 王彤, 谷传纲, 等. 改进的小波阈值消噪法在湍流信号处理中的应用[J]. 工程热物理学报, 2009, 30(3): 407−410. doi: 10.3321/j.issn:0253-231X.2009.03.012Zhang Bin, Wang Tong, Gu Chuan’gang, et al. Application of improved wavelet threshold de-noising in turbulent signal processing[J]. Journal of Engineering Thermophysics, 2009, 30(3): 407−410. doi: 10.3321/j.issn:0253-231X.2009.03.012 [12] Gupta A, Joshi S D, Prasad S. On a new approach for estimating wavelet matched to signal[C]//Bombay: Proceedings of the Eighth National Conference on Communications, 2002: 180−184. [13] Schmid P J. Dynamic mode decomposition of numerical and experimental data[J]. Journal of Fluid Mechanics, 2010, 656: 5−28. doi: 10.1017/S0022112010001217 [14] 鲁远征, 吴加学, 刘欢. 河口底边界层湍流观测后处理技术方法分析[J]. 海洋学报, 2012, 34(5): 39−49.Lu Yuanzheng, Wu Jiaxue, Liu Huan. An integrated post-processing technique for turbulent flows in estuarine bottom boundary layer[J]. Haiyang Xuebao, 2012, 34(5): 39−49. [15] Durgesh V, Thomson J, Richmond M C, et al. Noise correction of turbulent spectra obtained from acoustic Doppler velocimeters[J]. Flow Measurement and Instrumentation, 2014, 37: 29−41. doi: 10.1016/j.flowmeasinst.2014.03.001 [16] Citriniti J H, George W K. Reconstruction of the global velocity field in the axisymmetric mixing layer utilizing the proper orthogonal decomposition[J]. Journal of Fluid Mechanics, 2000, 418: 137−166. doi: 10.1017/S0022112000001087 [17] Durgesh V, Semaan R C, Naughton J W. Revealing unsteady flow structure from flow visualization images[J]. The European Physical Journal Special Topics, 2010, 182(1): 35−50. doi: 10.1140/epjst/e2010-01224-1 [18] Luo Zhendong, Du Juan, Xie Zhenghui, et al. A reduced stabilized mixed finite element formulation based on proper orthogonal decomposition for the non-stationary Navier-Stokes equations[J]. International Journal for Numerical Methods in Engineering, 2011, 88(1): 31−46. doi: 10.1002/nme.3161 [19] Liu Zhiyu, Wei Hao. Estimation to the turbulent kinetic energy dissipation rate and bottom shear stress in the tidal bottom boundary layer of the Yellow Sea[J]. Progress in Natural Science, 2007, 17(3): 289−297. doi: 10.1080/10020070612331343260 [20] Fan Renfu, Wei Hao, Zhao Liang, et al. Identify the impacts of waves and tides to coastal suspended sediment concentration based on high-frequency acoustic observations[J]. Marine Geology, 2019, 408: 154−164. doi: 10.1016/j.margeo.2018.12.005 [21] Guerra M, Thomson J. Turbulence measurements from five-beam acoustic Doppler current profilers[J]. Journal of Atmospheric and Oceanic Technology, 2017, 34(6): 1267−1284. doi: 10.1175/JTECH-D-16-0148.1 [22] PEF. 3D Turbulent Wind Generation[EB/OL]. (2015–12–14) [2021–09–08]. https://www.mathworks.com/matlabcentral/fileexchange/54491-3d-turbulent-wind-generation [23] Huang Chuanjiang, Ma Hongyu, Guo Jingsong, et al. Calculation of turbulent dissipation rate with acoustic Doppler velocimeter[J]. Limnology and Oceanography: Methods, 2018, 16(5): 265−272. doi: 10.1002/lom3.10243 [24] 刘志宇. 强潮驱陆架海中的湍流与混合[D]. 青岛: 中国海洋大学, 2009.Liu Zhiyu. Turbulence and mixing in tidally energetic shelf seas[D]. Qingdao: Ocean University of China, 2009. [25] Romagnoli M, García C M, Lopardo R A. Signal postprocessing technique and uncertainty analysis of ADV turbulence measurements on free hydraulic jumps[J]. Journal of Hydraulic Engineering, 2012, 138(4): 353−357. doi: 10.1061/(ASCE)HY.1943-7900.0000507 [26] Sreenivasan K R. On the universality of the Kolmogorov constant[J]. Physics of Fluids, 1995, 7(11): 2778−2784. doi: 10.1063/1.868656 [27] Le Couturier M N, Grochowski N T, Heathershaw A, et al. Turbulent and macro-turbulent structures developed in the benthic boundary layer downstream of topographic features[J]. Estuarine, Coastal and Shelf Science, 2000, 50(6): 817−833. doi: 10.1006/ecss.1999.0602 [28] 刘欢, 吴超羽, 许炜铭, 等. 珠江河口底边界层湍流特征量研究[J]. 海洋工程, 2009, 27(1): 62−69, 76. doi: 10.3969/j.issn.1005-9865.2009.01.010Liu Huan, Wu Chaoyu, Xu Weiming, et al. Research on turbulent features of the bottom boundary layer in the Pearl River[J]. The Ocean Engineering, 2009, 27(1): 62−69, 76. doi: 10.3969/j.issn.1005-9865.2009.01.010 [29] 刘志宇, 魏皓. 黄海潮流底边界层内湍动能耗散率与底应力的估计[J]. 自然科学进展, 2007, 17(3): 362−369. doi: 10.3321/j.issn:1002-008X.2007.03.011Liu Zhiyu, Wei Hao. Estimation to the turbulent kinetic energy dissipation rate and bottom shear stress in the tidal bottom boundary layer of the Yellow Sea[J]. Progress in Natural Science, 2007, 17(3): 362−369. doi: 10.3321/j.issn:1002-008X.2007.03.011 [30] Lumley J L, Terray E A. Kinematics of turbulence convected by a random wave field[J]. Journal of Physical Oceanography, 1983, 13(11): 2000−2007. doi: 10.1175/1520-0485(1983)013<2000:KOTCBA>2.0.CO;2 [31] Trowbridge J, Elgar S. Turbulence measurements in the surf zone[J]. Journal of Physical Oceanography, 2000, 31(8): 2403−2417. [32] Batchelor G K. The Theory of Homogeneous Turbulence[M]. Cambridge: Cambridge University Press, 1953. [33] Feddersen F. Quality controlling surf zone acoustic Doppler velocimeter observations to estimate the turbulent dissipation rate[J]. Journal of Atmospheric and Oceanic Technology, 2010, 27(12): 2039−2055. doi: 10.1175/2010JTECHO783.1 -

计量
- 文章访问数: 505
- HTML全文浏览量: 153
- PDF下载量: 62
- 被引次数: 0
