

Typical spatiotemporal patterns of the Kuroshio south of Japan and the Kuroshio extension using self-organizing maps and their causal relationship
-
摘要: 过去的研究认为,黑潮延伸体的年代际振荡受来自其下游的太平洋年代际振荡(PDO)相关联的信号主导,但最近的观测表明这种调控机制在2017年9月之后不再成立。与此同时,黑潮延伸体的上游即日本南部黑潮正在发生一次大弯曲事件。利用26年(1993–2018年)的卫星高度计提供的海表高度距平数据和自组织映射(SOM)方法,本文研究了日本南部黑潮与黑潮延伸体的时空模态及其因果关系。结果表明,SOM能有效地提取两个海区的典型空间模态,且它们的演变轨迹表明当日本南部黑潮处于大弯曲(离岸型非大弯曲)路径时,黑潮延伸体趋于稳定(不稳定)态。基于SOM识别得到的海表面高度距平(SLA)特征区及特征时间模态,我们进一步利用一种最近发展的定量因果分析方法研究了两个流系之间的因果关系。研究发现,当黑潮大弯曲发生时,日本南部黑潮和黑潮延伸体之间存在双向因果,但因果关键区不同。前者对后者的影响集中在纪伊半岛东南侧及黑潮延伸体“两脊一槽”区域,而后者对前者的影响则集中在黑潮延伸体“两脊一槽”区域及黑潮再循环流区域。这说明黑潮大弯曲的发展对黑潮延伸体的稳定性有重要作用,同时黑潮延伸体通过调制南部再循环流影响日本南部黑潮的路径。不同的是,当离岸型非大弯曲路径发生时,只有从日本南部黑潮向黑潮延伸体的单向因果关系,且因果性主要集中在伊豆海脊及再循环流区域。这与该时期海表高度负异常沿日本南岸不断向位于下游的黑潮延伸体再循环流的传播有关,它使得黑潮延伸体变得不稳定。Abstract: Previous studies have shown that the decadal modulation of the Kuroshio extension (KE) system is controlled by the Pacific decadal oscillation-associated forcing from downstream. However, recent observation reveals that this mechanism ceases to function after August 2017. Meanwhile, a large meander is under development in the KE’s upstream, i.e., south of Japan. Using the self-organizing map (SOM), we investigate the characteristic spatial and temporal patterns of the Kuroshio south of Japan and the KE and their causal relations, based on the 26-year (1993−2018) satellite altimetry data of sea level anomaly (SLA). The typical spatial patterns are well extracted, and their temporal trajectories indicate that the KE tends to be stable (unstable) when the upstream Kuroshio takes a large meander (an offshore nonlarge meander) path. To further unravel the underlying cause-and-effect relation between the two systems, we apply the information flow-based causality analysis to the typical regions of SLA and its associated temporal modes identified with the SOM. It is found that during the large meander event, the Kuroshio south of Japan and the KE are mutually causal, but have different hotspots. The information flows from the former to the latter mainly occur in the southeastern area off the Kii Peninsula and the time-mean ridge and trough of the KE jet, while those from the latter to the former are mainly concentrated in the time-mean ridge and trough of the KE jet, and the recirculation gyre of the Kuroshio. These results indicate that the Kuroshio large meander is an important factor influencing the KE’s stability, while the KE affects its upstream Kuroshio via modulating the associated recirculation gyres. In contrast, when the offshore nonlarge meander path is taken, a one-way causality is identified from the Kuroshio to the KE, mainly occurring over the Izu-Ogasawara Ridge and in the recirculation gyres. This may be attributed to the constantly downstream transport of negative SLAs into the KE’s recirculation gyre, which leads to an unstable KE.
-
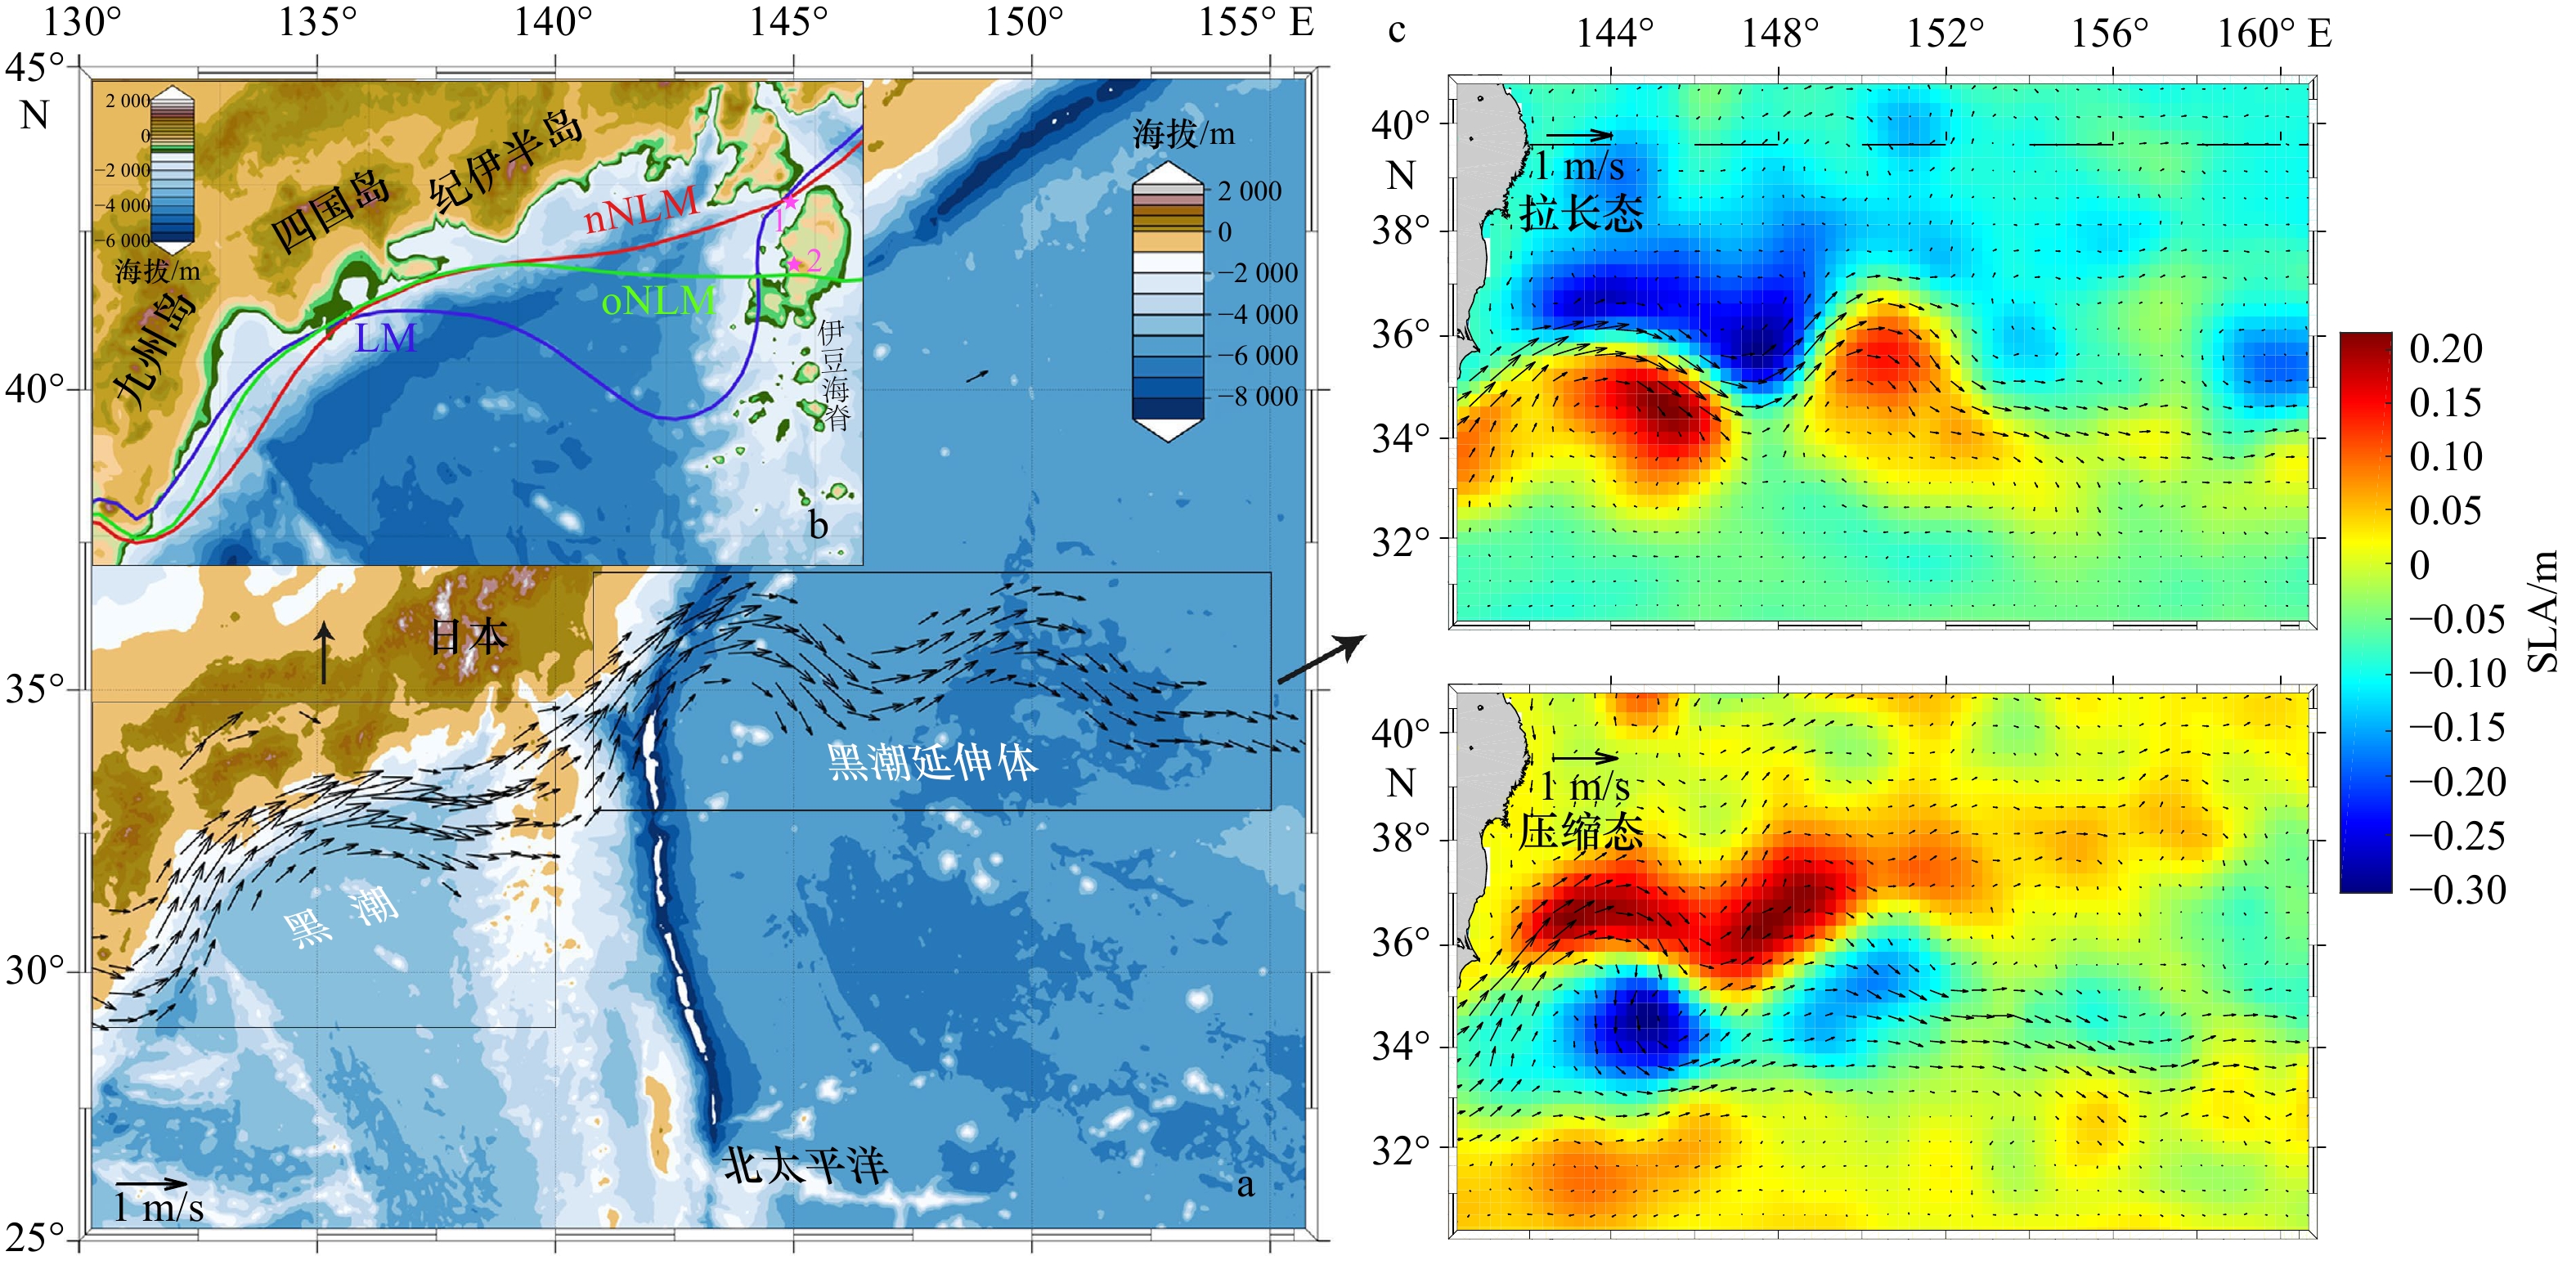
图 1 基于ETOPO1数据集的研究区域地形及平均流速大于0.25 m/s的流矢量场
a. 用于表示黑潮1993–2018年的平均路径;b. 日本南部黑潮的3种典型路径(LM、oNLM、nNLM); c. 黑潮延伸体在拉长态与压缩态两种路径下的海表面高度距平(SLA)场和流矢量场。海域内地理位置标注为:1. 三宅岛;2. 八丈岛
Fig. 1 Bathymetry of our research domain and the time-mean current vector field, only speed exceeding 0.25 m/s
a. Which indicates the mean path of the Kuroshio during 1993–2018 is shown; b. three typical paths of the Kuroshio south of Japan (i.e., the LM,oNLM and nNLM path); c. the composited sea level anomaly (SLA) field and current vector field in the Kuroshio extension’s elongated mode and contracted mode. The numbered geographic positions are: 1. Miyake-jima; 2. Hachijo-jima

图 2 负太平洋年代际涛动(PDO)指数的时间序列(a)和间隔3 d的基于海表面高度距平(SLA)数据在31°~36°N,140°~165°E范围内空间平均的黑潮延伸体(KE)指数(b)
Fig. 2 Time series of the negative Pacific decadal oscillation (PDO) index (a) and Kuroshio extension (KE) index based on the area-mean (31°~36°N, 140°~165°E) of the 3-day interval sea level anomaly (SLA) data (b)
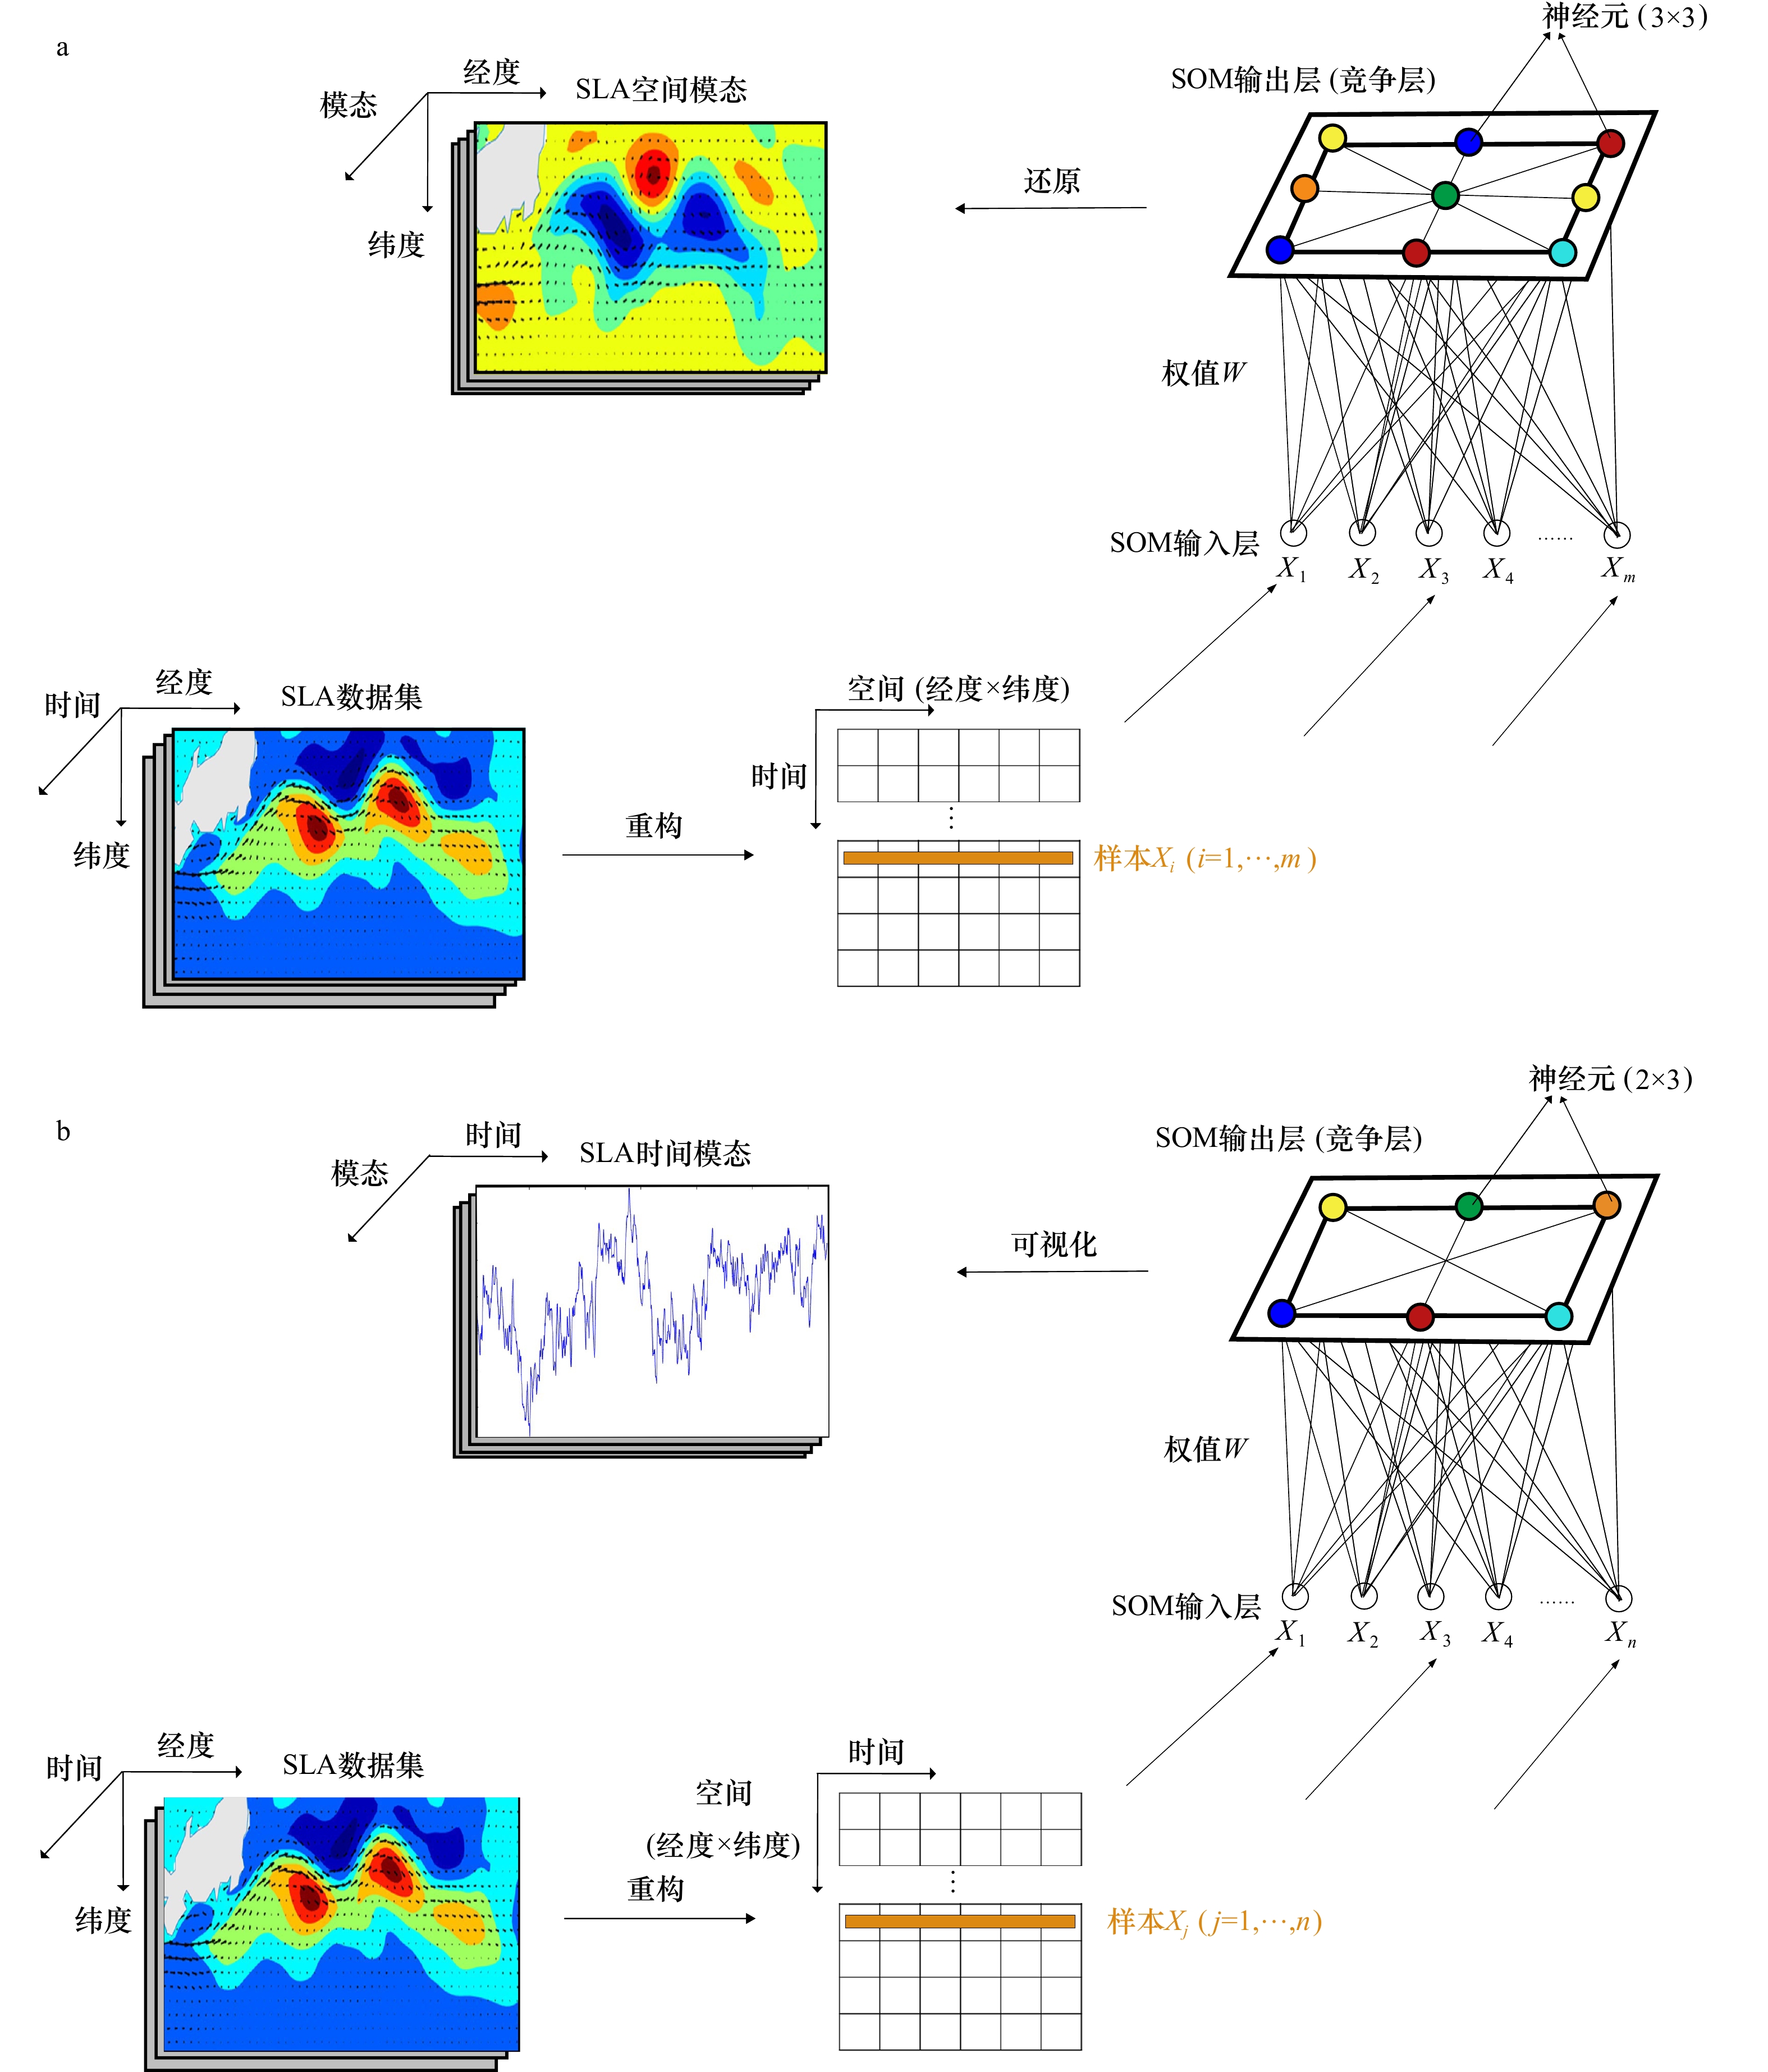
图 3 用于提取空间模态(3
$ \times $ 3,a)和时间模态(2$ \times $ 3,b)的自组织映射(SOM)训练流程示意图a和b的样本数据为海表面高度距平(SLA)的空间序列和时间序列
Fig. 3 Schematic of the (3
$ \times $ 3) self-organizing map (SOM) for the spatial pattern extraction (a), and the temporal pattern extraction (b)The sample vectors are the sea level anomaly (SLA) spatial series and temporal series in a and b respectively
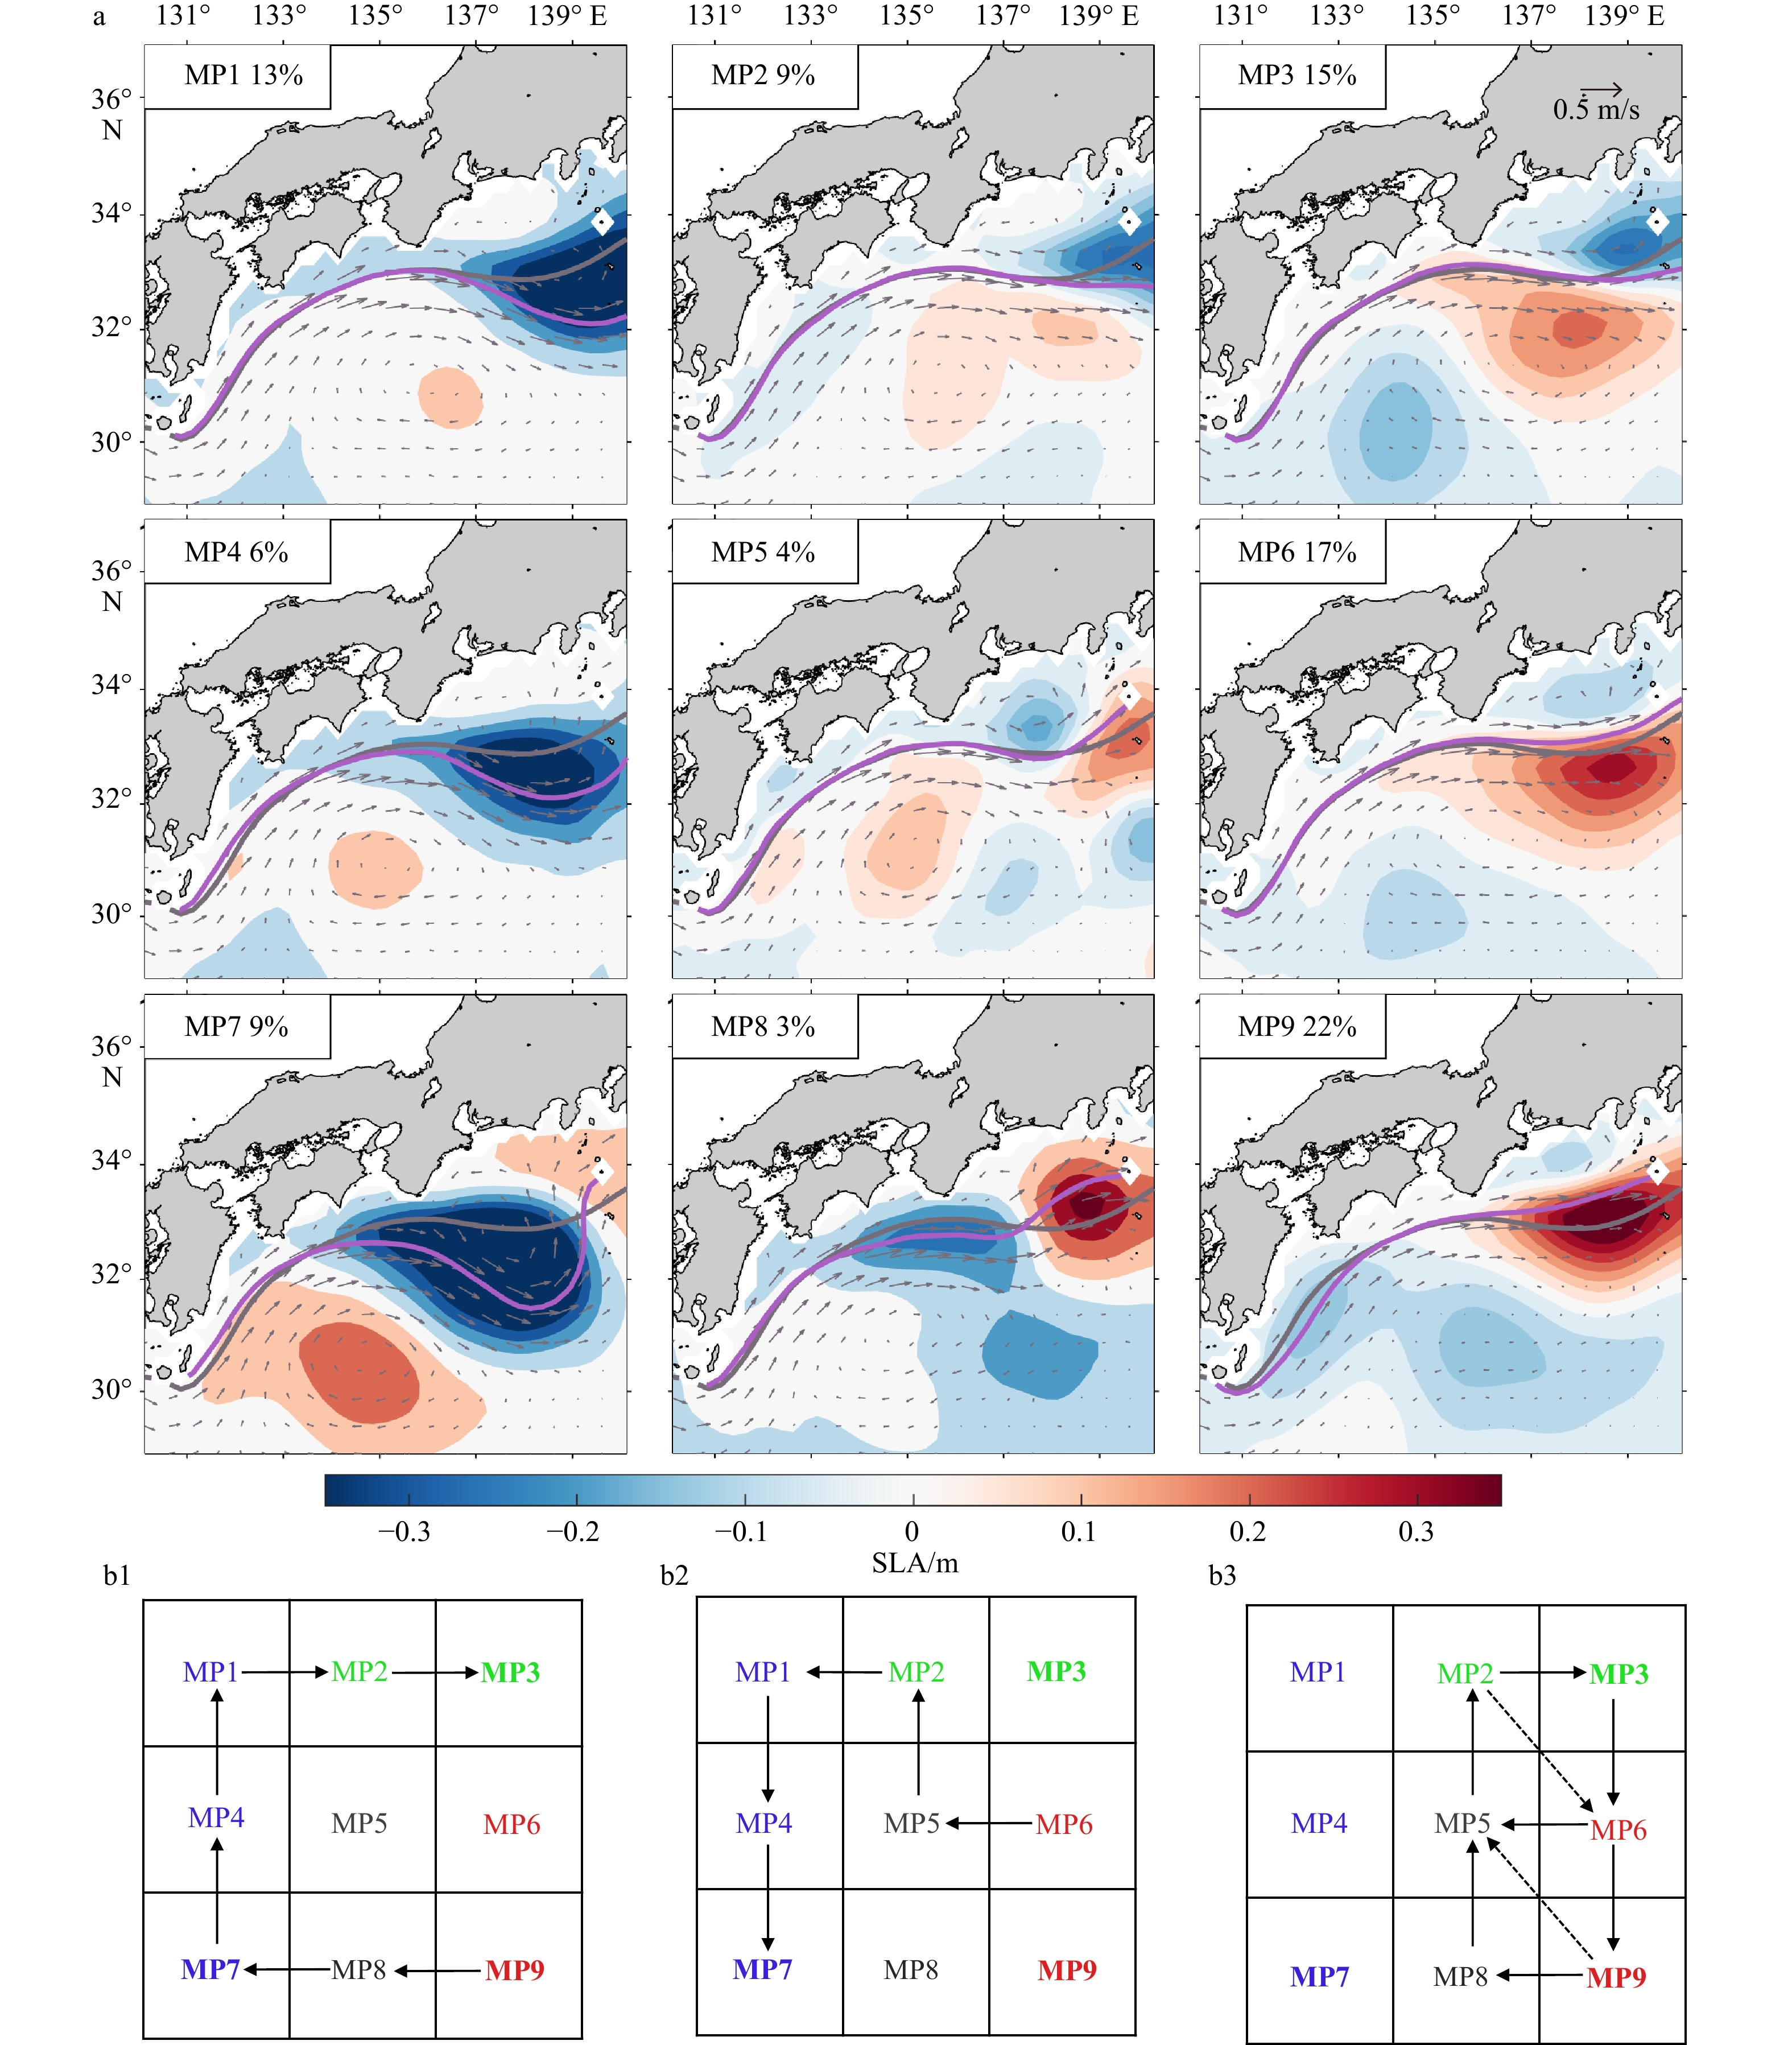
图 4 基于3 d间隔的海表面高度距平(SLA)数据的(3
$ \times $ 3)自组织映射分析提取的9组特征模态(MP1–MP9)(a)和最佳匹配单元移动轨迹(b)a中各模态的出现频率以百分数的形式标注在左上角,黑潮路径采用1 m的海表面高度等值线表示,灰色实线为多年平均路径,紫色实线为当前模态路径,灰色箭头为当前模态的地转速度场。b中蓝、绿、红分别代表大弯曲、离岸的非大弯曲、近岸的非大弯曲 3个路径,加粗的MP3、MP7、MP9为3种典型路径的成熟态。b1和b2分别为2004年和2017年两次大弯曲发生的最佳匹配单元迁移轨迹;b3为非大弯曲路径时通常的最佳匹配单元轨迹
Fig. 4 Nine spatial patterns (MP1–MP9) extracted from the 3-day interval sea level anomaly (SLA) data south of Japan through the (3
$ \times $ 3) self-organizing map analysis (a) and trajectory of the best matching unit (b)In a, the frequency of occurrence is given as a percentage number at the upper left corner of each pattern, the Kuroshio axis is denoted by the 1 m sea surface height isoline, with the gray solid line denoting the time-mean axis and the purple solid line representing the axis in the associated self-organizing map pattern. The gray arrows denote the geostrophic velocity. In b, the blue, green and red lines represent the large meander, offshore non-large meander and nearshore non-large meander path, respectively. The MP3, MP7 and MP9 (in bold fonts) represent the mature state for the three typical paths. b1, b2 are the best matching unit migration tracks of large meander path occurring in 2004 and 2017, respectively; b3 is the best matching unit migration track of the non-large meander path

图 6 黑潮延伸体基于3 d间隔的海表面高度距平(SLA)数据的(3
$ \times $ 3)自组织映射分析提取的9组特征模态(KP1−KP9)(a); KP1−KP9各自的KE指数大小(b); KE的最佳匹配单元序列(c)b中KE指数大小用于各模态稳定性的评估;c中时间间隔为3 d,纵坐标上的模态从下至上稳定程度依次提高
Fig. 6 The nine spatial patterns (KP1−KP9) extracted from the 3-day interval sea level anomaly (SLA) data in the Kuroshio extension region using the (3
$ \times $ 3) self-organizing map analysis (a); KE index of KP1−KP9 (b); best matching unit series of the KE (c)In b, KE index is used to evaluate the stability of each pattern; in c, the interval is 3-day, the stability of the patterns (the y-axis) gradually increases from the bottom to the top
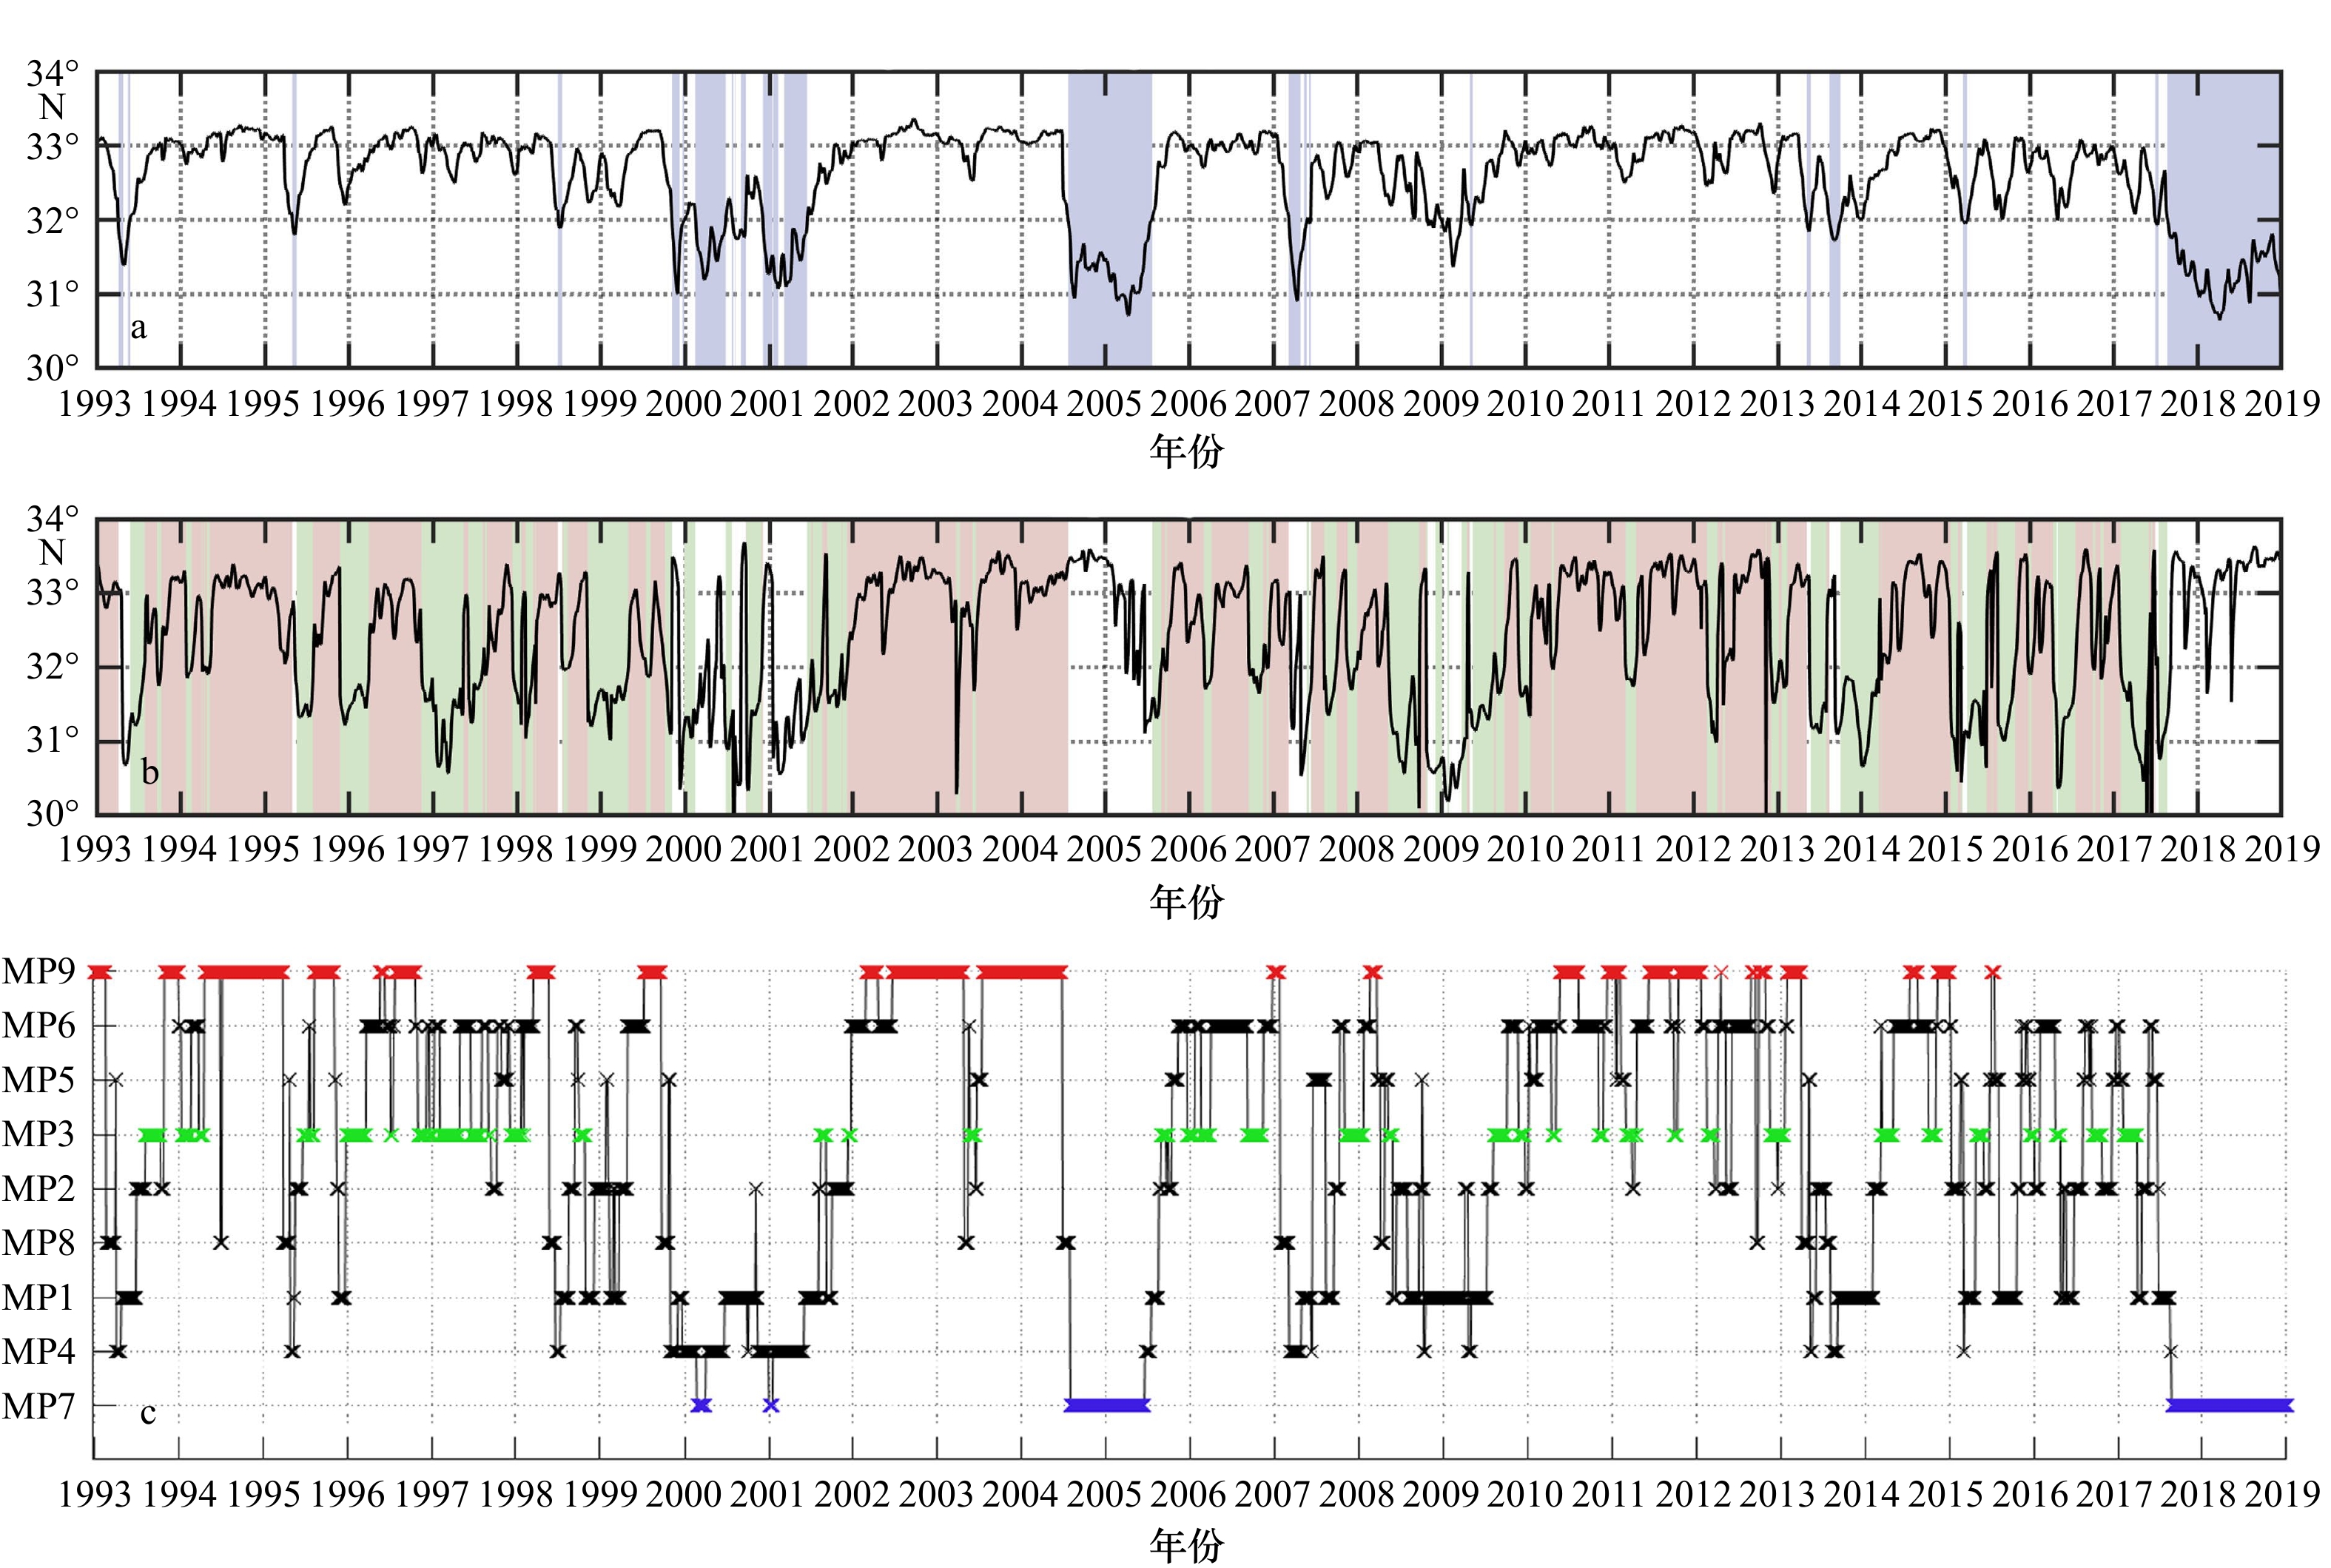
图 5 黑潮流轴最南端纬度位置变化的时间序列
a. 流轴在136°~139°E范围内的位置变化;b. 流轴在140°~142°E范围内的位置变化;c. 黑潮的最佳匹配单元序列,时间间隔为3 d。a、b中的蓝色、绿色、红色阴影分别表示大弯曲、离岸的非大弯曲、近岸的非大弯曲路径的发生。c中的蓝叉、绿叉、红叉和黑叉分别标注成熟的大弯曲、离岸的非大弯曲、近岸的非大弯曲路径和一般路径
Fig. 5 Time series of the southernmost position axis of the Kuroshio axis
a. Jet position anomaly between 136°E and 139°E; b. jet position anomaly between 140°E and 142°E; c. best matching unit series of the Kuroshio south of Japan. The blue, green and red shading bars denote the period of the large meander, offshore non-large meander and nearshore non-large meander path in a and b, respectively. The blue, green and red corss marks denote the large meander, offshore non-large meander and nearshore non-large meander paths in c, respectively
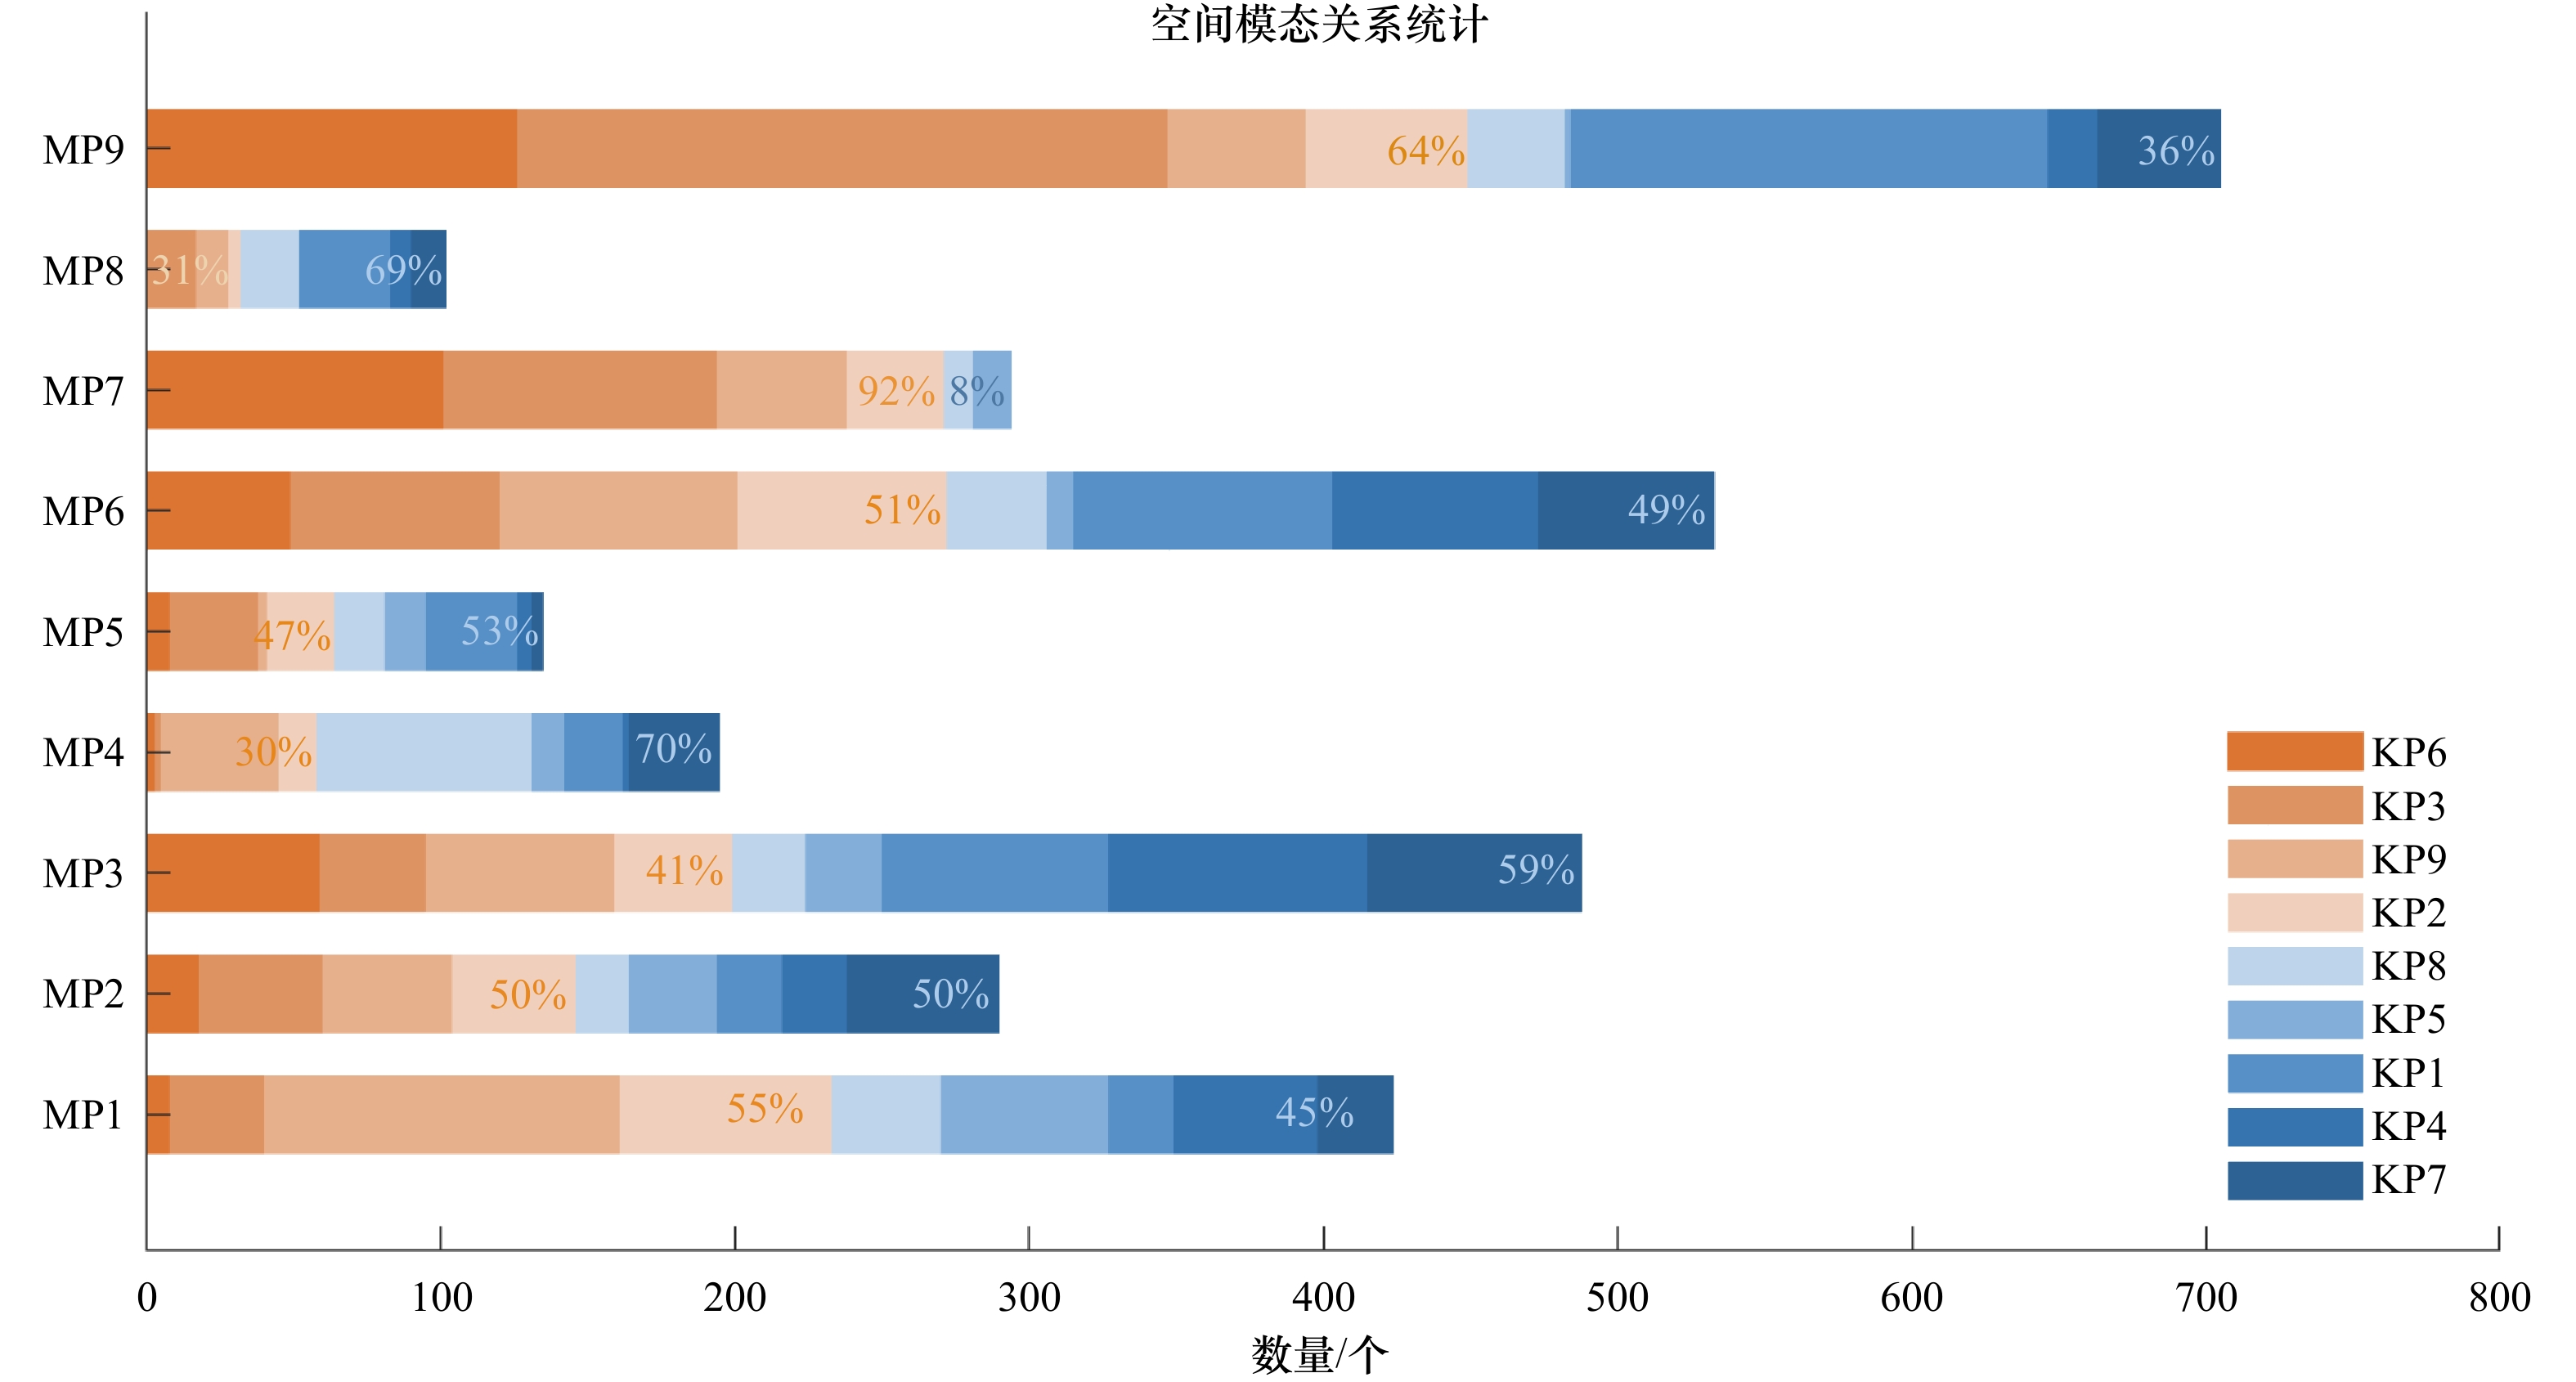
图 7 黑潮各模态(MP1–MP9)下的黑潮延伸体模态(KP1–KP9)数量的柱状统计
橙(蓝)色为稳定(不稳定)态,黑潮延伸体(KE)模态的颜色越深越稳定(不稳定),KE稳定(不稳定)态在各黑潮模态中所占的比例做了标注
Fig. 7 Histogram of the occurrences of the Kuroshio extension patterns (KP1–KP9) under each Kuroshio pattern (MP1–MP9)
The orange (blue) bars denote stable (unstable) Kuroshio extension (KE) patterns. Darker orange (blue) represents more stable (unstable) KE patterns. The proportions of the stable and unstable patterns during each Kuroshio pattern are marked in the bars
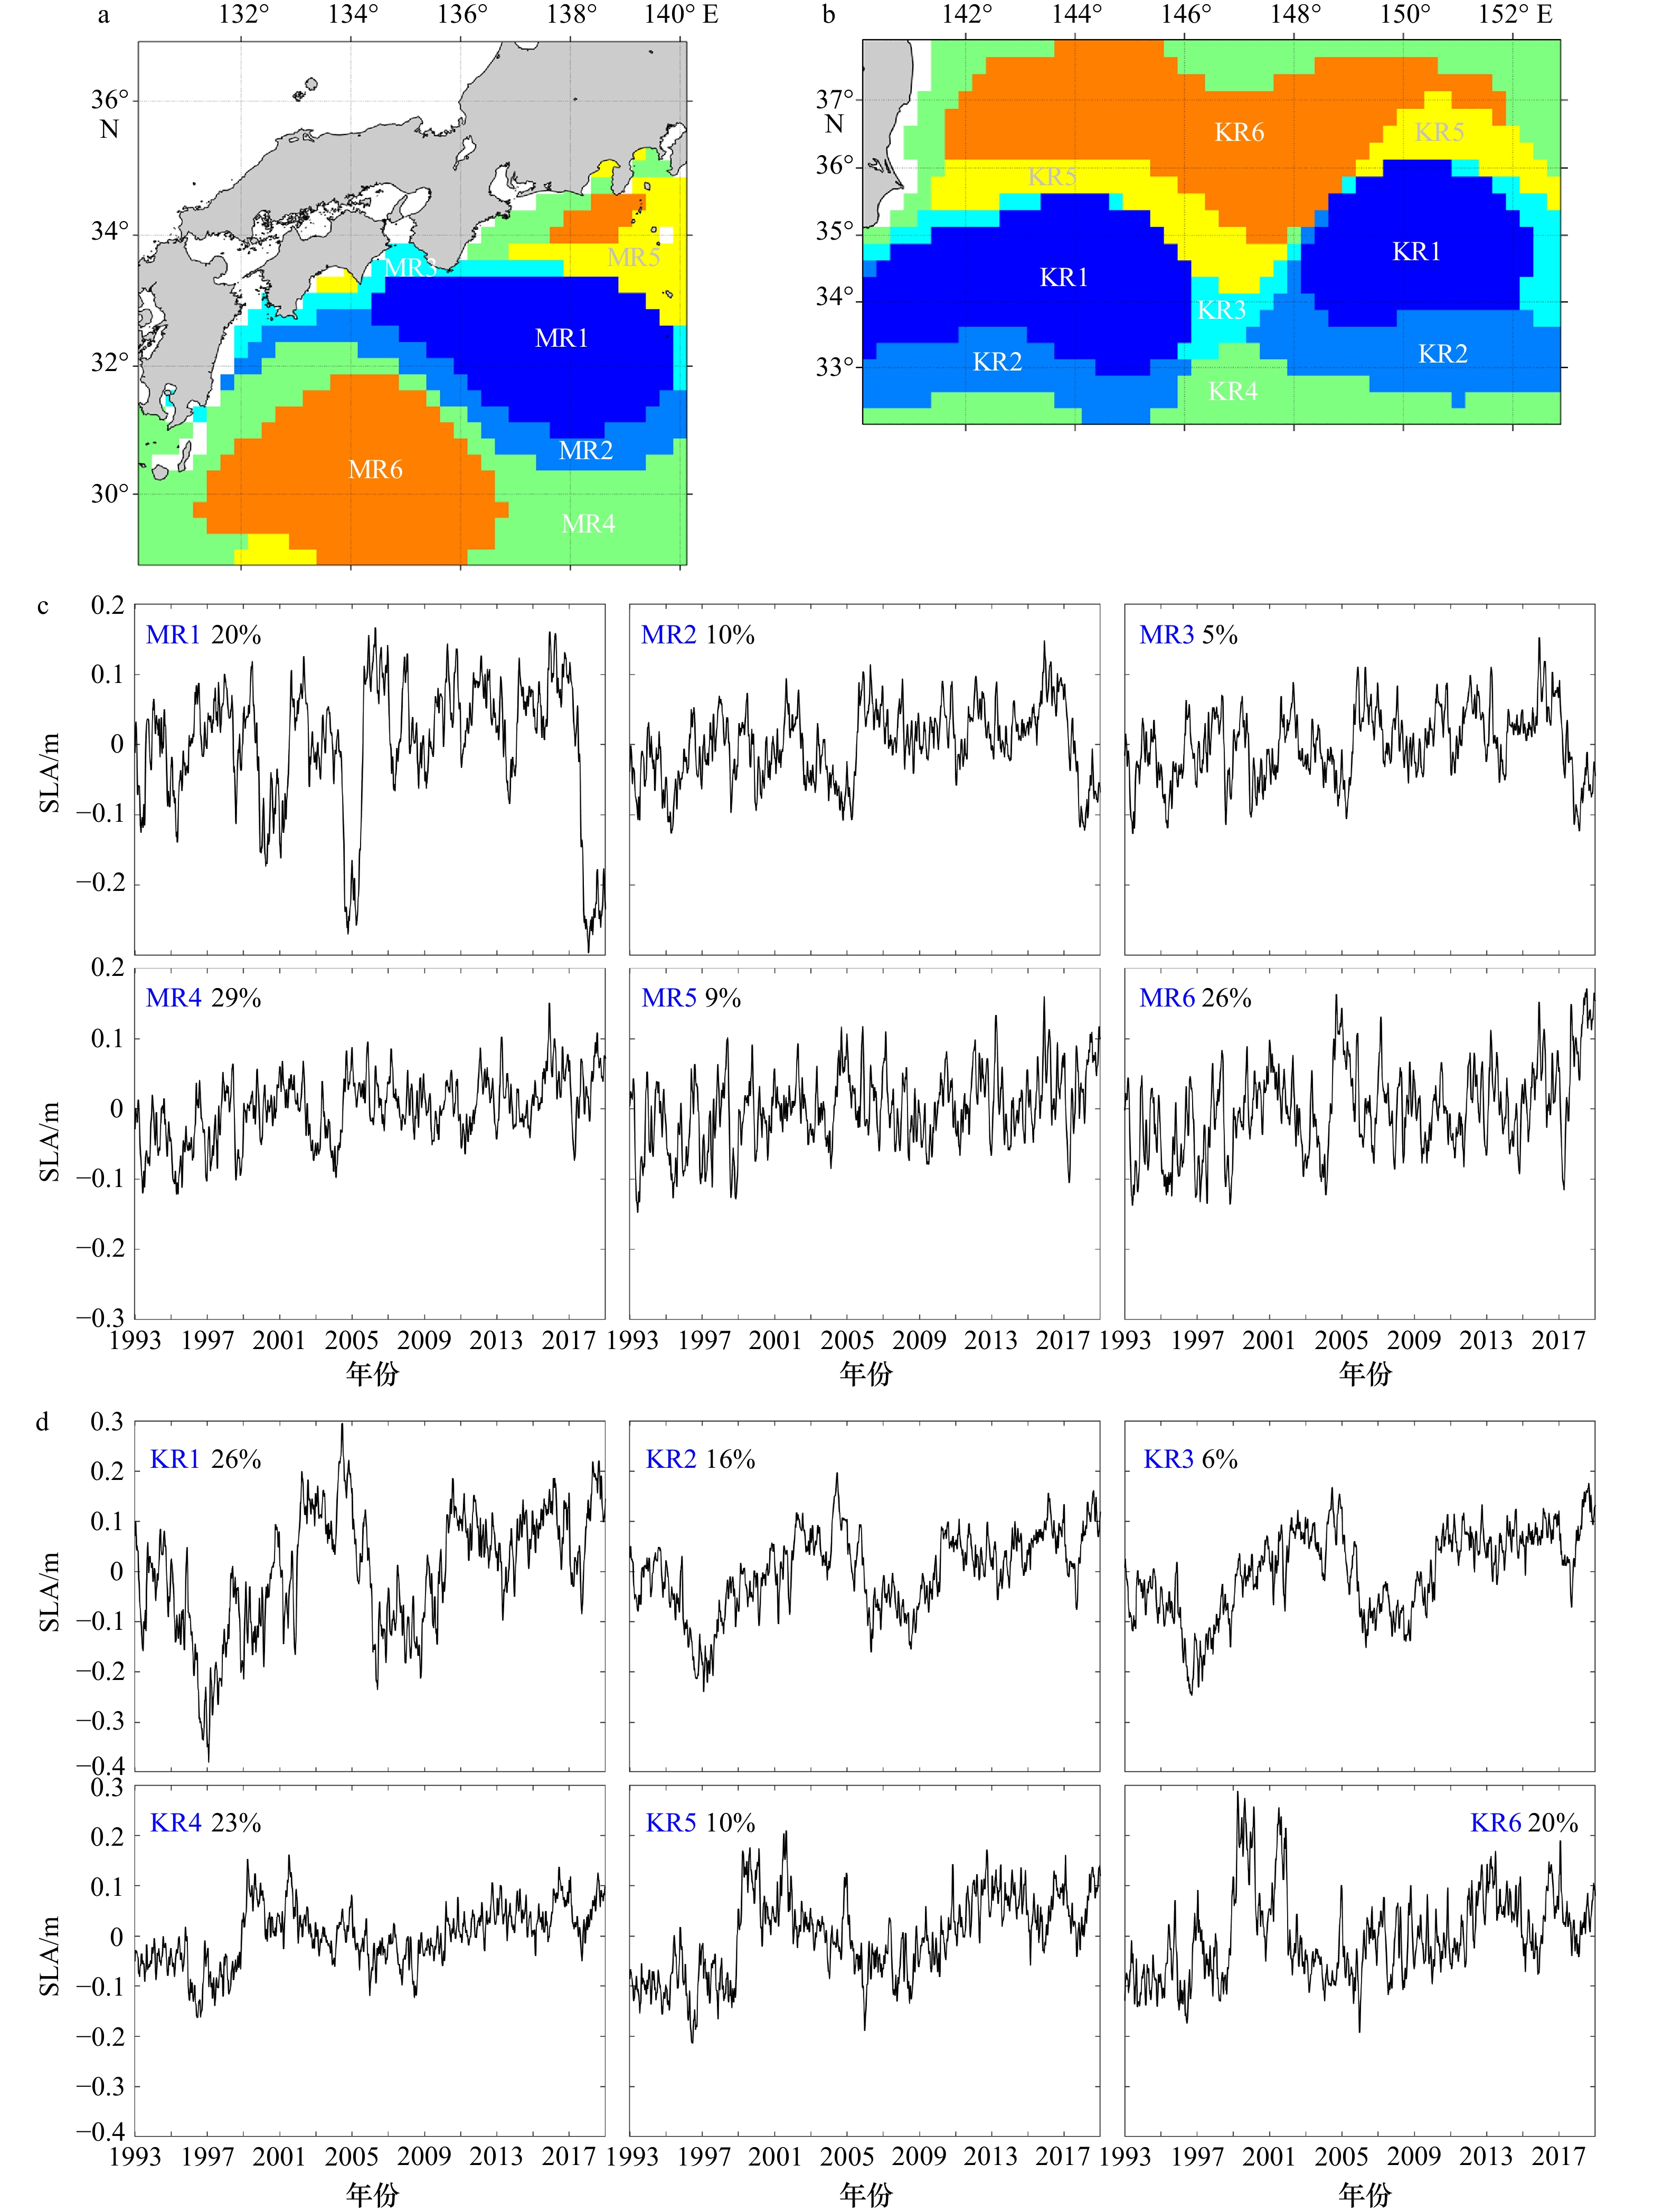
图 8 (2
$ \times $ 3)自组织映射所识别的日本南部黑潮海域海表面高度距平(SLA)变化特征区域(MR1–MR6)(a),(2$ \times $ 3)自组织映射所识别的黑潮延伸体海域SLA变化特征区域(KR1–KR6)(b), MR1–MR6的SLA时间序列(c),KR1–KR6的SLA时间序列(d)Fig. 8 Typical regions of sea level anomaly (SLA) variability (MR1–MR6) in the Kuroshio region south of Japan identified with the (2
$ \times $ 3) self-organizing map (a), typical regions of SLA variability (KR1–KR6) in the Kuroshio extension region identified with the (2$ \times $ 3) self-organizing map (b), time series of SLA in the six typical regions (MR1–MR6) (c), time series of SLA in the six typical regions (KR1–KR6) (d)
图 9 黑潮大弯曲(LM)、离岸的非大弯曲(oNLM)、近岸的非大弯曲(nNLM)路径的海表面高度距平(SLA)合成场与流场(a);黑潮oNLM路径下,MR5的SLA负信号向 KR2传递,逐步与黑潮延伸体南部再循环流合并,减弱KE路径的稳定性(矩形框)(b)
Fig. 9 Composited sea level anomaly (SLA) and velocity maps during the large meander (LM), offshore non-large meander (oNLM) and nearshore non-large meander (nNLM) path states (a); snapshots in a case when the Kuroshio is in the offshore non-large meander (oNLM) path state. In the rectangle box, negative SLA signals move from MR5 to KR2 which later gradually merge into the southern recirculation gyre of the Kuroshio extension, and weaken the stability of the Kuroshio extension SLA (b)
表 1 黑潮在大弯曲(LM)、离岸的非大弯曲(oNLM)、近岸的非大弯曲(nNLM)路径下黑潮海表面高度距平(SLA)特征区(MR1–MR6)与黑潮延伸体的 SLA 特征区(KR1–KR6)的因果分析结果
Tab. 1 Information flow between the Kuroshio sea level anomaly (SLA) typical regions (MR1−MR6) and the Kuroshio extension SLA typical regions (KR1−KR6) during the large meander (LM), offshore non-large meander (oNLM) and nearshore non-large meander (nNLM) path states
路径 LM 方向 TMR$ \to $KR(TKR$ \to $MR) 区域 KR1 KR2 KR3 KR4 KR5 KR6 MR1 0.347(0.057) 0.111(0.150) 0.159(0.096) –0.118(0.034) –0.024(0.002) 0.244(–0.004) MR2 0.197(–0.093) –0.058(0.003) 0.019(–0.066) –0.018(–0.004) 0.001(0.017) 0.071(0.104) MR3 0.094(–0.124) –0.060(–0.079) –0.018(–0.112) 0.009(0.012) –0.007(0.070) –0.077(0.116) MR4 0.067(0.411) 0.126(0.377) 0.162(0.425) –0.041(0.352) –0.067(0.392) 0.003(–0.003) MR5 0.230(0.591) 0.214(0.530) 0.250(0.571) –0.070(0.352) –0.068(0.479) 0.139(–0.094) MR6 0.240(0.594) 0.209(0.331) 0.284(0.689) –0.066(0.293) –0.010(0.388) 0.146(–0.105) 路径 oNLM 方向 TMR$ \to $KR(TKR$ \to $MR) 区域 KR1 KR2 KR3 KR4 KR5 KR6 MR1 –0.086(–0.153) 0.037(–0.110) 0.188(–0.143) 0.180(–0.036) 0.171(–0.057) 0.106(0.001) MR2 0.006(–0.265) 0.114(–0.202) 0.256(–0.248) 0.229(–0.046) 0.223(–0.078) 0.137(0.025) MR3 0.108(–0.160) 0.274(–0.103) 0.264(–0.113) 0.227(0.034) 0.204(0.017) 0.114(0.046) MR4 0.161(–0.473) 0.327(–0.487) 0.264(–0.488) 0.245(–0.298) 0.201(–0.208) 0.114(–0.070) MR5 0.250(–0.318) 0.400(–0.360) 0.270(–0.297) 0.237(–0.229) 0.123(–0.099) 0.060(–0.075) MR6 0.191(–0.305) 0.389(–0.350) 0.200(–0.336) 0.237(–0.369) 0.106(–0.316) 0.082(–0.298) 路径 nNLM 方向 TMR$ \to $KR(TKR$ \to $MR) 区域 KR1 KR2 KR3 KR4 KR5 KR6 MR1 –0.010(–0.015) 0.005(–0.011) –0.017(0.045) –0.095(0.164) –0.101(0.156) –0.080(0.106) MR2 –0.023(–0.019) 0.001(–0.005) –0.003(0.057) –0.054(0.218) –0.048(0.221) 0.005(0.224) MR3 0.022(0.009) –0.004(0.023) 0.006(0.064) –0.025(0.175) –0.021(0.176) 0.066(0.185) MR4 0.011(0.000) 0.009(0.004) 0.017(0.026) 0.047(0.122) 0.029(0.121) 0.128(0.157) MR5 0.073(–0.006) 0.040(0.002) 0.051(0.025) 0.096(0.089) 0.057(0.083) 0.147(0.103) MR6 0.026(–0.009) 0.028(–0.016) 0.023(0.008) 0.090(0.052) 0.039(0.060) 0.138(0.088) 注:加粗数字表示通过了显著性水平为5%的信度检验。  下载: 导出CSV
-
[1] Qiu Bo, Chen Shuiming, Schneider N, et al. On the reset of the wind-forced decadal Kuroshio extension variability in late 2017[J]. Journal of Climate, 2020, 33(24): 10813−10828. doi: 10.1175/JCLI-D-20-0237.1 [2] Kawabe M. Sea level variations at the Izu Islands and typical stable paths of the Kuroshio[J]. Journal of the Oceanographical Society of Japan, 1985, 41(5): 307−326. doi: 10.1007/BF02109238 [3] Sugimoto S, Hanawa K. Relationship between the path of the Kuroshio in the south of Japan and the path of the Kuroshio extension in the east[J]. Journal of Oceanography, 2012, 68(1): 219−225. doi: 10.1007/s10872-011-0089-1 [4] Yang Yang, Liang X S. New perspectives on the generation and maintenance of the Kuroshio large meander[J]. Journal of Physical Oceanography, 2019, 49(8): 2095−2113. doi: 10.1175/JPO-D-18-0276.1 [5] Usui N, Tsujino H, Nakano H, et al. Formation process of the Kuroshio large meander in 2004[J]. Journal of Geophysical Research: Oceans, 2008, 113(C8): C08047. [6] Miyazawa Y, Guo Xinyu, Yamagata T. Roles of mesoscale eddies in the Kuroshio paths[J]. Journal of Physical Oceanography, 2004, 34(10): 2203−2222. doi: 10.1175/1520-0485(2004)034<2203:ROMEIT>2.0.CO;2 [7] Qiu Bo, Chen Shuiming. Variability of the Kuroshio extension jet, recirculation gyre, and mesoscale eddies on decadal time scales[J]. Journal of Physical Oceanography, 2005, 35(11): 2090−2103. doi: 10.1175/JPO2807.1 [8] Qiu Bo, Chen Shuiming. Eddy-mean flow interaction in the decadally modulating Kuroshio extension system[J]. Deep-Sea Research Part II: topical Studies in Oceanography, 2010, 57(13/14): 1098−1110. [9] Yang Yang, Liang X S. The instabilities and multiscale energetics underlying the mean-interannual-eddy interactions in the Kuroshio extension region[J]. Journal of Physical Oceanography, 2016, 46(5): 1477−1494. doi: 10.1175/JPO-D-15-0226.1 [10] Qiu Bo. The Kuroshio extension system: its large-scale variability and role in the midlatitude ocean-atmosphere interaction[J]. Journal of Oceanography, 2002, 58(1): 57−75. doi: 10.1023/A:1015824717293 [11] Yang Haiyuan, Qiu Bo, Chang Ping, et al. Decadal variability of eddy characteristics and energetics in the Kuroshio extension: unstable versus stable states[J]. Journal of Geophysical Research: Oceans, 2018, 123(9): 6653−6669. doi: 10.1029/2018JC014081 [12] Qiu Bo, Chen Shuiming, Schneider N, et al. A coupled decadal prediction of the dynamic state of the Kuroshio extension system[J]. Journal of Climate, 2014, 27(4): 1751−1764. doi: 10.1175/JCLI-D-13-00318.1 [13] Qiu Bo. Kuroshio extension variability and forcing of the pacific decadal oscillations: responses and potential feedback[J]. Journal of Physical Oceanography, 2003, 33(12): 2465−2482. doi: 10.1175/1520-0485(2003)033<2465:KEVAFO>2.0.CO;2 [14] Liu Yonggang, Weisberg R H. Ocean currents and sea surface heights estimated across the West Florida Shelf[J]. Journal of Physical Oceanography, 2007, 37(6): 1697−1713. doi: 10.1175/JPO3083.1 [15] Jin Baogang, Wang Guihua, Liu Yonggang, et al. Interaction between the East China Sea Kuroshio and the Ryukyu current as revealed by the self-organizing map[J]. Journal of Geophysical Research: Oceans, 2010, 115(C12): C12047. doi: 10.1029/2010JC006437 [16] Liu Yonggang, Weisberg R H, Vignudelli S, et al. Patterns of the loop current system and regions of sea surface height variability in the eastern Gulf of Mexico revealed by the self-organizing maps[J]. Journal of Geophysical Research: Oceans, 2016, 121(4): 2347−2366. doi: 10.1002/2015JC011493 [17] Ma Fang, Diao Yi’na, Luo Dehai. Spatiotemporal characteristics of the sea level anomaly in the Kuroshio extension using a self-organizing map[J]. Atmospheric and Oceanic Science Letters, 2016, 9(6): 471−478. doi: 10.1080/16742834.2016.1235462 [18] Dong Zibo, Yang Dazhi, Reindl T, et al. Satellite image analysis And a hybrid ESSS/ANN model to forecast solar irradiance in the tropics[J]. Energy Conversion and Management, 2014, 79: 66−73. doi: 10.1016/j.enconman.2013.11.043 [19] 白玫, 吴辉. 利用SOM神经网络研究长江口邻近海域海表温度特征[J]. 华东师范大学学报(自然科学版), 2018(4): 184−194.Bai Mei, Wu Hui. Characteristics of sea surface temperature in the Changjiang Estuary and adjacent waters based on a self-organizing map[J]. Journal of East China Normal University (Natural Science), 2018(4): 184−194. [20] 罗未萌, 钱维宏, 蒋宁, 等. SOM方法在中国东部夏季降水分型中的应用[J]. 北京大学学报(自然科学版), 2018, 54(5): 970−982.Luo Weimeng, Qian Weihong, Jiang Ning, et al. Application of SOM method in summer precipitation patterns in eastern China[J]. Acta Scientiarum Naturalium Universitatis Pekinensis, 2018, 54(5): 970−982. [21] 吴胜男, 江志红. 基于自组织映射的长江中下游夏季天气分型及其降水特征[J]. 气象科学, 2019, 39(5): 588−598.Wu Shengnan, Jiang Zhihong. Synoptic classification and precipitation characteristics in summer over the Yangtze River Basin based on self-organizing map[J]. Journal of the Meteorological Sciences, 2019, 39(5): 588−598. [22] Richardson A J, Risien C, Shillington F A. Using self-organizing maps to identify patterns in satellite imagery[J]. Progress in Oceanography, 2003, 59(2/3): 223−239. [23] Liu Yonggang, Weisberg R H, Mooers C N K. Performance evaluation of the self-organizing map for feature extraction[J]. Journal of Geophysical Research: Oceans, 2006, 111(C5): C05018. [24] Liang X S. Information flow and causality as rigorous notions ab initio[J]. Physical Review E, 2016, 94(5): 052201. doi: 10.1103/PhysRevE.94.052201 [25] Liang X S. Unraveling the cause-effect relation between time series[J]. Physical Review E, 2014, 90(5): 052150. doi: 10.1103/PhysRevE.90.052150 [26] Stips A. On the causal structure between CO2 and global temperature[J]. Scientific Reports, 2016, 6: 21691. doi: 10.1038/srep21691 [27] Xiao Haixia, Zhang Feng, Miao Lijuan, et al. Long-term trends in Arctic surface temperature and potential causality over the last 100 years[J]. Climate Dynamics, 2020, 55(5/6): 1443−1456. [28] Granger C W J. Investigating causal relations by econometric models and cross-spectral methods[J]. Econometrica, 1969, 37(3): 424−438. doi: 10.2307/1912791 [29] Liang X S. Information flow within stochastic dynamical systems[J]. Physical Review E, 2008, 78(3): 031113. doi: 10.1103/PhysRevE.78.031113 [30] Liang X S. Normalizing the causality between time series[J]. Physical Review E, 2015, 92(2): 022126. [31] Rong Yineng, Liang X S. Panel data causal inference using a rigorous information flow analysis for homogeneous, independent and identically distributed datasets[J]. IEEE Access, 2021, 9: 47266−47274. doi: 10.1109/ACCESS.2021.3068273 -


计量
- 文章访问数: 665
- HTML全文浏览量: 228
- PDF下载量: 86
- 被引次数: 0
