

Transcriptome analysis identifies candidate genes related to albinism mechanism in the skin of the Picasso clownfish
-
摘要: 毕加索小丑鱼(Picasso clownfish)因其皮肤中的白色斑块分布杂乱抽象而得名,同时也由于其白色斑块的形成无规律性和稀缺性,属于名贵的小丑鱼,因此,解析毕加索小丑鱼的皮肤白斑形成机制,可以为毕加索小丑鱼的人工育种提供理论依据。在本研究中,我们对3种体色毕加索小丑鱼的背鳍和臀鳍之间的身体相同部位3种色块(黑色、黄色、白色)的皮肤进行进行了转录组测序。研究结果显示,与黄色和黑色皮肤组织相比,在白色皮肤组织中存在大量差异表达基因。其中与黑色素产生相关的信号通路(例如黑色素生成、Hedgehog信号通路和Wnt信号通路)中的基因在白色皮肤组织中呈下调表达趋势。进一步对3种颜色皮肤组织中参与黑色素生成途径的基因进行详细分析,发现上游调控基因(如ednrba和mitfa)表达量从黑色到黄色至白色皮肤组织中逐步下调,但下游参与黑色素合成的核心基因(包括tyr、tyrp1b和dct)则在白色皮肤组织中表达出现显著下调。最后,本研究通过荧光定量PCR验证了转录组数据的可靠性。本研究结果将为今后人为干扰基因表达从而达到调控小丑鱼体色提供理论依据。Abstract: Picasso clownfish is named for its disorderly and abstract distribution of white patches in its skin. At the same time, due to the irregular and scarce formation of white patches, it belongs to a valuable clownfish. Therefore, analyzing the formation mechanism of skin white spots in Picasso clownfish can provide a theoretical basis for the artificial breeding of Picasso clownfish. In this study, we sequences the transcriptome of the skin of three color blocks (black, yellow and white) in the same part of the body between the dorsal fin and hip fin of Picasso clownfish. The results show that there are a large number of differentially expressed genes (DEGs) in white skin compared with yellow and black skin. Among them, the genes in the signal pathways related to melanin production (such as melanin production, hedgehog and Wnt signal pathways) show a downward trend in white skin tissue. The expression of upstream regulatory genes (such as ednrba and mitfa) decrease gradually from black to yellow to white skin tissue, but the expression of downstream core genes involved in melanin synthesis (including Tyr, tyrp1b and dct) decreases significantly in white skin assembly. Finally, the validity of transcriptome data is verified by fluorescence quantitative PCR. The results of this study will provide a theoretical basis for future people to interfere with gene expression to regulate clownfish body color.
-
Key words:
- albinism /
- Picasso clownfish /
- transcriptome sequencing /
- differentially expressed gene
-
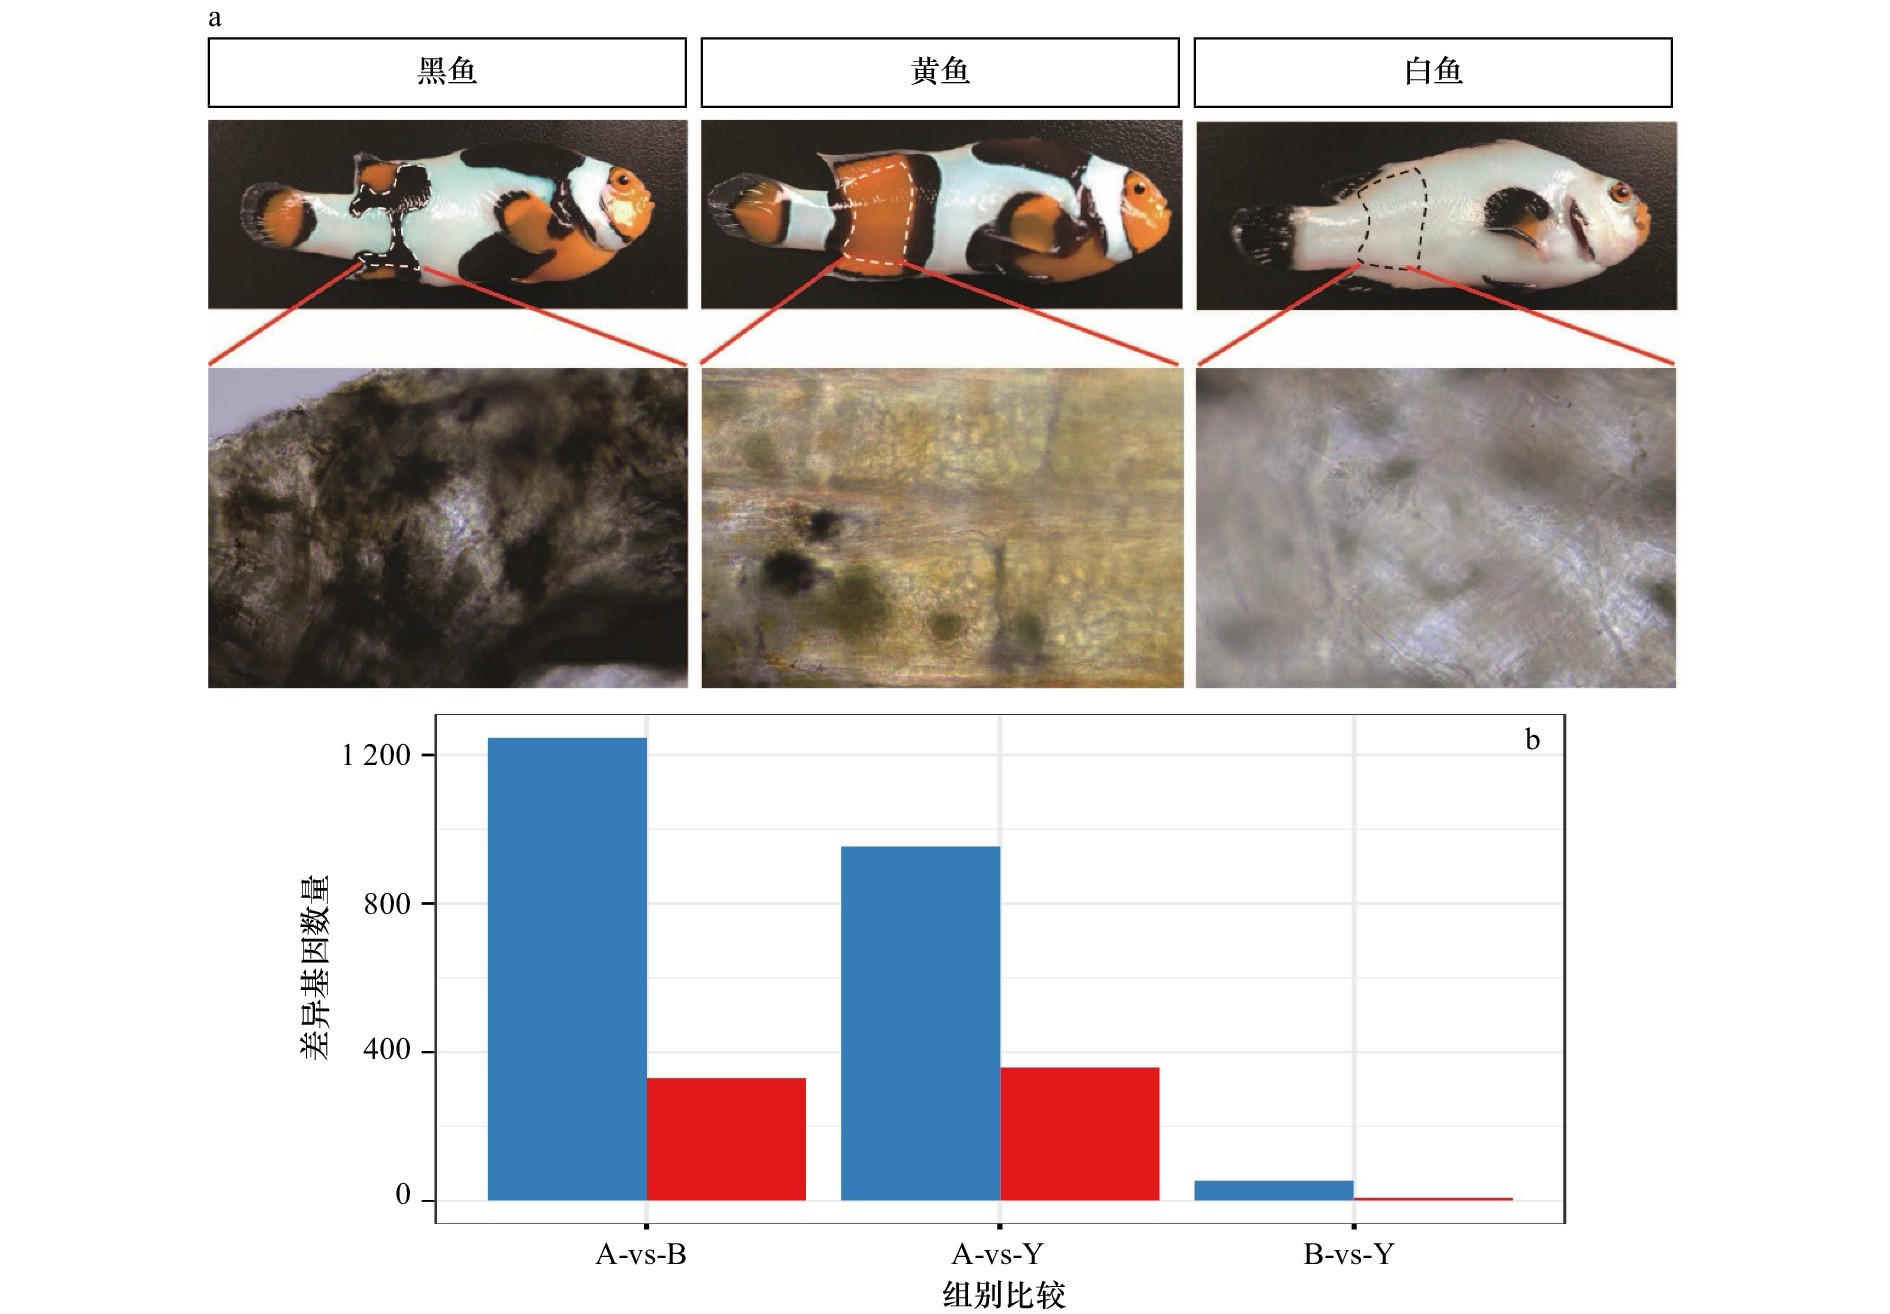
图 1 3种小丑鱼皮肤组织的表型差异以及基因表达差异
a. 对3种鱼在胸鳍与臀鳍身体两侧之间相同部位(白色、黄色、黑色的皮肤组织)进行取样的组织形态图;b. 白色、黑色和黄色样本差异表达的基因数量比较柱状图(红色代表上调基因,蓝色代表下调基因);图中A表示白色皮肤组织,B表示黑色皮肤组织,Y表示黄色皮肤组织
Fig. 1 Phenotypic differences and gene expression differences in skin tissues from three species of Picasso clownfish
a. Histomorphogram of the sample locations from the same parts (white, yellow, and black skin tissues) between the pectoral and anal fins of the three fish species; b. the histogram of the number of differentially expressed genes in the white, black and yellow samples (red represents up-regulated genes, blue represents down-regulated genes); A represents white skin tissue, B represents black skin tissue, and Y represents yellow skin tissue

图 2 基于差异表达基因对3种样本和基因进行层次聚类
对3种颜色的皮肤样品组间的差异基因绘制基因表达值的热图,并进行聚类分析,结果显示,相同组别的样品能聚为一类,说明这些组间的差异基因能够反映组间的核心差异;图中蓝色与红色分别代表了低表达与高表达基因,A表示白色皮肤组织,B表示黑色皮肤组织,Y表示黄色皮肤组织
Fig. 2 Hierarchical clustering of 3 samples and genes using differentially expressed genes
A heatmap of gene expression values is drawn for the differential genes between the three color skin sample groups, and cluster analysis is performed, the results show that the samples of the same group can be grouped into one category, indicating that the differential genes between these groups can reflect the core differences between the groups; blue and red in the figure represent low- and high-expressed genes, and A represents white skin tissue, B represents black skin tissue, Y represents yellow skin tissue
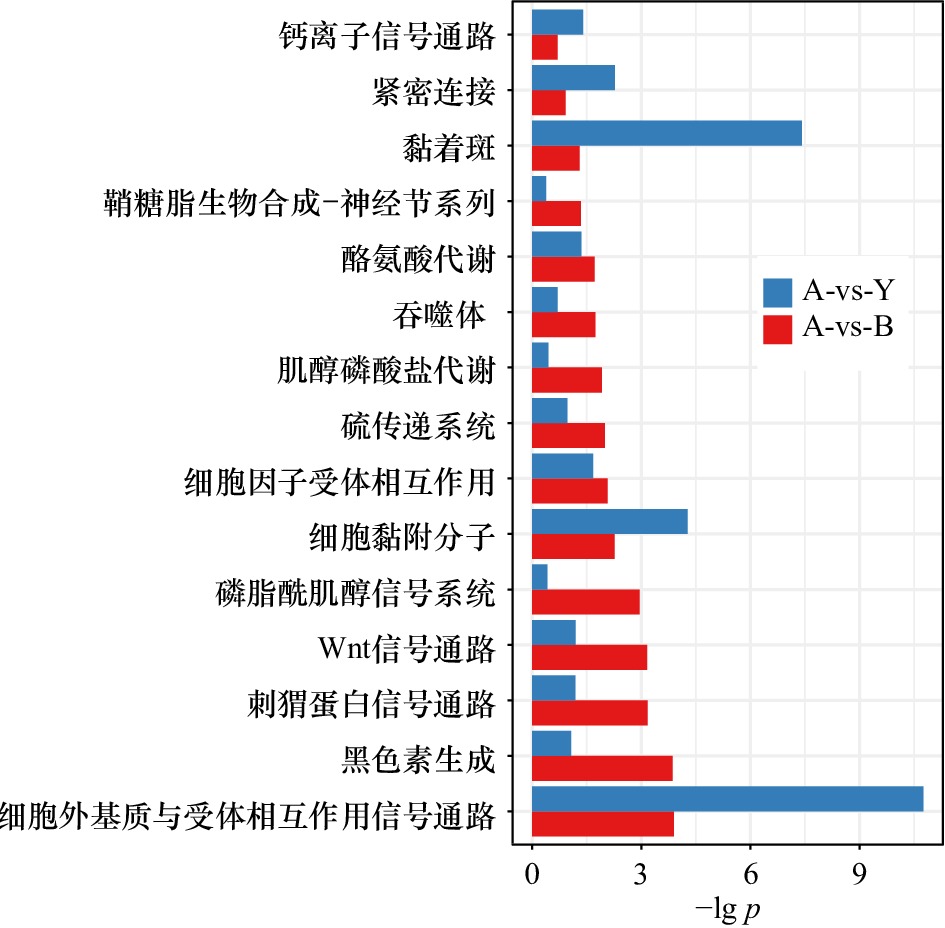
图 3 基于白色−黄色(A-vs-Y)和白色−黑色(A-vs-B)皮肤组织的组间差异表达基因生物学功能富集
分别将白色皮肤与黄色皮肤之间、白色皮肤与黑色皮肤之间的差异基因进行生物学功能富集分析,结果以柱状图的形式体现;图中的纵坐标表示生物学功能类目,横坐标表示对显著性p进行对数计算后的值;柱状图中蓝色表示白色−黄色皮肤组织的组间差异表达基因功能富集结果;红色表示白色−黑色组间差异表达基因功能富集结果
Fig. 3 Biological function enrichment of intergroup differentially expressed genes based on white-yellow (A-vs-Y) and white-black (A-vs-B) skin tissues
The differential genes between white skin and yellow skin , white skin and black skin are analyzed by biological function enrichment analysis, and the results are shown in the form of a histogram; the ordinate in the figure represents the biological function category, and the abscissa represents the right statistical significance p is calculated by logarithm; blue in the histogram represents the enrichment results of differentially expressed genes between white skin and yellow skin tissues; red represents the enrichment results of differentially expressed genes between white group and black group
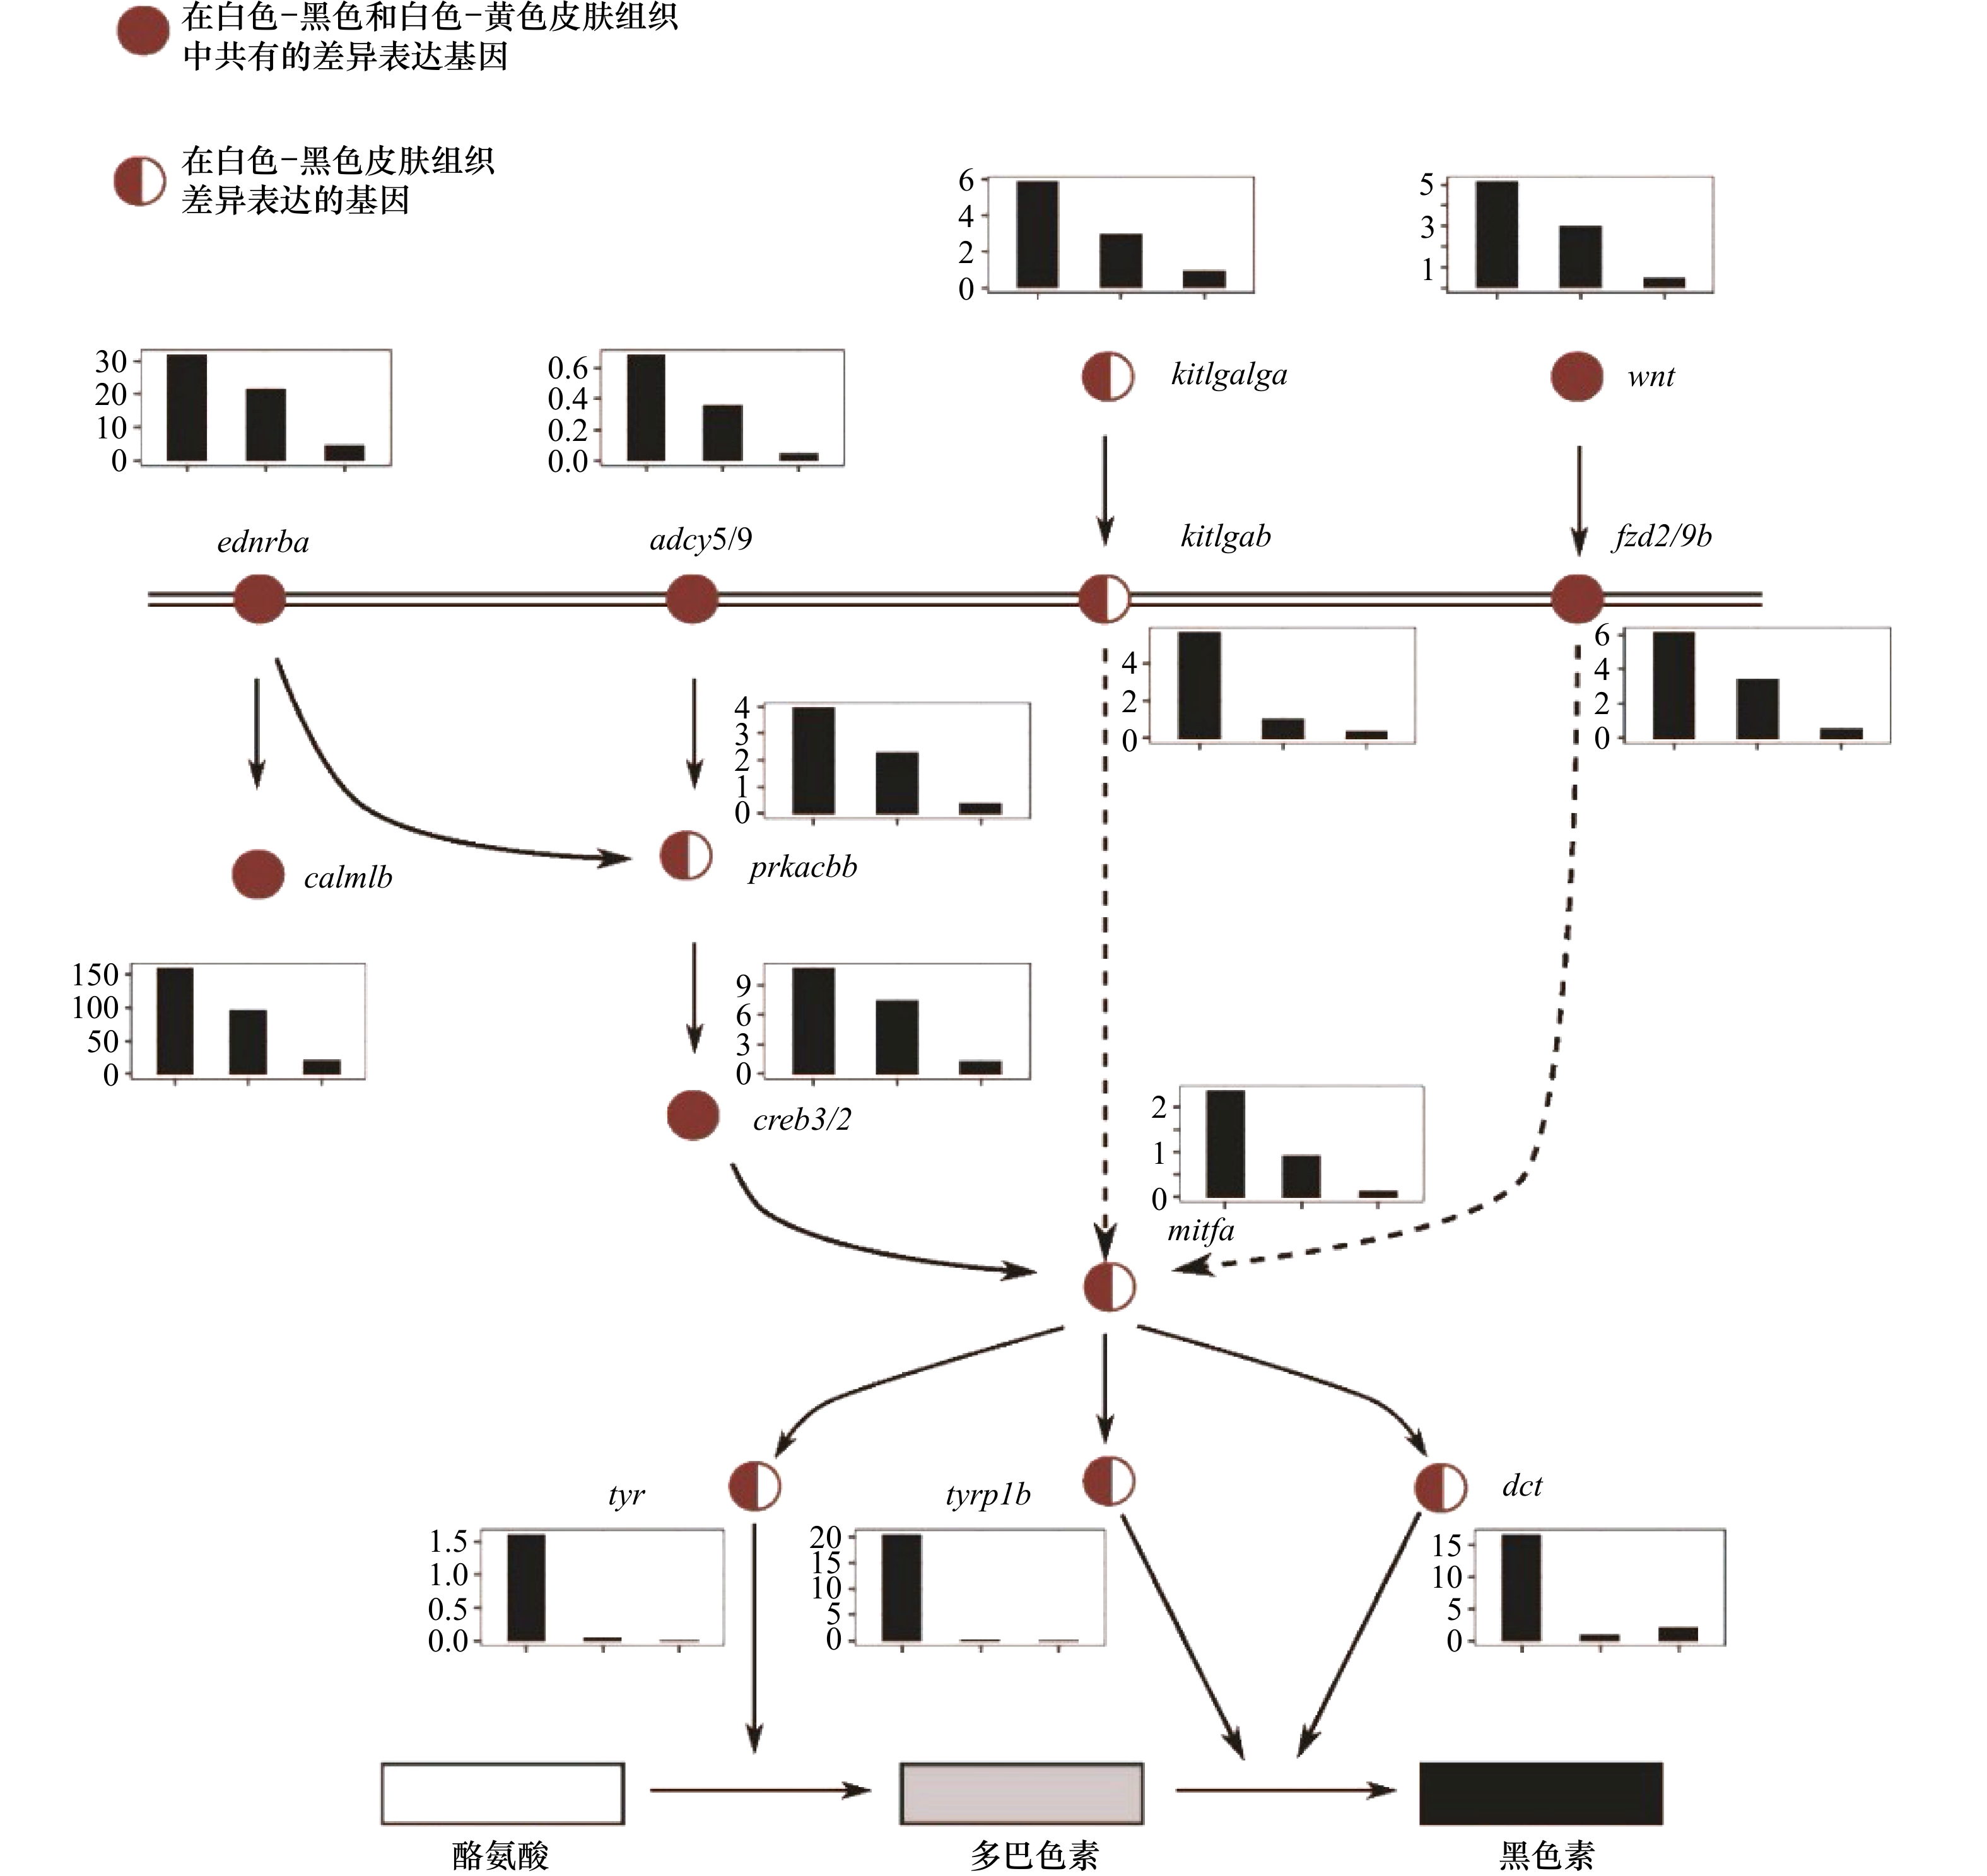
图 4 参与黑色素生成的关键功能基因的表达
利用KEGG中黑色素生成的信号通路图绘制差异基因的表达量,结果显示,参与黑色素合成的基因在白化皮肤中的表达水平出现了明显的降低;基因表达值的柱状图中,横坐标为皮肤样品分组:黑色、黄色、白色,纵坐标为基因表达值
Fig. 4 Gene expression for key functional genes involved in the melanogenesis
The genes related to the melanin production signal pathways involved in the differentially expressed gene set are displayed according to the KEGG signal pathway network diagram, the results show that the expression levels of genes involves in melanin synthesis in albino skin decreases significantly, gene expression in the histogram of values, the abscissa is the skin sample grouping: black, yellow, and white, the ordinate is the gene expression value
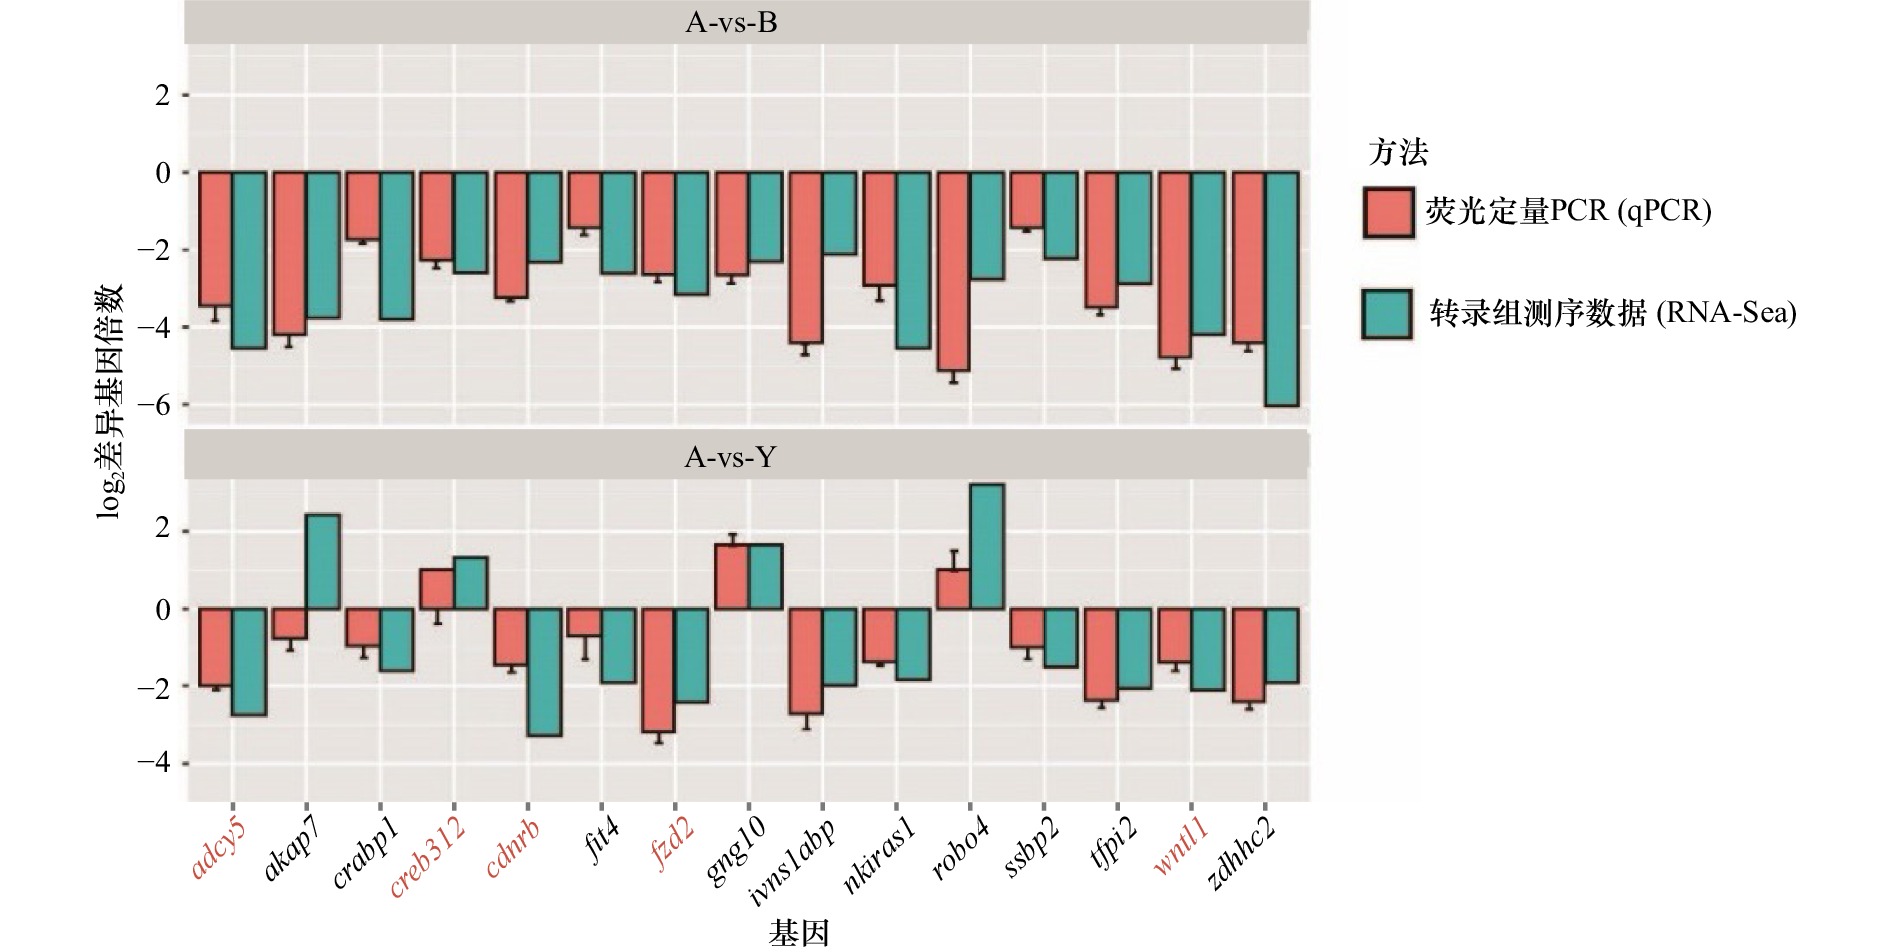
图 5 参与黑色素生成的关键功能基因的验证
对3种皮肤中参与黑色素生成的关键功能基因进行了qPCR定量检测,并且与RNA-Seq结果进行了比较,结果显示,qPCR检测的结果与RNA-Seq结果趋势一致;柱状图中橙色为qPCR结果,绿色为转录组测序结果;横坐标为基因名称、纵坐标为基因表达差异倍数的指数值
Fig. 5 Validation of key functional genes involved in melanin production
The qPCR quantitative detection of the three key functional genes involved in melanin production in the three skins is carried out and compared with the RNA-Seq results; the results show that the qPCR detection results are consistent with the RNA-Seq results, the orange in the histogram is the qPCR results, green is the results of transcriptome sequencing; the abscissa is the gene name, and the ordinate is the logarithm value of the gene expression difference multiple
表 1 参与 ECM 受体相互作用的基因表达量
Tab. 1 Expressions for genes involved in the ECM-receptor interactions
基因 黑色组 黄色组 白化组 p 黑色组−白化组 黄色组−白化组 黑色组−黄色组 lama4 9.987 78 9.551 99 1.912 65 0.048 021 0.003 065 8 − lamb2 2.030 23 1.908 29 0.240 762 0.010 657 − − lamc3 2.631 32 1.869 03 0.103 129 0.016 746 2.08×10⁻⁵ − thbs4a 4.882 85 4.003 67 0.478 414 0.004 048 3 0.030 008 − thbs3a 2.570 68 1.254 72 0.325 228 0.031 983 − − thbs1b 5.467 59 3.475 92 0.604 727 0.025 22 0.024 468 − thbs2a 10.35 64 10.496 1.277 17 0.006 781 1 0.001 110 6 − vtna 2.027 04 2.436 56 11.291 6 0.003 468 3 0.002 593 6 − tnn 6.482 15 6.320 78 0.590 092 0.001 820 7 − − agrn 8.560 42 5.392 49 0.883 212 0.003 222 3 0.010 75 − 注:−代表p值大于0.05,差异不显著。  下载: 导出CSV
表 2 参与色素沉积过程的基因表达量
Tab. 2 Expressions for genes involved in the pigmentation process
基因 黑色组 黄色组 白化组 p 黑色组−白化组 黄色组−白化组 黑色组−黄色组 ctbp2a 6.801 22 7.092 78 1.113 95 0.036 481 0.028 891 − mchr2 3.631 97 3.477 461 0.014 295 0.011 072 − − nfkb1 15.722 4 11.551 2.368 45 0.017 66 − − oca2 4.023 96 4.049 391 0.029 648 0.010 23 − − pmela 32.245 9 0.477 803 1.195 4 0.005 307 1 − 0.003 714 6 psen2 12.918 4 7.191 93 1.428 85 0.004 749 − − sort1a 1.131 69 0.685 34 0.073 58 0.007 554 2 − − vdrb 3.722 03 1.365 91 0.326 538 0.013 358 − − 注:−代表p值大于0.05,差异不显著。
下载: 导出CSV
-
[1] Braasch I, Volff J N, Schartl M. The evolution of teleost pigmentation and the fish-specific genome duplication[J]. Journal of Fish Biology, 2008, 73(8): 1891−1918. doi: 10.1111/j.1095-8649.2008.02011.x [2] Hubbard J K, Uy J A C, Hauber M E, et al. Vertebrate pigmentation: from underlying genes to adaptive function[J]. Trends in Genetics, 2010, 26(5): 231−239. doi: 10.1016/j.tig.2010.02.002 [3] Gordon A K. The effect of diet and age-at-weaning on growth and survival of clownfish Amphiprion percula (Pisces: Pomacentridae)[D]. Grahamstown: Rhodes University, 1999. [4] Marcionetti A, Rossier V, Bertrand J A M, et al. First draft genome of an iconic clownfish species (Amphiprion frenatus)[J]. Molecular Ecology Resources, 2018, 18(5): 1092−1101. doi: 10.1111/1755-0998.12772 [5] He Libin, Wu Shuiqing, Luo Huiyu, et al. The complete mitochondrial genome of the Picasso clownfish: genomic comparisons and phylogenetic inference among Amphiprioninae[J]. Mitochondrial DNA: Part B, 2020, 5(3): 2990−2991. doi: 10.1080/23802359.2020.1797554 [6] Oetting W S, King R A. Molecular basis of albinism: mutations and polymorphisms of pigmentation genes associated with albinism[J]. Human Mutation, 1999, 13(2): 99−115. doi: 10.1002/(SICI)1098-1004(1999)13:2<99::AID-HUMU2>3.0.CO;2-C [7] Oetting W S. Albinism[J]. Current Opinion in Pediatrics, 1999, 11(6): 565−571. doi: 10.1097/00008480-199912000-00016 [8] Griffiths G M. Albinism and immunity: whats the link?[J]. Current Molecular Medicine, 2002, 2(5): 479−483. doi: 10.2174/1566524023362258 [9] Xing Lili, Sun Lina, Liu Shilin, et al. Transcriptome analysis provides insights into the mechanism of albinism during different pigmentation stages of the albino sea cucumber Apostichopus japonicus[J]. Aquaculture, 2018, 486: 148−160. doi: 10.1016/j.aquaculture.2017.12.016 [10] Cox M P, Peterson D A, Biggs P J. SolexaQA: at-a-glance quality assessment of Illumina second-generation sequencing data[J]. BMC Bioinformatics, 2010, 11(1): 485. doi: 10.1186/1471-2105-11-485 [11] Kim D, Langmead B, Salzberg S L. HISAT: a fast spliced aligner with low memory requirements[J]. Nature Methods, 2015, 12(4): 357−360. doi: 10.1038/nmeth.3317 [12] Li Heng, Durbin R. Fast and accurate short read alignment with Burrows-Wheeler transform[J]. Bioinformatics, 2009, 25(14): 1754−1760. doi: 10.1093/bioinformatics/btp324 [13] Pertea M, Kim D, Pertea G M, et al. Transcript-level expression analysis of RNA-seq experiments with HISAT, StringTie and Ballgown[J]. Nature Protocols, 2016, 11(9): 1650−1667. doi: 10.1038/nprot.2016.095 [14] Young M D, Wakefield M J, Smyth G K, et al. Gene ontology analysis for RNA-seq: accounting for selection bias[J]. Genome Biology, 2010, 11(2): R14. doi: 10.1186/gb-2010-11-2-r14 [15] Xie Chen, Mao Xizeng, Huang Jiaju, et al. KOBAS 2.0: a web server for annotation and identification of enriched pathways and diseases[J]. Nucleic Acids Research, 2011, 39(S2): W316−W322. [16] Ding Kui, Zhang Libin, Sun Lina, et al. Transcriptome analysis provides insights into the molecular mechanisms responsible for evisceration behavior in the sea cucumber Apostichopus japonicus[J]. Comparative Biochemistry and Physiology Part D: Genomics and Proteomics, 2019, 30: 143−157. doi: 10.1016/j.cbd.2019.02.008 [17] Lavado A, Jeffery G, Tovar V, et al. Ectopic expression of tyrosine hydroxylase in the pigmented epithelium rescues the retinal abnormalities and visual function common in albinos in the absence of melanin[J]. Journal of Neurochemistry, 2006, 96(4): 1201−1211. doi: 10.1111/j.1471-4159.2006.03657.x [18] Smircich P, Eastman G, Bispo S, et al. Ribosome profiling reveals translation control as a key mechanism generating differential gene expression in Trypanosoma cruzi[J]. BMC Genomics, 2015, 16(1): 443. doi: 10.1186/s12864-015-1563-8 [19] Ren Hangxing, Wang Gaofu, Jiang Jing, et al. Comparative transcriptome and histological analyses provide insights into the prenatal skin pigmentation in goat (Capra hircus)[J]. Physiological Genomics, 2017, 49(12): 703−711. doi: 10.1152/physiolgenomics.00072.2017 [20] Cho M, Ryu M, Jeong Y, et al. Cardamonin suppresses melanogenesis by inhibition of Wnt/β-catenin signaling[J]. Biochemical and Biophysical Research Communications, 2009, 390(3): 500−505. doi: 10.1016/j.bbrc.2009.09.124 [21] Dunn K J, Brady M, Ochsenbauer-Jambor C, et al. WNT1 and WNT3a promote expansion of melanocytes through distinct modes of action[J]. Pigment Cell Research, 2005, 18(3): 167−180. doi: 10.1111/j.1600-0749.2005.00226.x [22] Nagao Y, Suzuki T, Shimizu A, et al. Sox5 functions as a fate switch in medaka pigment cell development[J]. PLoS Genetics, 2014, 10(4): 1004246. doi: 10.1371/journal.pgen.1004246 [23] Tief K, Hahne M, Schmidt A, et al. Tyrosinase, the key enzyme in melanin synthesis, is expressed in murine brain[J]. European Journal of Biochemistry, 1996, 241(1): 12−16. doi: 10.1111/j.1432-1033.1996.0012t.x [24] Ghanem G, Fabrice J. Tyrosinase related protein 1 (TYRP1/gp75) in human cutaneous melanoma[J]. Molecular Oncology, 2011, 5(2): 150−155. doi: 10.1016/j.molonc.2011.01.006 [25] Picardo M, Cardinali G. The genetic determination of skin pigmentation: KITLG and the KITLG/c-Kit pathway as key players in the onset of human familial pigmentary diseases[J]. Journal of Investigative Dermatology, 2011, 131(6): 1182−1185. doi: 10.1038/jid.2011.67 [26] Fang Dong, Tsuji Y, Setaluri V. Selective down-regulation of tyrosinase family gene TYRP1 by inhibition of the activity of melanocyte transcription factor, MITF[J]. Nucleic Acids Research, 2002, 30(14): 3096−3106. doi: 10.1093/nar/gkf424 [27] Seo E Y, Jin S P, Sohn K C, et al. UCHL1 regulates melanogenesis through controlling MITF stability in human melanocytes[J]. Journal of Investigative Dermatology, 2017, 137(8): 1757−1765. doi: 10.1016/j.jid.2017.03.024 [28] George A, Zand D J, Hufnagel R B, et al. Biallelic mutations in MITF cause coloboma, osteopetrosis, microphthalmia, macrocephaly, albinism, and deafness[J]. The American Journal of Human Genetics, 2016, 99(6): 1388−1394. doi: 10.1016/j.ajhg.2016.11.004 [29] Hornyak T J, Hayes D J, Chiu L Y, et al. Transcription factors in melanocyte development: distinct roles for Pax-3 and Mitf[J]. Mechanisms of Development, 2001, 101(1/2): 47−59. -
 4-11helibing附件材料.rar

-

计量
- 文章访问数: 591
- HTML全文浏览量: 238
- PDF下载量: 48
- 被引次数: 0
