

β diversity and its components of the fish community in the Haizhou Bay during autumn and the relationships with environmental factors
-
摘要: 由于过度捕捞等人类活动的胁迫,近年来海州湾渔业资源严重衰退。为了解海州湾鱼类β多样性的变化特征及其影响因素,本研究根据2013−2017年秋季在海州湾及其邻近海域进行的渔业资源底拖网调查数据,采用Sørenson相异性指数等方法计算了调查站位间以及海州湾海域整体的鱼类β多样性,并将β多样性分解为周转和嵌套两个组分,分析其时空变化特征。结合海州湾环境数据,采用广义非相似性模型分析海州湾鱼类β多样性及其组分与环境因子的关系。结果表明,海州湾鱼类β多样性及其周转和嵌套组分在年际间呈现不同程度的波动态势,浅水区的波动较为明显,深水区其次,海州湾整体则维持在较为稳定的状态;鱼类群落组成以周转模式变化。海水盐度和叶绿素a浓度是影响β多样性及其周转的主要因素,两者累计的模型偏差解释率分别为28.05%和23.33%,温度的影响相对较小;广义非相似性模型对嵌套组分的解释率较低。本研究深入解析了海州湾鱼类β多样性的时空特征及其影响因素,旨在为建立海洋保护区、优化海洋保护策略提供科学依据。Abstract: This study aims to understand the characteristics and variability in the β diversity of fish community and its influencing environmental factors in the Haizhou Bay, which was rich in fishery resources in history but seriously declined in recent years due to overfishing and environmental pollution. The data were collected from fishery resource surveys conducted in the Haizhou Bay and its adjacent waters from 2013 to 2017 using bottom trawl in autumn. β diversity was measured by Sørensen dissimilarity index using pairwise and multiple-site methods. Additionally, β diversity was divided into turnover and nestedness components and the results were analyzed visually by violin plots. On this basis, the generalized dissimilarity modelling (GDM) was used to analyze the relationship between β diversity and its components with environmental factors. The results of this study showed that the β diversity of fish community and its components fluctuated remarkably among survey years, the fluctuation was larger in the shallow water, less for the deep water, and remained at a relatively stable level regarding the whole sea area. The proportion of the turnover component in β diversity was basically maintained at more than 80%. The component of turnover was significantly larger than that of nestedness, implying the changes of fish community in the Haizhou Bay were dominated by turnover. The salinity and chlorophyll concentration of seawater were the main factors influencing β diversity and its turnover component, and the accumulated deviance explained rate of salinity and chlorophyll were 28.05% and 23.33%, respectively, the influence of water temperature was weak. The environmental factors selected in this study had a low explanatory rate for the nestedness component, which was only 1.52%. Our results implied that the characteristics of fish community have been driven by the environment, and the community development can yield corresponding adaptive to environmental changes. The process of changes in β diversity of fish community may be complex. For instance, salinity and chlorophyll concentration affect the prey density of fish and thus affect β diversity, however, more influencing factors have not been evaluated. Further studies on β diversity and its components are necessary to understand the mechanism of changing characteristics of fish community, and to provide scientific reference for the establishment of marine reserves as well as the optimization of marine conservation strategies.
-
Key words:
- fish community /
- β diversity /
- environmental factor /
- generalized dissimilarity modelling /
- Haizhou Bay
-

图 1 海州湾及其邻近海域渔业资源调查站位
Fig. 1 Sampling stations of the fishery resource surveys in the Haizhou Bay and its adjacent waters
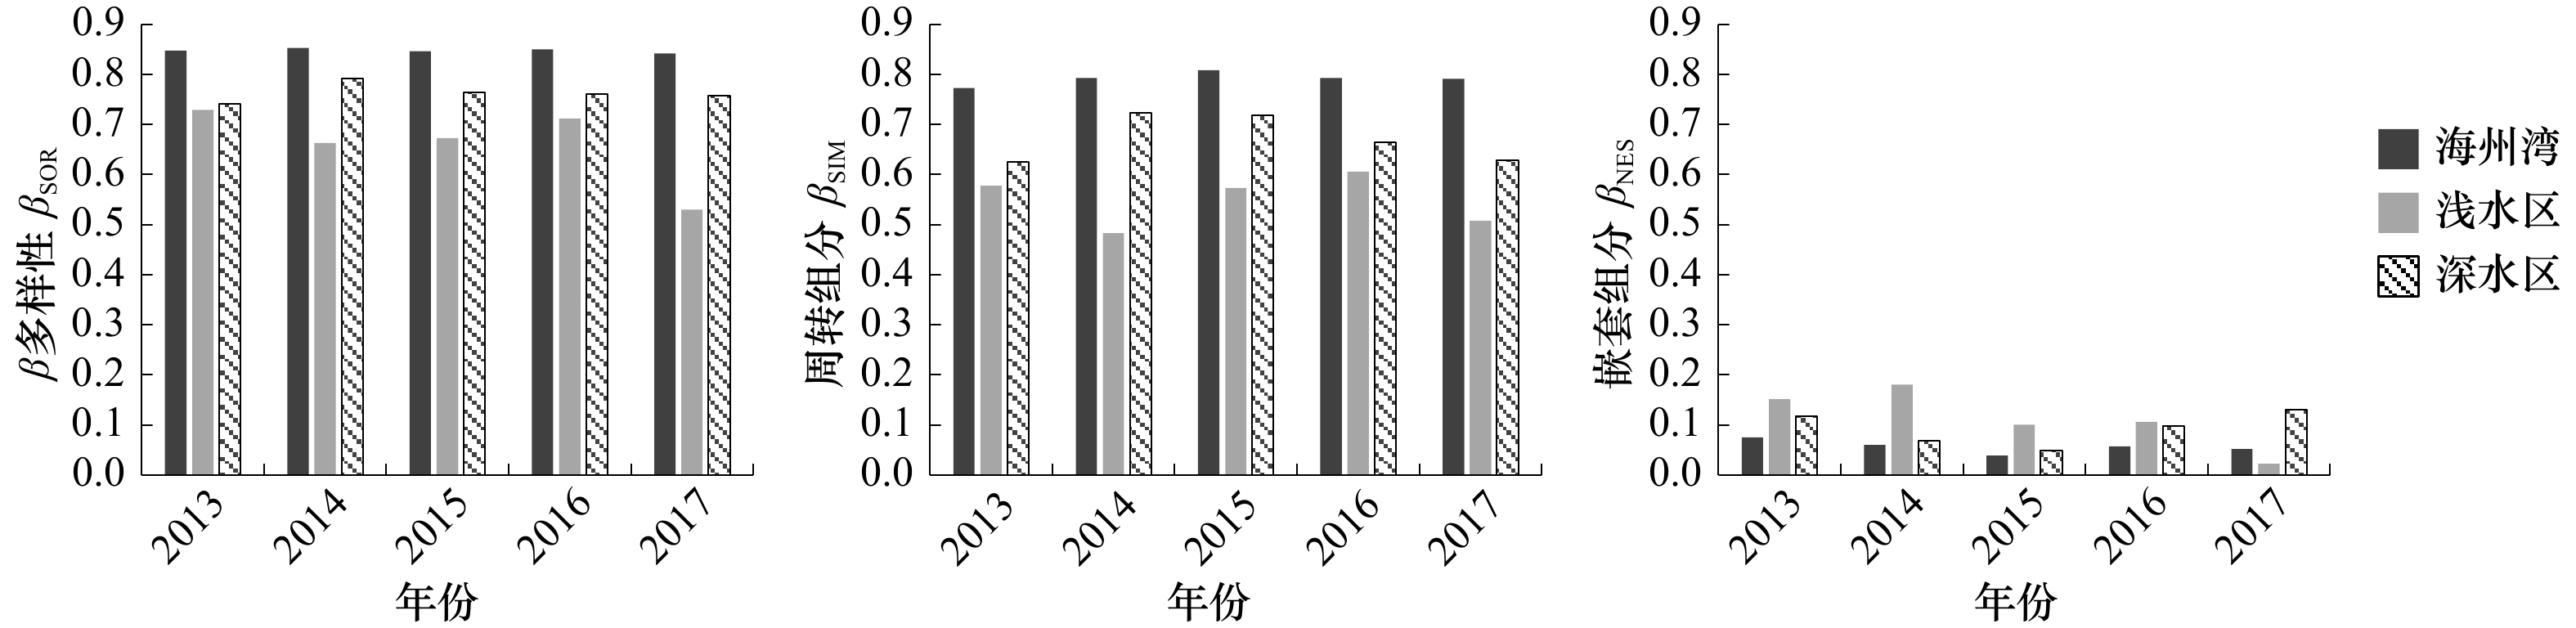
图 2 海州湾鱼类β多样性及其组分
Fig. 2 β diversity and its components of fish species in the Haizhou Bay
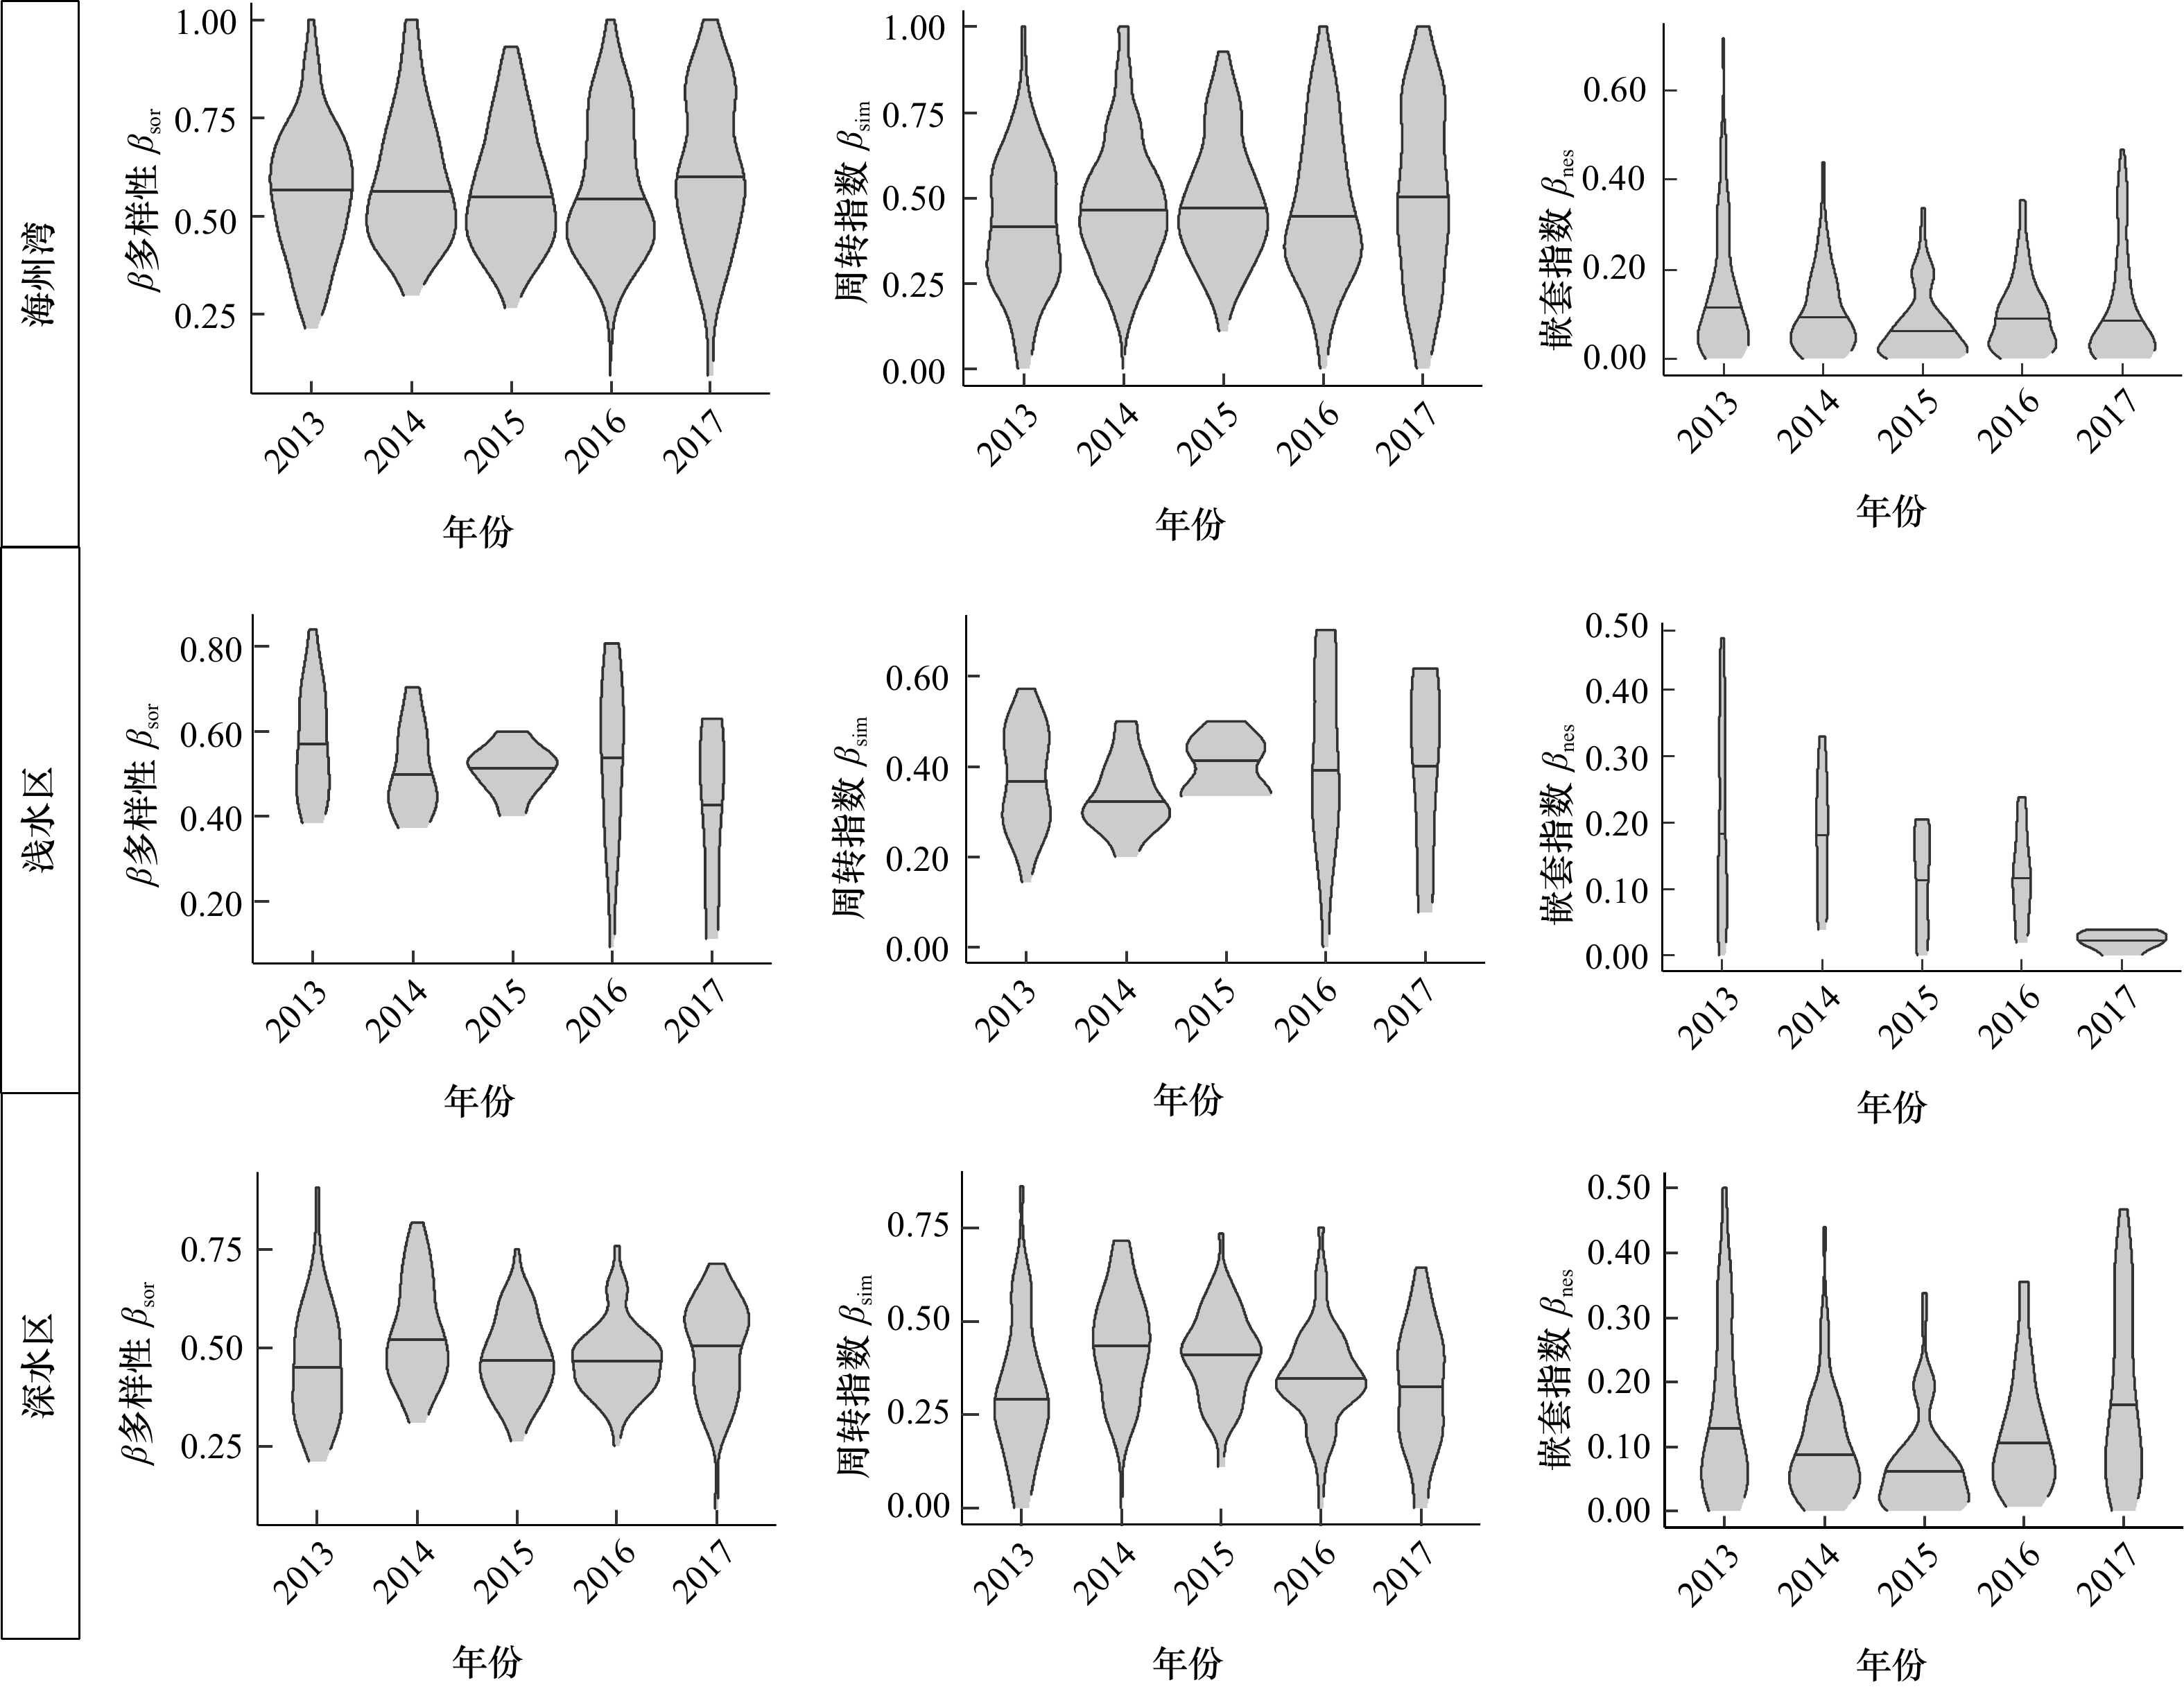
图 3 海州湾鱼类β多样性及其组分分布
Fig. 3 Distributions of β diversity and its components of fish species in the Haizhou Bay
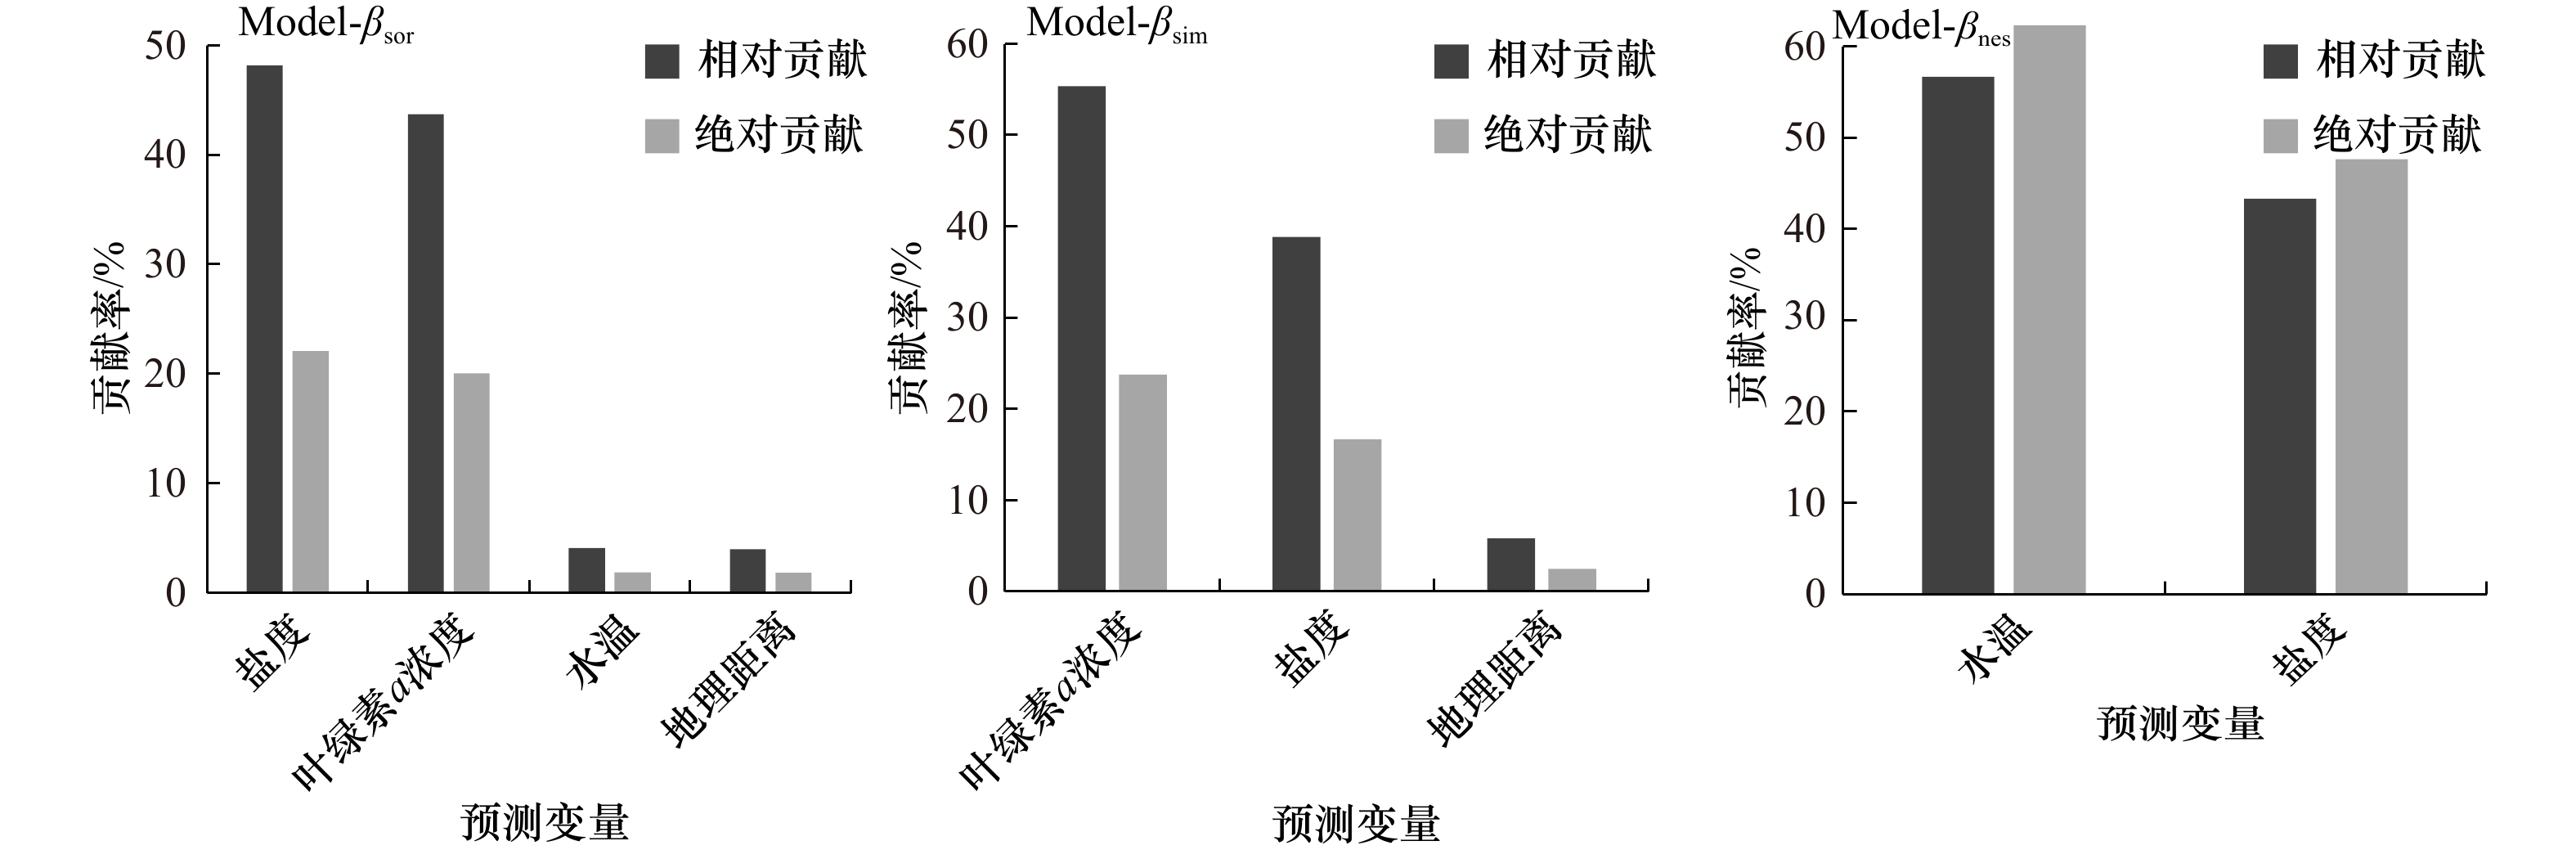
图 4 预测变量对β多样性及其组分的贡献
Fig. 4 Contributions of predictors to β diversity and its components
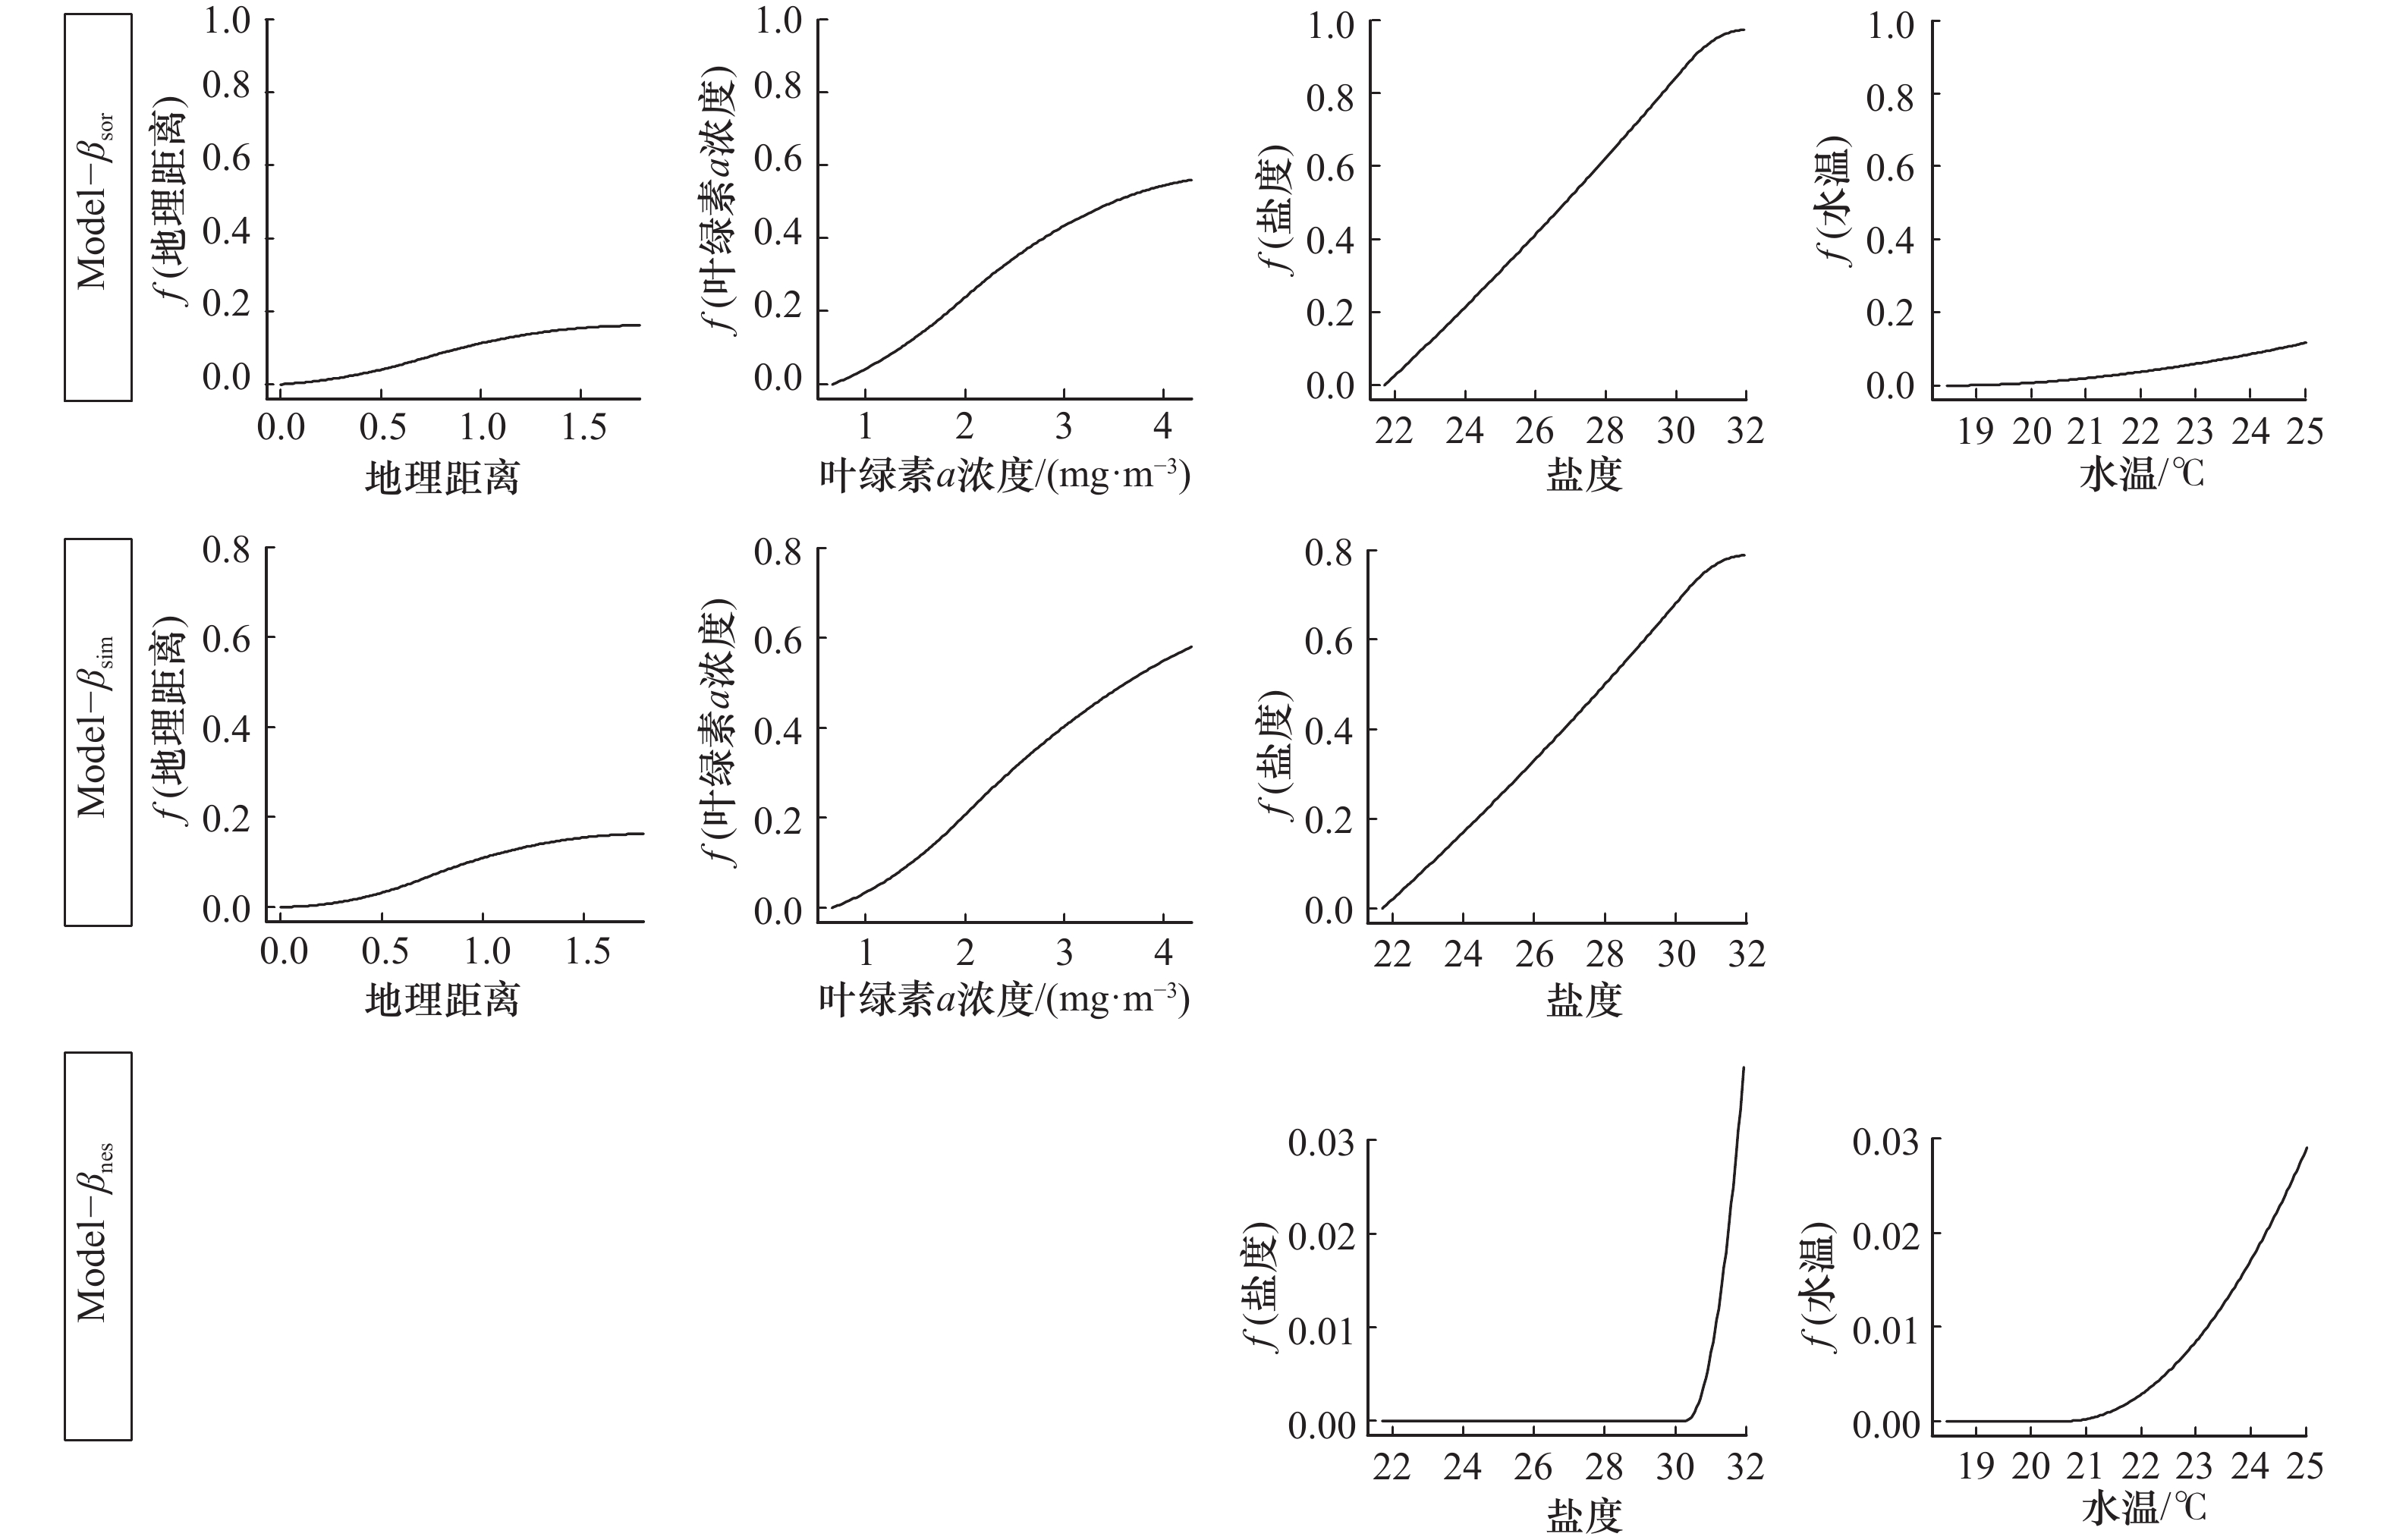
图 5 广义非相似性模型分析β多样性的偏响应图
Fig. 5 Partial response graphs of generalized dissimilarity modelling for analyzing β diversity
表 1 海州湾及其邻近海域环境因子监测结果
Tab. 1 Monitoring results of environmental factors in the Haizhou Bay and its adjacent waters
环境因子 平均值 最大值 最小值 变异系数CV 叶绿素 a浓度/(mg·m−3) 2.28 4.28 0.66 0.44 水深/m 20.71 29.08 11.19 0.22 水温/℃ 20.93 25.02 18.47 0.09 盐度 29.80 31.94 21.71 0.05  下载: 导出CSV
表 2 环境因子的Pearson相关系数
Tab. 2 Pearson correlation coefficients between environmental factors
环境因子 盐度 水温 水深 水温 0.029 水深 0.371** 0.149 叶绿素 a浓度 −0.598** −0.140 −0.640** 注:**代表p<0.01。
下载: 导出CSV
表 3 β多样性指数及其计算公式
Tab. 3 Calculation formulas of β diversity indices
β多样性指数 公式 站位间Sørenson相异性指数 $ {\ \text{β} }_{{\rm{sor}}}=\dfrac{b+c}{2a+b+c} $ 站位间Sørenson指数中周转组分 $ {\ \text{β} }_{{\rm{sim}}}=\dfrac{\mathrm{m}\mathrm{i}\mathrm{n}(b,c)}{a+\mathrm{m}\mathrm{i}\mathrm{n}(b,c)} $ 站位间Sørenson指数中嵌套组分 $ {\ \text{β} }_{{\rm{nes}}}={\text{β} }_{{\rm{sor}}}-{\text{β} }_{{\rm{sim}}} $ 海域Sørenson相异性指数 $ {\ \text{β} }_{{\rm{SOR}}}=\dfrac{\left[\displaystyle\sum _{i < j}\mathrm{m}\mathrm{i}\mathrm{n}({b}_{ij},{b}_{ji})\right]+\left[\displaystyle\sum _{i < j}\mathrm{m}\mathrm{a}\mathrm{x}({b}_{ij},{b}_{ji})\right]}{2\left[\displaystyle\sum _{i}{S}_{i}-{S}_{{\rm{T}}}\right]+\left[\displaystyle\sum _{i < j}\mathrm{m}\mathrm{i}\mathrm{n}({b}_{ij},{b}_{ji})\right]+\left[\displaystyle\sum _{i < j}\mathrm{m}\mathrm{a}\mathrm{x}({b}_{ij},{b}_{ji})\right]} $ 海域Sørenson指数中周转组分 $ {\ \text{β} }_{{\rm{SIM}}}=\dfrac{\left[\displaystyle\sum _{i < j}\mathrm{m}\mathrm{i}\mathrm{n}({b}_{ij},{b}_{ji})\right]}{\left[\displaystyle\sum _{i}{S}_{i}-{S}_{{\rm{T}}}\right]+\left[\displaystyle\sum _{i < j}\mathrm{m}\mathrm{i}\mathrm{n}({b}_{ij},{b}_{ji})\right]} $ 海域Sørenson指数中嵌套组分 $ {{\ \text{β} }_{{\rm{NES}}}=\text{β} }_{{\rm{SIM}}}-{\text{β} }_{{\rm{SOR}}} $ 注:βsor、βsim、βnet分别为站位间的β多样性、周转组分和嵌套组分;a为两个站位共有的物种数;b和c分别为两个站位所特有的物种数;Si为站位i的物种数;ST为所有调查站位的物种总数;bij和bji分别为站位i和j所特有的物种数。
下载: 导出CSV
表 4 预测变量筛选结果
Tab. 4 Screening results of predictors
模型 因子 累计偏差解释率/% 贡献率/% Model-βsor 地理距离 9.60 9.60 叶绿素a浓度 29.14 19.54 水深 29.14 0.00 水温 30.01 0.86 盐度 38.52 8.51 Model-βsim 地理距离 9.49 9.49 叶绿素a浓度 27.32 17.83 水深 27.32 0.00 水温 27.51 0.19 盐度 33.01 5.50 Model-βnes 地理距离 − − 叶绿素a含量 − − 水深 − − 水温 0.80 0.80 盐度 1.52 0.73 注:地理距离由GDM计算得出,即欧氏距离;“−”表示该变量对模型拟合无效。
下载: 导出CSV
-
[1] Whittaker R H. Vegetation of the Siskiyou mountains, oregon and California[J]. Ecological Monographs, 1960, 30(3): 279−338. doi: 10.2307/1943563 [2] Whittaker R H. Evolution and measurement of species diversity[J]. Taxon, 1972, 21(2/3): 213−251. [3] Pressey R L, Humphries C J, Margules C R, et al. Beyond opportunism: key principles for systematic reserve selection[J]. Trends in Ecology & Evolution, 1993, 8(4): 124−128. [4] Margules C R, Pressey R L. Systematic conservation planning[J]. Nature, 2000, 405(6783): 243−253. doi: 10.1038/35012251 [5] 陈圣宾, 欧阳志云, 徐卫华, 等. Beta多样性研究进展[J]. 生物多样性, 2010, 18(4): 323−335. doi: 10.3724/SP.J.1003.2010.323Chen Shengbin, Ouyang Zhiyun, Xu Weihua, et al. A review of beta diversity studies[J]. Biodiversity Science, 2010, 18(4): 323−335. doi: 10.3724/SP.J.1003.2010.323 [6] 白永飞, 邢雪荣, 许志信, 等. 内蒙古高原针茅草原群落β多样性研究[J]. 应用生态学报, 2000, 11(3): 408−412. doi: 10.3321/j.issn:1001-9332.2000.03.020Bai Yongfei, Xing Xuerong, Xu Zhixin, et al. β-diversity of Stipa communities in Inner Mongolia Plateau[J]. Chinese Journal of Applied Ecology, 2000, 11(3): 408−412. doi: 10.3321/j.issn:1001-9332.2000.03.020 [7] 杨婧, 褚鹏飞, 陈迪马, 等. 放牧对内蒙古典型草原α、β和γ多样性的影响机制[J]. 植物生态学报, 2014, 38(2): 188−200. doi: 10.3724/SP.J.1258.2014.00017Yang Jing, Chu Pengfei, Chen Dima, et al. Mechanisms underlying the impacts of grazing on plant α, β and γ diversity in a typical steppe of the Inner Mongolia grassland[J]. Chinese Journal of Plant Ecology, 2014, 38(2): 188−200. doi: 10.3724/SP.J.1258.2014.00017 [8] 张东, 宛凤英, 储玲, 等. 青弋江鱼类分类群和功能群的α和β多样性纵向梯度格局[J]. 生物多样性, 2018, 26(1): 1−13. doi: 10.17520/biods.2017263Zhang Dong, Wan Fengying, Chu Ling, et al. Longitudinal patterns in α and β diversity of the taxonomic and functional organizations of stream fish assemblages in the Qingyi River[J]. Biodiversity Science, 2018, 26(1): 1−13. doi: 10.17520/biods.2017263 [9] 戴美霞, 朱艺峰, 林霞, 等. 象山港浮游动物β多样性及其成分变化的环境因子解释[J]. 生态学报, 2017, 37(17): 5780−5789.Dai Meixia, Zhu Yifeng, Lin Xia, et al. Interpretation of environmental factors affecting zooplanktonic beta diversity and its components in Xiangshan Bay[J]. Acta Ecologica Sinica, 2017, 37(17): 5780−5789. [10] 朱艺峰, 戴美霞, 周晓红, 等. 环境因子对国华电厂温排水海域浮游动物群落β多样性的影响[J]. 应用生态学报, 2015, 26(8): 2543−2552.Zhu Yifeng, Dai Meixia, Zhou Xiaohong, et al. Effects of environmental factors on β diversity of zooplankton community in thermal discharge seawaters near Guohua Power Plant in Xiangshan Bay, Zhejiang, China[J]. Chinese Journal of Applied Ecology, 2015, 26(8): 2543−2552. [11] 中国海湾志编纂委员会. 中国海湾志: 第四分册——山东半岛南部和江苏省海湾[M]. 北京: 海洋出版社, 1993: 354−420.Editorial Board of China Bay Survey. Survey of China Bays (Vol. 4): Southern Shandong Peninsula and Gulf of Jiangsu Province[M]. Beijing: China Ocean Press, 1993: 354−420. [12] 隋昊志, 薛莹, 任一平, 等. 海州湾鱼类生态类群的研究[J]. 中国海洋大学学报(自然科学版), 2017, 47(12): 59−71.Sui Haozhi, Xue Ying, Ren Yiping, et al. Studies on the ecological groups of fish communities in Haizhou Bay, China[J]. Periodical of Ocean University of China, 2017, 47(12): 59−71. [13] 苏巍, 薛莹, 任一平. 海州湾海域鱼类分类多样性的时空变化及其与环境因子的关系[J]. 中国水产科学, 2013, 20(3): 624−634. doi: 10.3724/SP.J.1118.2013.00624Su Wei, Xue Ying, Ren Yiping. Temporal and spatial variation in taxonomic diversity of fish in Haizhou Bay: the effect of environmental factors[J]. Journal of Fishery Sciences of China, 2013, 20(3): 624−634. doi: 10.3724/SP.J.1118.2013.00624 [14] Ferrier S, Manion G, Elith J, et al. Using generalized dissimilarity modelling to analyse and predict patterns of beta diversity in regional biodiversity assessment[J]. Diversity and Distributions, 2007, 13(3): 252−264. doi: 10.1111/j.1472-4642.2007.00341.x [15] Elith J, Graham C H, Anderson R P, et al. Novel methods improve prediction of species’ distributions from occurrence data[J]. Ecography, 2006, 29(2): 129−151. doi: 10.1111/j.2006.0906-7590.04596.x [16] Ferrier S, Powell G V N, Richardson K S, et al. Mapping more of terrestrial biodiversity for global conservation assessment[J]. BioScience, 2004, 54(12): 1101−1109. doi: 10.1641/0006-3568(2004)054[1101:MMOTBF]2.0.CO;2 [17] Zhang Chongliang, Chen Yong, Xu Binduo, et al. How to predict biodiversity in space? An evaluation of modelling approaches in marine ecosystems[J]. Diversity and Distributions, 2019, 25(11): 1697−1708. doi: 10.1111/ddi.12970 [18] Xu Binduo, Zhang Chongliang, Xue Ying, et al. Optimization of sampling effort for a fishery-independent survey with multiple goals[J]. Environmental Monitoring and Assessment, 2015, 187(5): 252. doi: 10.1007/s10661-015-4483-9 [19] 中华人民共和国国家质量监督检验检疫总局, 中国国家标准化管理委员会. GB/T 12763.6−2007, 海洋调查规范 第6部分: 海洋生物调查[S]. 北京: 中国标准出版社, 2008.General Administration of Quality Supervision, Inspection and Quarantine of the People’s Republic of China, Standardization Administration of the People’s Republic of China. GB/T 12763.6−2007, Specifications for oceanographic survey—Part 6: Marine biological survey[S]. Beijing: Standards Press of China, 2008. [20] Chen Changsheng, Gao Guoping, Zhang Yu, et al. Circulation in the Arctic Ocean: results from a high-resolution coupled ice-sea nested Global-FVCOM and Arctic-FVCOM system[J]. Progress in Oceanography, 2016, 141: 60−80. doi: 10.1016/j.pocean.2015.12.002 [21] Xing Qinwang, Yu Huaming, Yu Haiqing, et al. A comprehensive model-based index for identification of larval retention areas: a case study for Japanese anchovy Engraulis japonicus in the Yellow Sea[J]. Ecological Indicators, 2020, 116: 106479. doi: 10.1016/j.ecolind.2020.106479 [22] Kleijnen J P C. Kriging metamodeling in simulation: a review[J]. European Journal of Operational Research, 2009, 192(3): 707−716. doi: 10.1016/j.ejor.2007.10.013 [23] Harrison S, Ross S J, Lawton J H. Beta diversity on geographic gradients in Britain[J]. Journal of Animal Ecology, 1992, 61(1): 151−158. doi: 10.2307/5518 [24] Baselga A, Jiménez-Valverde A, Niccolini G. A multiple-site similarity measure independent of richness[J]. Biology Letters, 2007, 3(6): 642−645. doi: 10.1098/rsbl.2007.0449 [25] Baselga A. Partitioning the turnover and nestedness components of beta diversity[J]. Global Ecology and Biogeography, 2010, 19(1): 134−143. doi: 10.1111/j.1466-8238.2009.00490.x [26] Xu Rui, Wunsch D C. Survey of clustering algorithms[J]. IEEE Transactions on Neural Networks, 2005, 16(3): 645−678. doi: 10.1109/TNN.2005.845141 [27] 李雪童, 徐宾铎, 薛莹, 等. 海州湾鱼类β多样性变化[J]. 中国水产科学, 2021, 28(4): 451−459.Li Xuetong, Xu Binduo, Xue Ying, et al. Variation in the β diversity of fish species in Haizhou Bay[J]. Journal of Fishery Sciences of China, 2021, 28(4): 451−459. [28] Sørensen T J. A method of establishing groups of equal amplitude in plant sociology based on similarity of species and its application to analyses of the vegetation on Danish commons[J]. Kongelige Danske Videnskabernes Selskab, Biologiske Skrifter, 1948, 5: 1−34. [29] Simpson G G. Mammals and the nature of continents[J]. American Journal of Science, 1943, 241(1): 1−31. doi: 10.2475/ajs.241.1.1 [30] Hintze J L, Nelson R D. Violin plots: a box plot-density trace synergism[J]. The American Statistician, 1998, 52(2): 181−184. [31] Overton J M, Barker G M, Price R. Estimating and conserving patterns of invertebrate diversity: a test case of New Zealand land snails[J]. Diversity and Distributions, 2009, 15(5): 731−741. doi: 10.1111/j.1472-4642.2009.00589.x [32] Leaper R, Hill N A, Edgar G J, et al. Predictions of beta diversity for reef macroalgae across southeastern Australia[J]. Ecosphere, 2011, 2(7): 1−18. [33] Ashcroft M B, Gollan J R, Faith D P, et al. Using generalised dissimilarity models and many small samples to improve the efficiency of regional and landscape scale invertebrate sampling[J]. Ecological Informatics, 2010, 5(2): 124−132. doi: 10.1016/j.ecoinf.2009.12.002 [34] Fitzpatrick M C, Sanders N J, Normand S, et al. Environmental and historical imprints on beta diversity: insights from variation in rates of species turnover along gradients[J]. Proceedings of the Royal Society B: Biological Sciences, 2013, 280(1768): 20131201. doi: 10.1098/rspb.2013.1201 [35] Patterson B D, Brown J H. Regionally nested patterns of species composition in granivorous rodent assemblages[J]. Journal of Biogeography, 1991, 18(4): 395−402. doi: 10.2307/2845481 [36] Oikonomou A, Stefanidis K. α- and β-diversity patterns of macrophytes and freshwater fishes are driven by different factors and processes in lakes of the unexplored Southern Balkan biodiversity hotspot[J]. Water, 2020, 12(7): 1984. doi: 10.3390/w12071984 [37] Lansac-Tôha F M, Heino J, Quirino B A, et al. Differently dispersing organism groups show contrasting beta diversity patterns in a dammed subtropical river basin[J]. Science of the Total Environment, 2019, 691: 1271−1281. doi: 10.1016/j.scitotenv.2019.07.236 [38] Pachauri R K, Allen M R, Barros V R, et al. Climate Change 2014: Synthesis Report. Contribution of Working Groups I, II and III to the Fifth Assessment Report of the Intergovernmental Panel on Climate Change[M]. Geneva, Switzerland: IPCC, 2014. [39] Yin Jie, Xu Jun, Xue Ying, et al. Evaluating the impacts of El Niño events on a marine bay ecosystem based on selected ecological network indicators[J]. Science of the Total Environment, 2021, 763: 144205. doi: 10.1016/j.scitotenv.2020.144205 [40] Koubbi P, Moteki M, Duhamel G, et al. Ecoregionalization of myctophid fish in the Indian sector of the Southern Ocean: results from generalized dissimilarity models[J]. Deep-Sea Research Part II: Topical Studies in Oceanography, 2011, 58(1/2): 170−180. [41] Georgopoulou E, Neubauer T A, Harzhauser M, et al. Distribution patterns of European lacustrine gastropods: a result of environmental factors and deglaciation history[J]. Hydrobiologia, 2016, 775(1): 69−82. doi: 10.1007/s10750-016-2713-y [42] Xue Ying, Guan Lisha, Tanaka K, et al. Evaluating effects of rescaling and weighting data on habitat suitability modeling[J]. Fisheries Research, 2017, 188: 84−94. doi: 10.1016/j.fishres.2016.12.001 [43] Zhang Yunlei, Yu Huaming, Yu Haiqing, et al. Optimization of environmental variables in habitat suitability modeling for mantis shrimp Oratosquilla oratoria in the Haizhou Bay and adjacent waters[J]. Acta Oceanologica Sinica, 2020, 39(6): 36−47. doi: 10.1007/s13131-020-1546-8 [44] Li Bai, Tanaka K R, Chen Yong, et al. Assessing the quality of bottom water temperatures from the Finite-Volume Community Ocean Model (FVCOM) in the Northwest Atlantic Shelf region[J]. Journal of Marine Systems, 2017, 173: 21−30. doi: 10.1016/j.jmarsys.2017.04.001 [45] Zhang Yunlei, Xu Binduo, Ji Yupeng, et al. Comparison of habitat models in quantifying the spatio-temporal distribution of small yellow croaker (Larimichthys polyactis) in Haizhou Bay, China[J]. Estuarine, Coastal and Shelf Science, 2021, 261: 107512. doi: 10.1016/j.ecss.2021.107512 [46] 栾静, 张崇良, 徐宾铎, 等. 海州湾双斑蟳栖息分布特征与环境因子的关系[J]. 水产学报, 2018, 42(6): 889−901.Luan Jing, Zhang Chongliang, Xu Binduo, et al. Relationship between catch distribution of Portunid crab (Charybdis bimaculata) and environmental factors based on three species distribution models in Haizhou Bay[J]. Journal of Fisheries of China, 2018, 42(6): 889−901. [47] 张云雷, 薛莹, 于华明, 等. 海州湾春季皮氏叫姑鱼栖息地适宜性研究[J]. 海洋学报, 2018, 40(6): 83−91.Zhang Yunlei, Xue Ying, Yu Huaming, et al. Study on the habitat suitability of Johnius belangerii during spring in the Haizhou Bay, China[J]. Haiyang Xuebao, 2018, 40(6): 83−91. [48] 徐兆礼. 中国近海浮游动物多样性研究的过去和未来[J]. 生物多样性, 2011, 19(6): 635−645.Xu Zhaoli. The past and the future of zooplankton diversity studies in China seas[J]. Biodiversity Science, 2011, 19(6): 635−645. [49] Yemane D, Field J G, Leslie R W. Spatio-temporal patterns in the diversity of demersal fish communities off the south coast of South Africa[J]. Marine Biology, 2010, 157(2): 269−281. doi: 10.1007/s00227-009-1314-y [50] Stefansdottir L, Solmundsson J, Marteinsdottir G, et al. Groundfish species diversity and assemblage structure in Icelandic waters during recent years of warming[J]. Fisheries Oceanography, 2010, 19(1): 42−62. doi: 10.1111/j.1365-2419.2009.00527.x [51] Nekola J C, White P S. The distance decay of similarity in biogeography and ecology[J]. Journal of Biogeography, 1999, 26(4): 867−878. doi: 10.1046/j.1365-2699.1999.00305.x [52] Blois J L, Williams J W, Fitzpatrick M C, et al. Modeling the climatic drivers of spatial patterns in vegetation composition since the Last Glacial Maximum[J]. Ecography, 2013, 36(4): 460−473. doi: 10.1111/j.1600-0587.2012.07852.x [53] Garcia J, Pelletier D, Carpentier L, et al. Scale-dependency of the environmental influence on fish β-diversity: implications for ecoregionalization and conservation[J]. Journal of Biogeography, 2018, 45(8): 1818−1832. doi: 10.1111/jbi.13381 [54] Fisher J A D, Frank K T, Petrie B, et al. Temporal dynamics within a contemporary latitudinal diversity gradient[J]. Ecology Letters, 2008, 11(9): 883−897. doi: 10.1111/j.1461-0248.2008.01216.x [55] Anderson M J, Tolimieri N, Millar R B. Beta diversity of demersal fish assemblages in the North-Eastern Pacific: interactions of latitude and depth[J]. PLoS ONE, 2013, 8(3): e57918. doi: 10.1371/journal.pone.0057918 [56] Magurran A E, Dornelas M, Moyes F, et al. Rapid biotic homogenization of marine fish assemblages[J]. Nature Communications, 2015, 6(1): 8405. doi: 10.1038/ncomms9405 [57] 陈兵, 孟雪晨, 张东, 等. 河流鱼类分类群和功能群的纵向梯度格局——以新安江流域为例[J]. 生态学报, 2019, 39(15): 5730−5745.Chen Bing, Meng Xuechen, Zhang Dong, et al. Longitudinal patterns in taxonomic and functional organizations of fish assemblages in the Xin’an River[J]. Acta Ecologica Sinica, 2019, 39(15): 5730−5745. [58] Carvalho R A, Teresa F B, Tejerina-Garro F L. The effect of riverine networks on fish β-diversity patterns in a Neotropical system[J]. Hydrobiologia, 2021, 848(2): 515−529. doi: 10.1007/s10750-020-04459-9 -

计量
- 文章访问数: 504
- HTML全文浏览量: 210
- PDF下载量: 44
- 被引次数: 0
