

Spatiotemporal variations of mesoscale eddies in the Japan Sea
-
摘要: 本文利用1993–2019年基于海表面高度异常的涡旋数据集和高度计数据统计分析了日本海区域中尺度涡旋的大小、极性、生命周期、振幅、传播等表面特征的时空变化规律。27年间,共探测到1 429个涡旋,气旋和反气旋数量基本相当,其中气旋675个,反气旋754个。两种极性涡旋均具有较强的季节变化:秋季较多,冬季次之,春季最少。郁陵盆地、大和盆地等为涡旋多发区域呈现西南–东北向带状分布。其中,南部海域反气旋占优,靠近津轻海峡的北部海域气旋占优。西部和南部受东韩暖流和对马暖流的驱动,涡旋移动方向与流场基本一致,北部涡旋与黎曼寒流以及副极地锋流有关。研究表明,动力学不稳定是涡旋在秋冬季大量产生的重要原因。此外,半封闭盆地、局地流场以及复杂的海气相互作用等都可能会对涡旋的产生和消亡造成一定影响。Abstract: In this paper, surface characteristics of mesoscale eddies in the Japan Sea (JES), including size, polarity, life cycle, amplitude, and trajectory, are analyzed by using eddy datasets and sea level anomaly altimeter data from 1993 to 2019. Over the 27-year period, a total of 1429 eddies were detected with nearly equal number of cyclonic and anticyclonic eddies (CEs and AEs, respectively). Strong seasonal variability was observed for both polarities of eddy. The eddies were most generated in autumn, followed by winter and the least in the spring. Mesoscale eddies are prone to generate in the Ulleung Basin and Yamato Basin, which distributed in a southwest-northeast zonal belt. Among them, ACs are dominant in the southern JES, while CEs in the northern JES near the Tsugaru Strait. The western and southern movements of the mesoscale eddies were driven by the East Korean Warm Current and Tsushima Warm Current. In the northern JES, the mesoscale eddies were more related to the Liman cold current and subpolar front current. Further studies shown that dynamical instability is an important reason for the generation of eddies in autumn and winter. However, semi-enclosed basins, local flow fields, and complex air-sea interactions may all have a certain impact on the generation and dissipation of the mesoscale eddies.
-
Key words:
- the Japan Sea /
- mesoscale eddies /
- surface features /
- statistical analysis
-
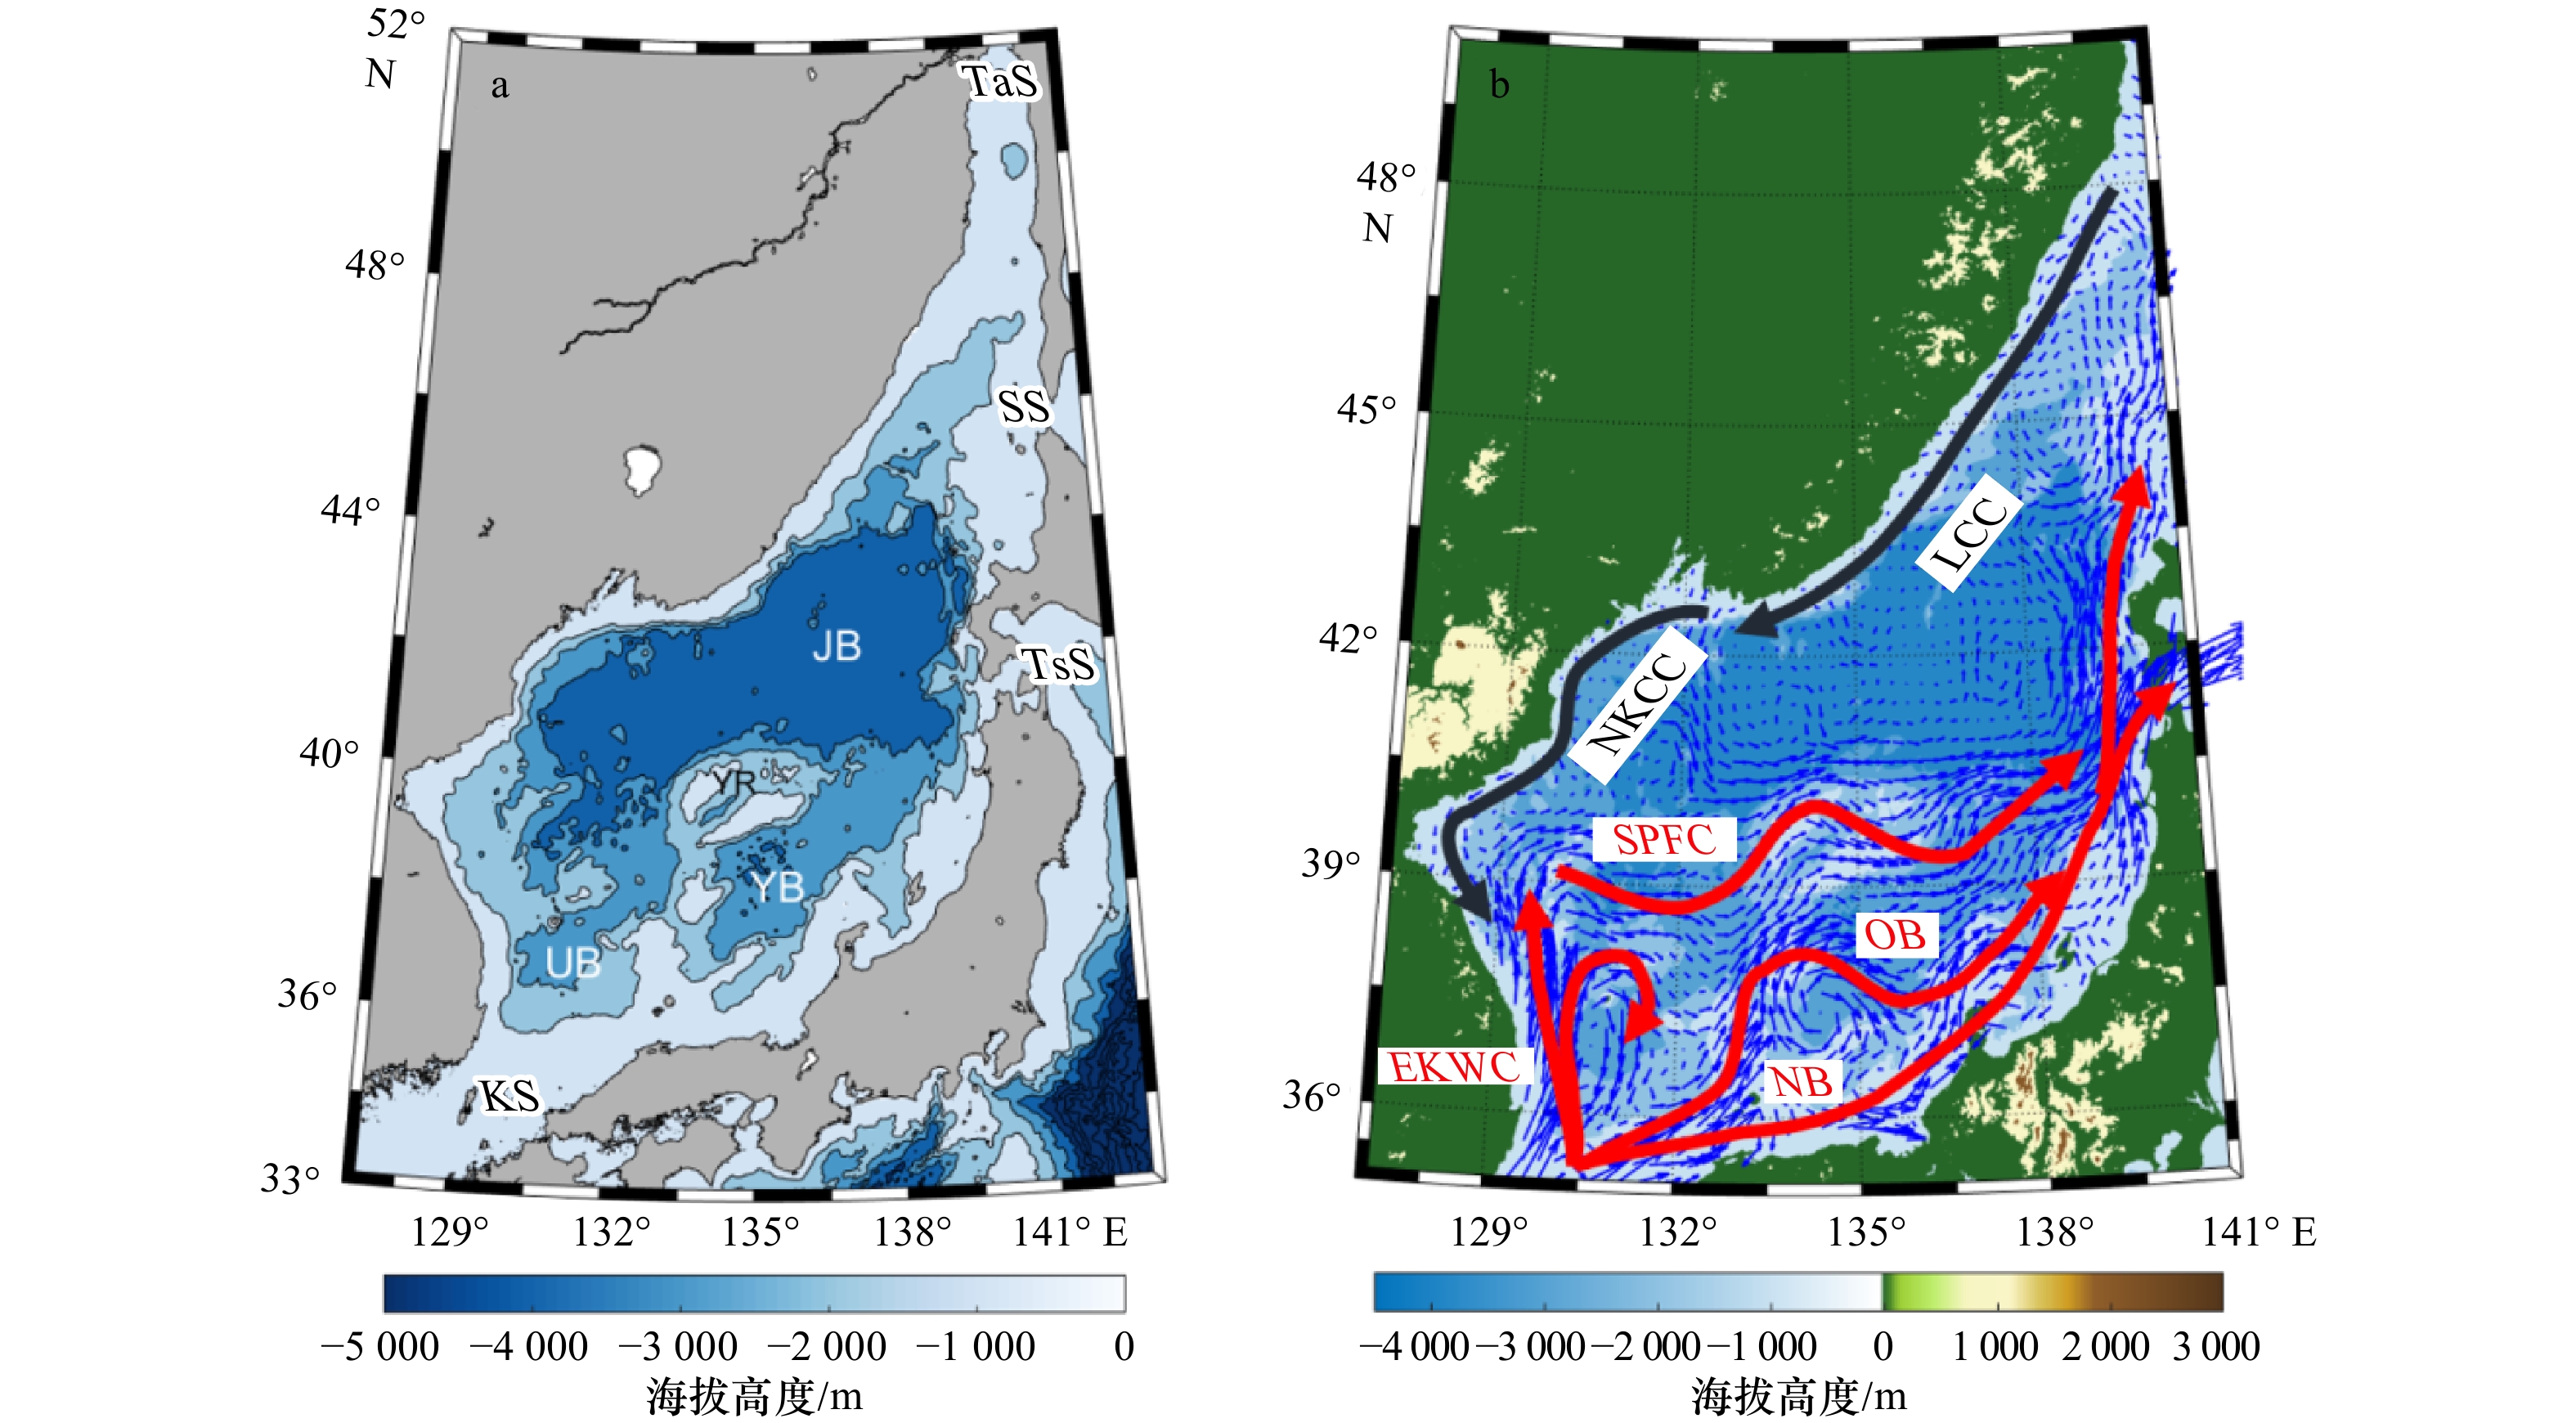
图 1 日本海地形(a)和表层环流示意图(b)
UB.郁陵盆地;YB.大和海盆;JB.日本海盆;KS.对马(朝鲜)海峡;TsS.津轻海峡;SS.宗谷海峡;TaS.鞑靼海峡;YR.大和隆起。b图红色箭头代表暖流,黑色箭头代表寒流;NB.对马暖流近岸分支;OB.对马暖流离岸分支;EKWC.东韩暖流;LCC.黎曼寒流;NKCC.北韩寒流; SPFC.副极地锋流
Fig. 1 Topographic of the Japan Sea from ETOO2 (a) and schematic diagram of the Japan Sea surface current (b)
UB. Ulleung Basin; YB. Yamato Basin; JB. Japan Basin; KS. Korea Strait; TsS. Tsugaru Strait; SS. Soya Strait; TaS. Tatarsky Strait; YR. Yamato Rise. In b, the red arrow represents warm current and black arrow represents cold current; NB.Tsushima Warm Current Nearshore Branch; OB. Tsushima Warm Current Offshore Branch; EKWC. East Korean Warm Current; LCC. Liman Cold Current; NKCC. North Korea Cold Current; SPFC. Subpolar Front Current

图 2 涡动能(a)和海表面高度异常均方根(b)多年平均空间分布
Fig. 2 Spatial distribution of the multi-year average eddy kinetic energy (a) and root mean square of the sea level anomaly (b)
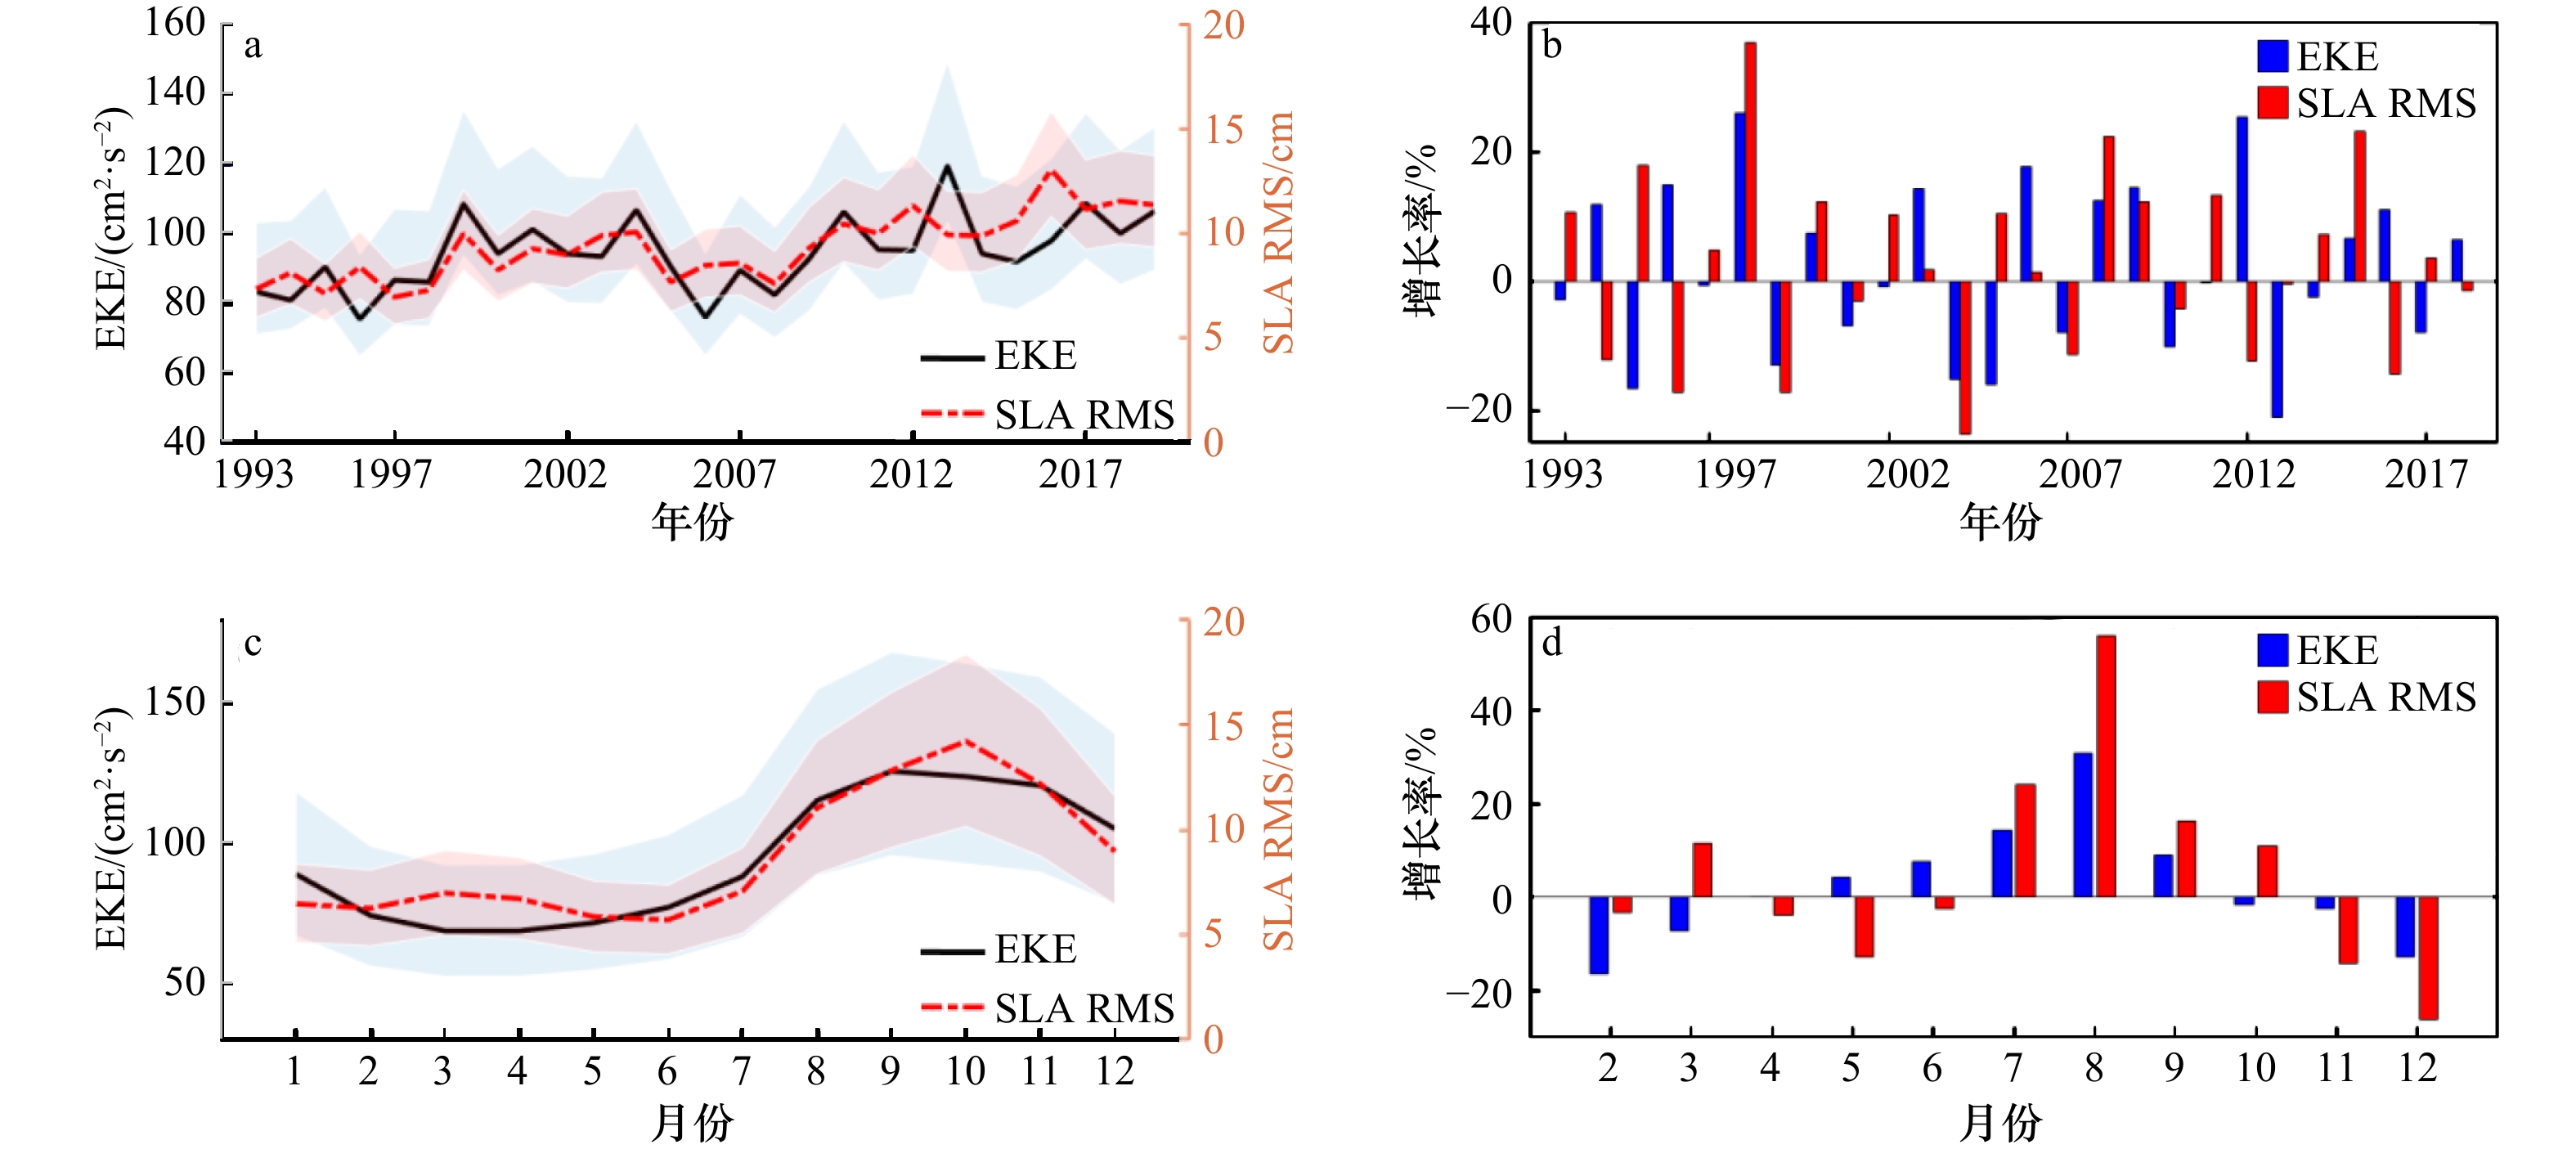
图 3 涡动能(EKE)和海表面高度异常均方根(SLA RMS)(a,c)及其线性增长率(b,d)的时间变化序列
上、下行分别为年际和季节变化,a和c中的阴影部分为误差范围
Fig. 3 Time series of eddy kinetic energy (EKE) and sea surface height anomaly root mean square (SLA RMS) (a, c) and its linear growth rate (b, d)
The up and down rows are interannual and seasonal variations respectively, and the shaded part in a and c is the error range
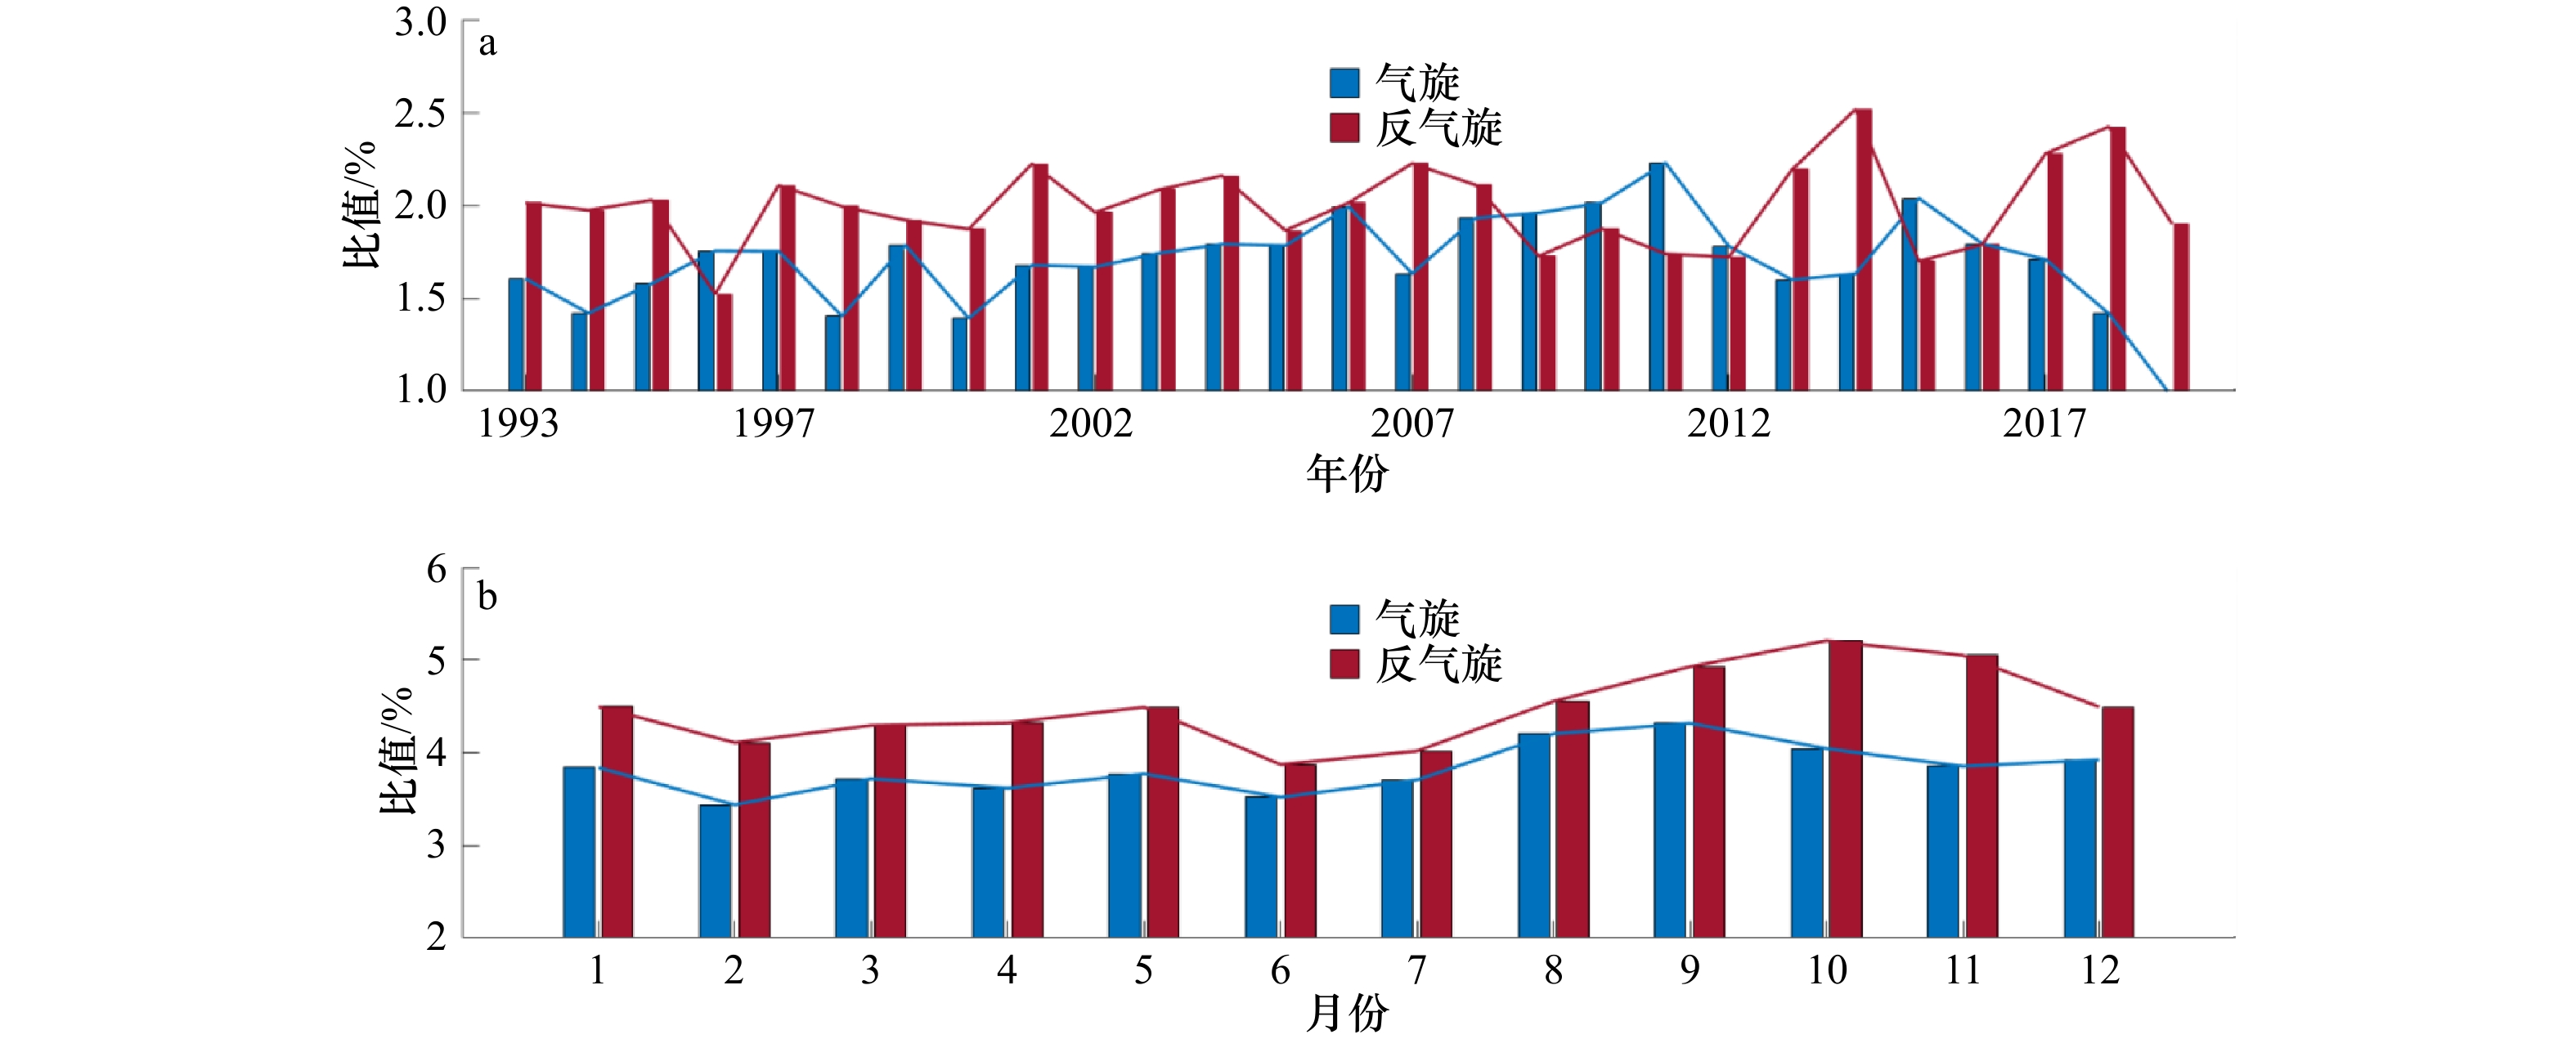
图 4 涡旋数量的年际变化(a)和月变化(b)
纵坐标为不同极性涡旋占总涡旋数的比值
Fig. 4 The interannual (a) and monthly (b) variation of eddy numbers
Vertical axis is the ratio of eddies with different polarities to the total number of eddies
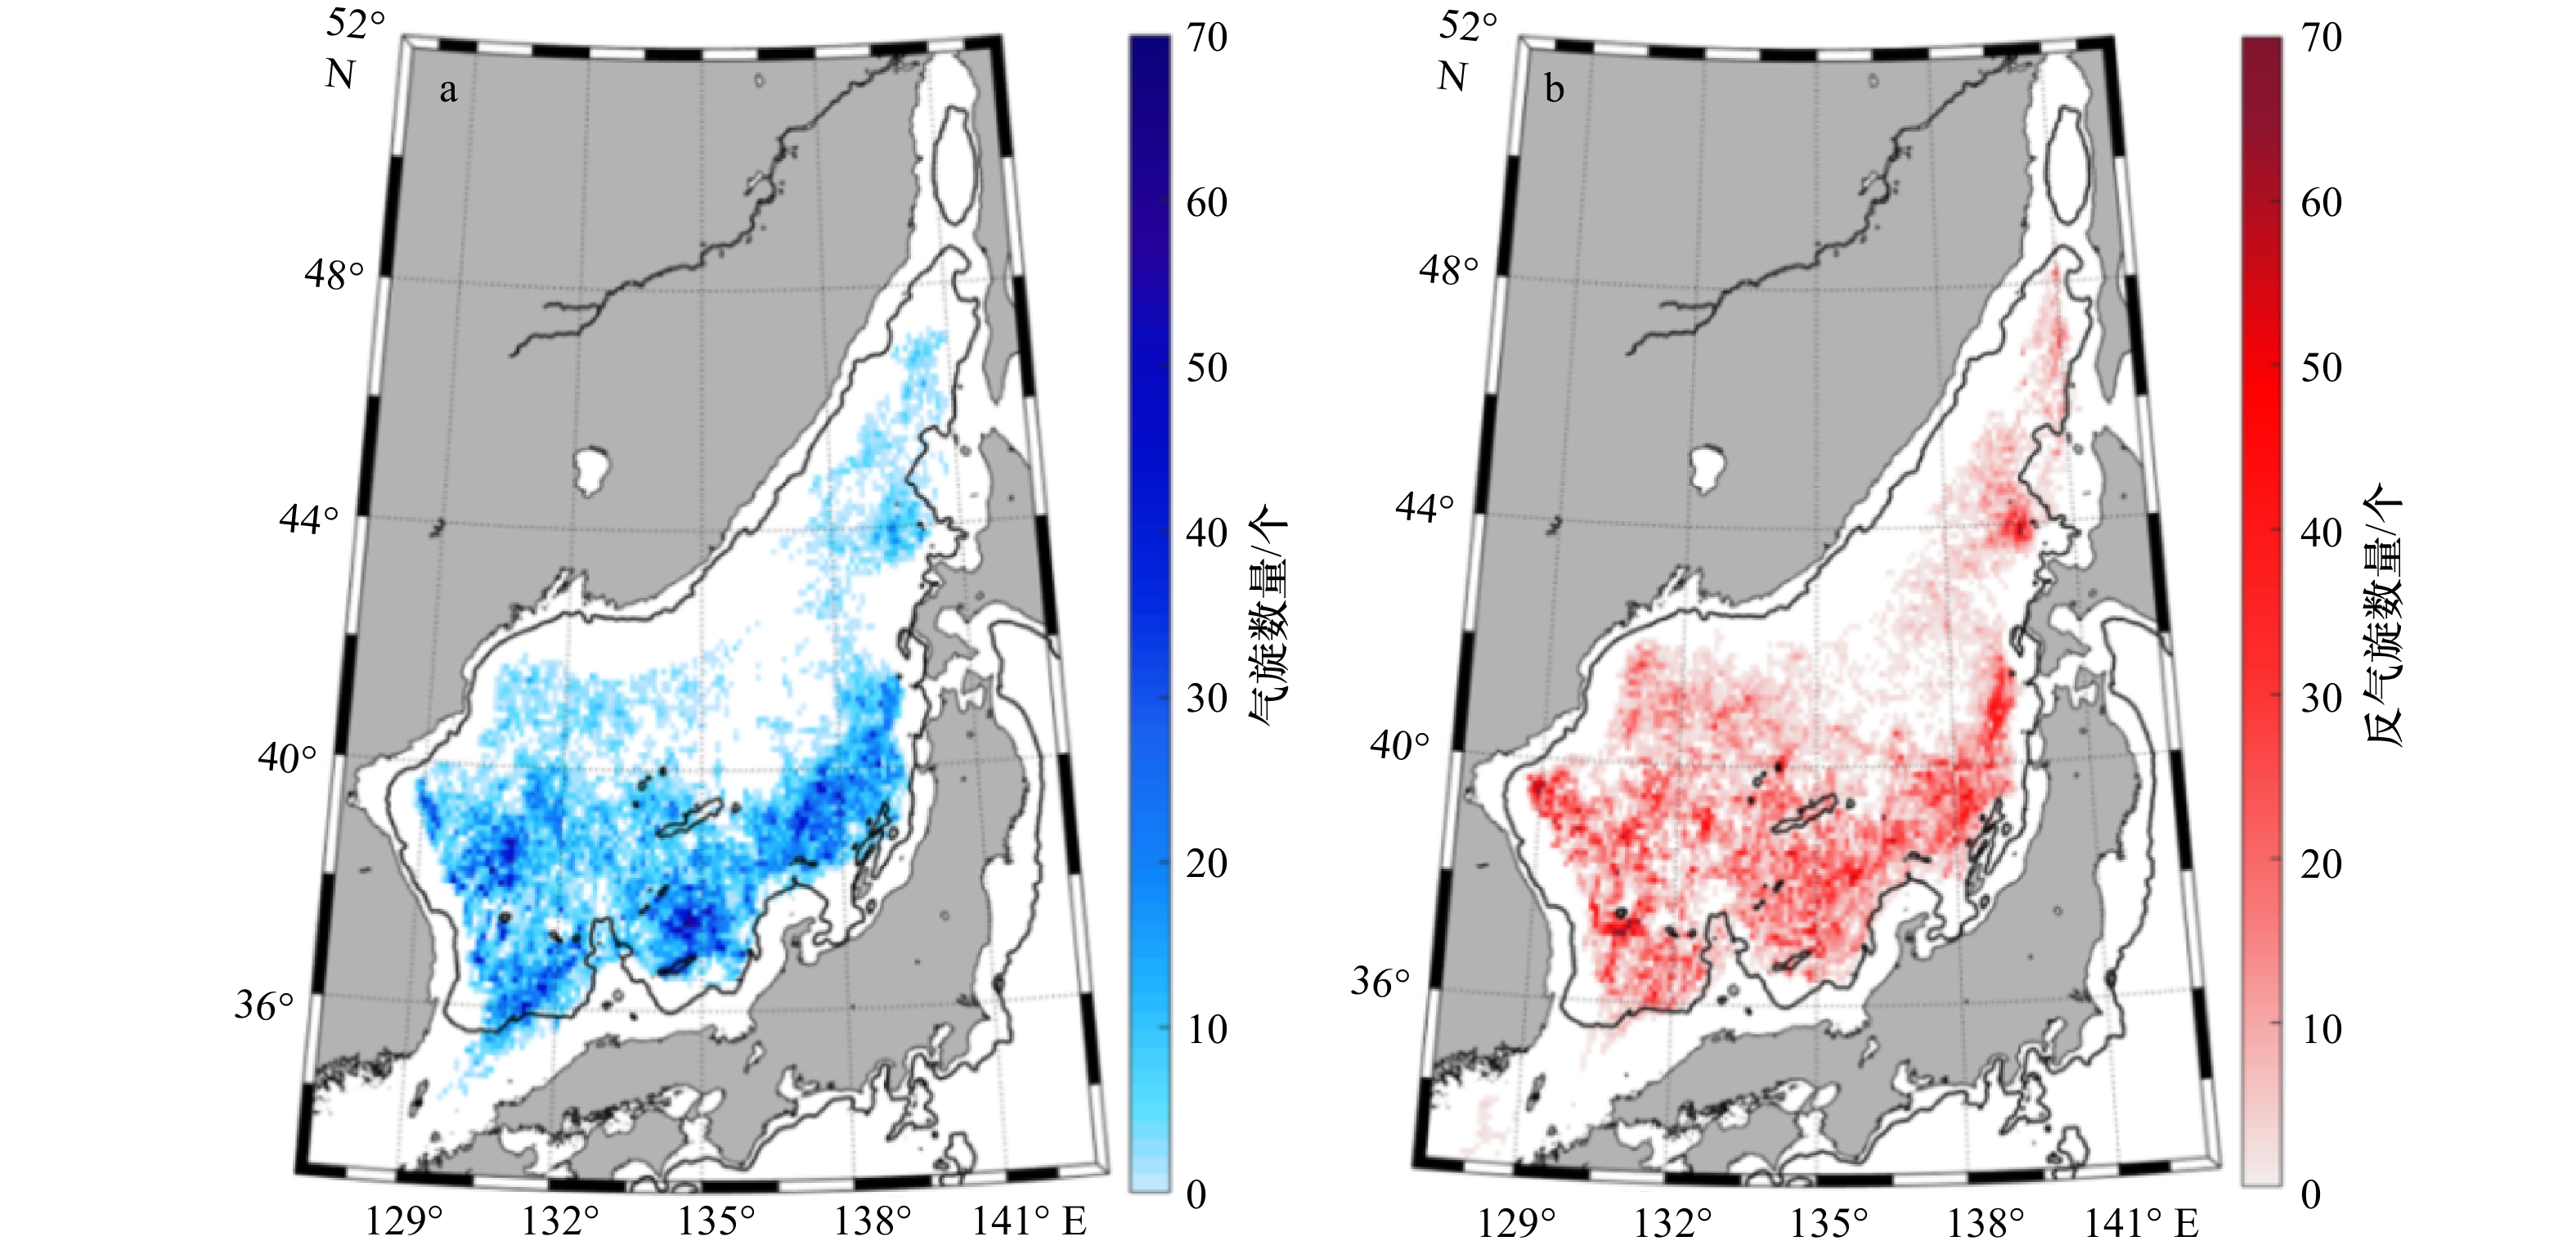
图 5 涡旋数量在0.1°×0.1°网格内的空间分布
图a为气旋图,b为反气旋,背景颜色为涡旋数量,黑线轮廓线为500 m等深线
Fig. 5 Spatial distribution of average eddy number over 0.1°×0.1° bins
a is cyclonic eddies and b is anticyclonic eddies. The background color is the number of eddies and the outline of the black line is the 500 m isobath line
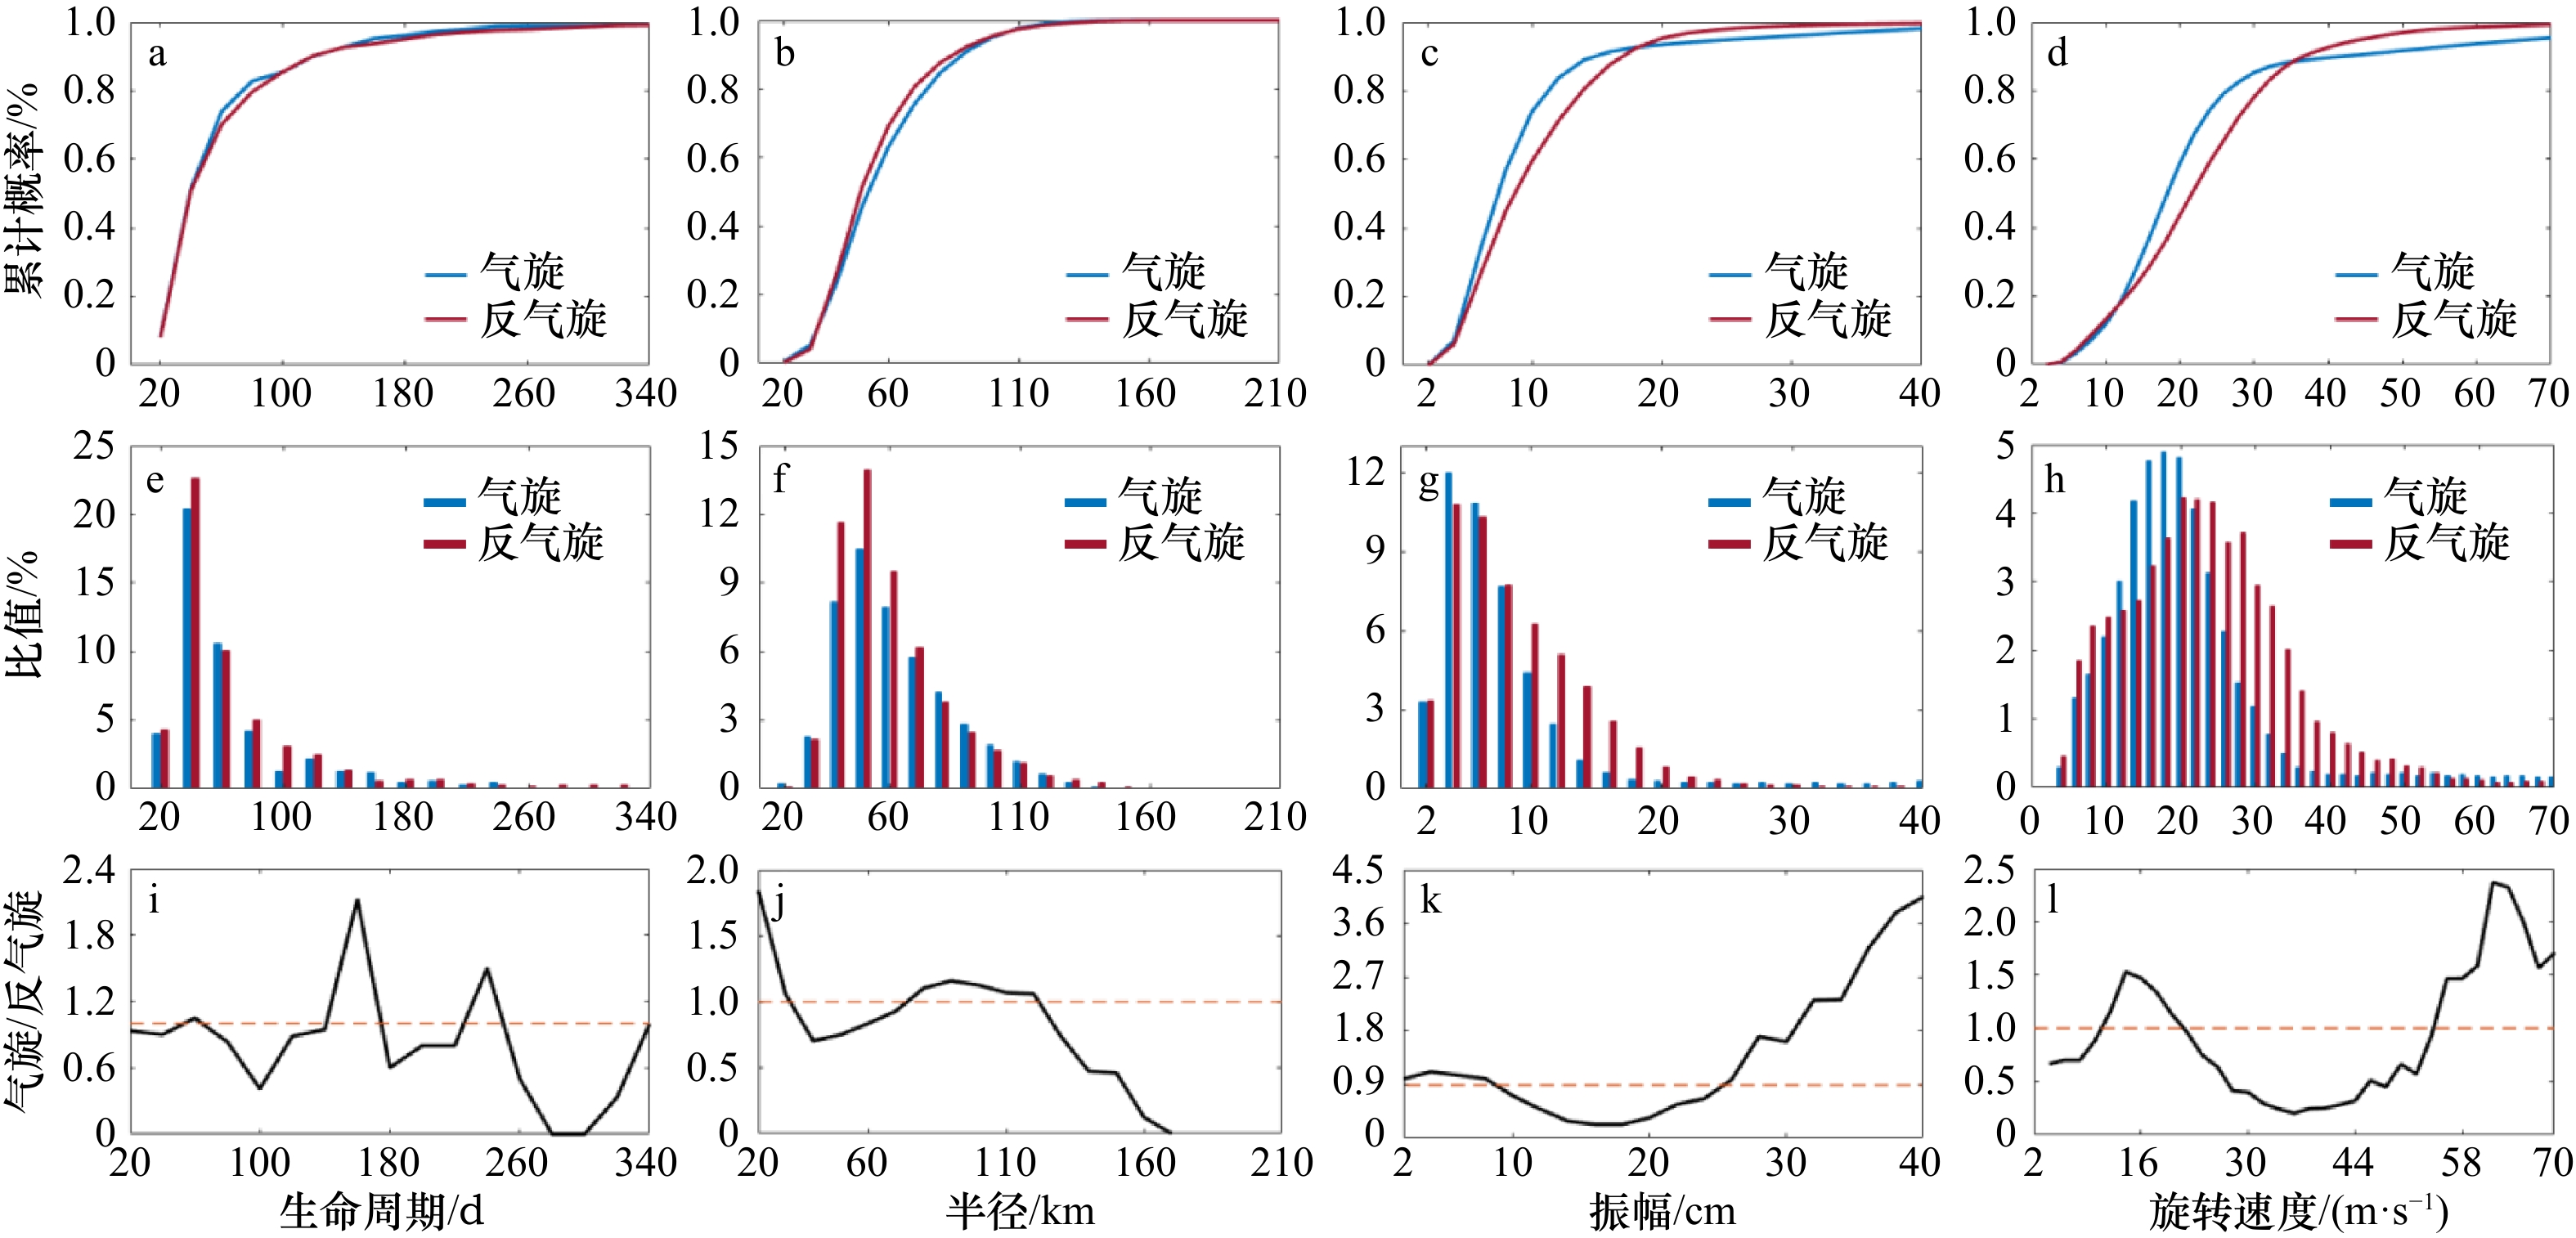
图 6 涡旋生命周期(a、e、i)、半径(b、f、j)、振幅(e、g、k)和旋转速度(d、h、l)分布
a–d、e–h和i–l分别是累积曲线图、柱状图和气旋与反气旋的比值图,其中e–h行为不同极性涡旋占总涡旋的比值,i–l比值图中虚线表示1
Fig. 6 Distribution of eddy life cycle (a, e, i), radius (b, f, j), amplitude (e, g, k), and rotation velocity (d, h, l)
a–d, e–h and i–l are cumulative curves, bars, and cyclonic eddies to anticyclonic eddies ratios, respectively. e–h is the ratio of eddies with different polarities to the total number of eddies, and the dotted line in i–l ratio graph indicates 1
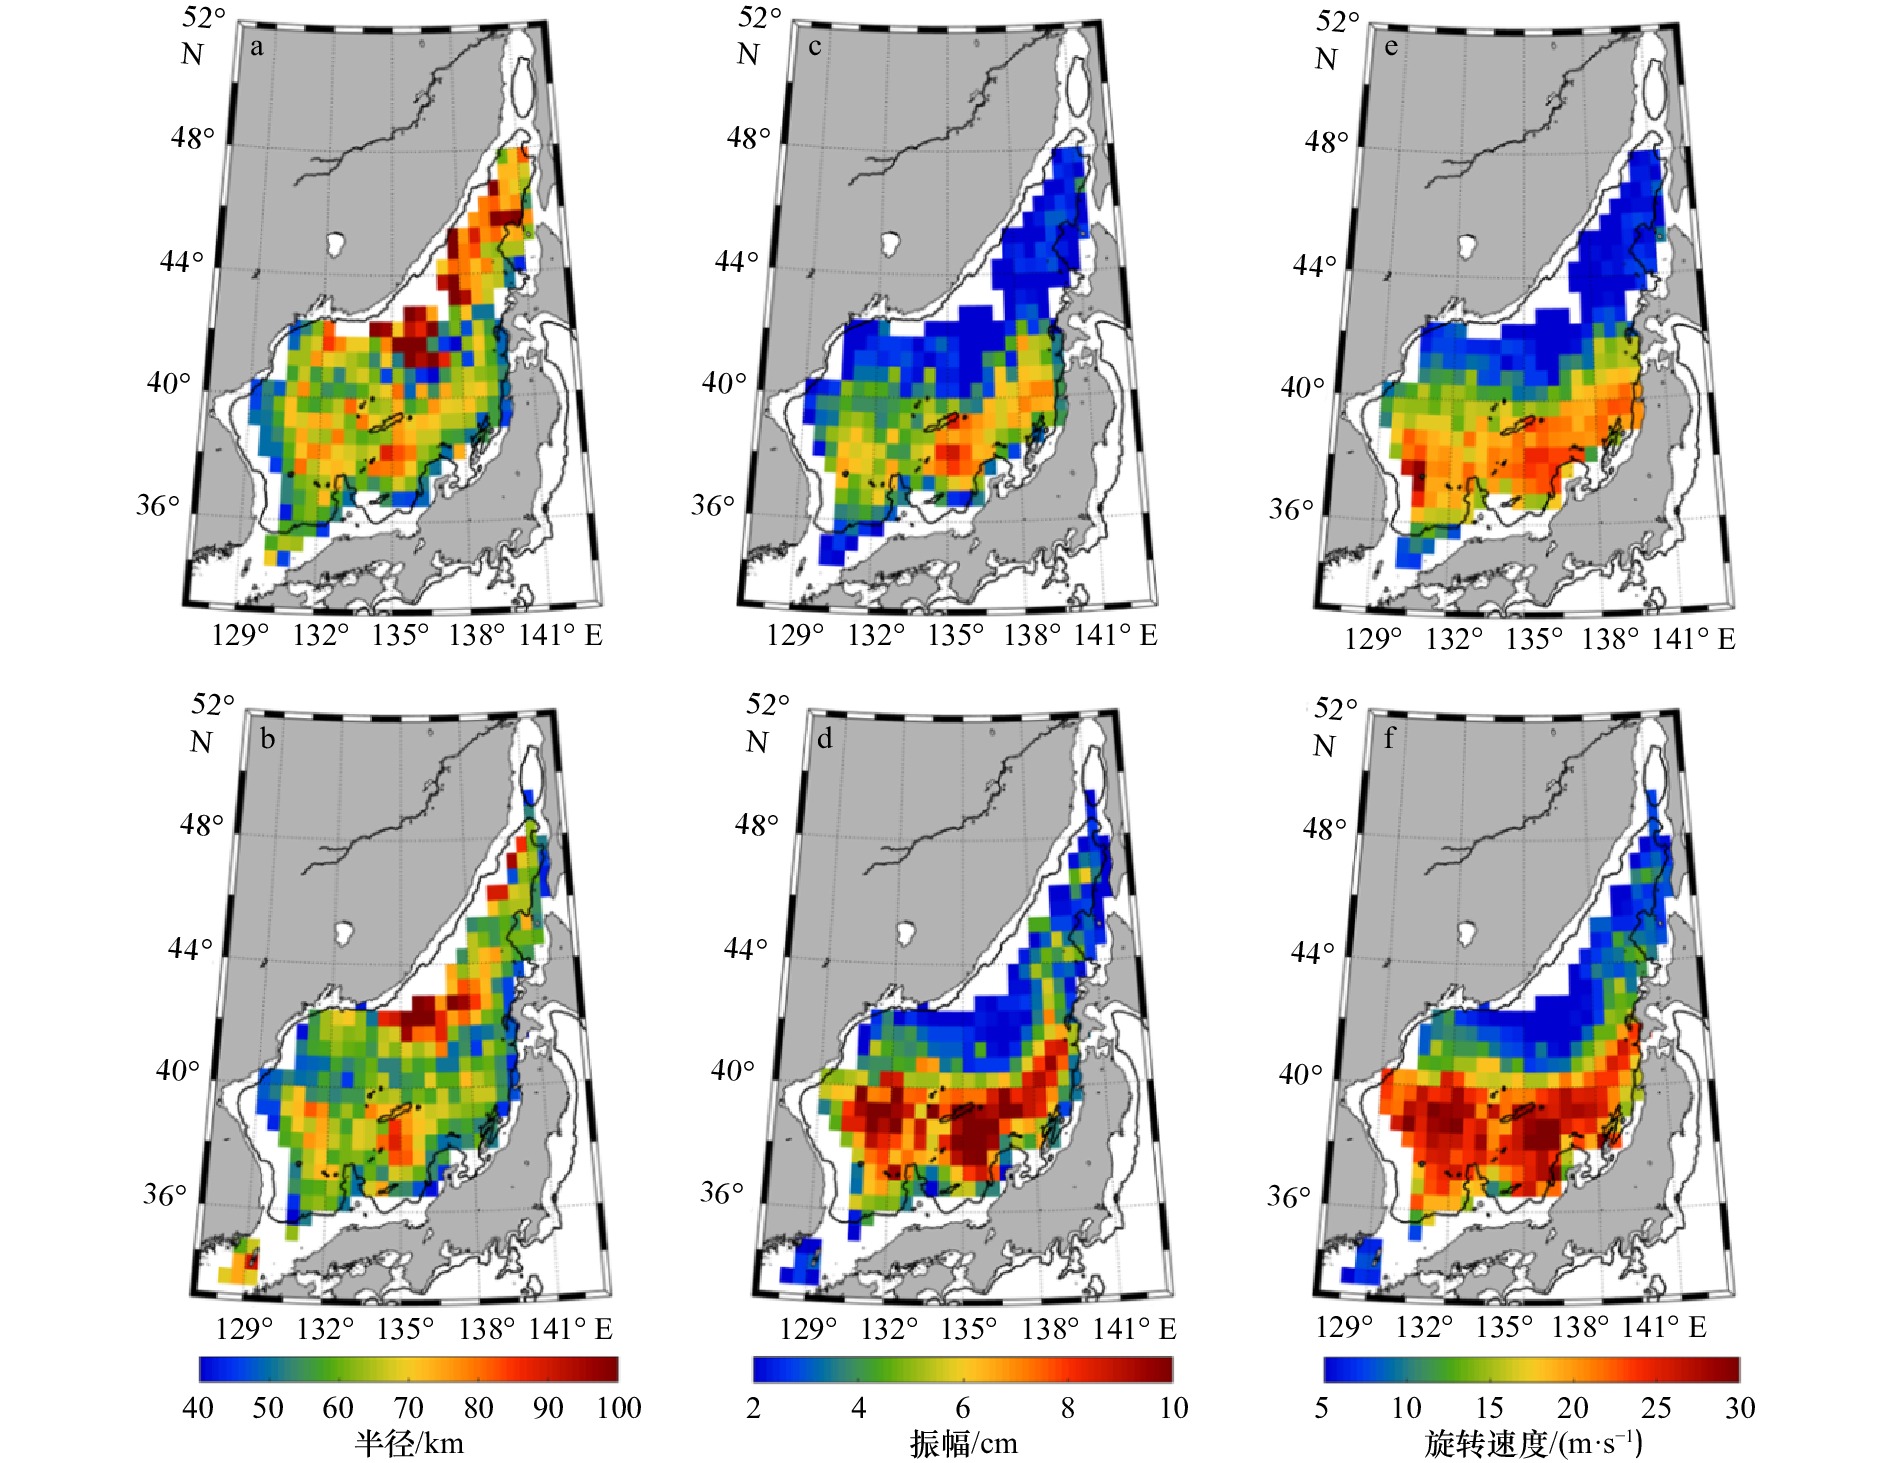
图 7 涡旋半径(a,b)、振幅(c,d)和旋转速度(e,f)在0.5°×0.5°网格内的空间分布
上、下行分别为气旋和反气旋,黑色轮廓线为500 m等深线
Fig. 7 Spatial distribution of eddy radius (a, b), amplitude (c, d) and rotation velocity (e, f) in a 0.5°×0.5° grid
The upper and lower lines are cyclonic eddies and anticyclonic eddies respectively, and the black line contour line is 500 m isobath line

图 8 半径(a,b)、振幅(c,d)和旋转速度(e,f)的年际变化(a,c,e)和月变化(b,d,f)
阴影部分为统计检验,由$\text{µ} \pm \sigma (t)/\sqrt {N(t)}$计算所得,$\text{µ}$表示为平均值,$\sigma $为标准差,N为数据量
Fig. 8 Interannual (a, c, e) and seasonal (b, d, f) variations of eddy radius (a, b), amplitude (c, d) and rotation velocity (e, f)
The shaded part is the statistical test, which is calculated by $\text{µ} \pm \sigma (t)/\sqrt {N(t)}$, $\text{µ}$ is the mean value, $\sigma $ is the standard deviation, and N is the data amount

图 9 涡旋半径(a)、振幅(b)和旋转速度(c)随生命周期的演变
点为各参数的实际结果,实线则为对应参数的傅里叶拟合结果
Fig. 9 Time evolution of the mean normalized eddy radius (a), amplitude (b) and rotation velocity (c)
The point is the actual result of each parameter, and the solid line is the Fourier fitting result of the corresponding parameter
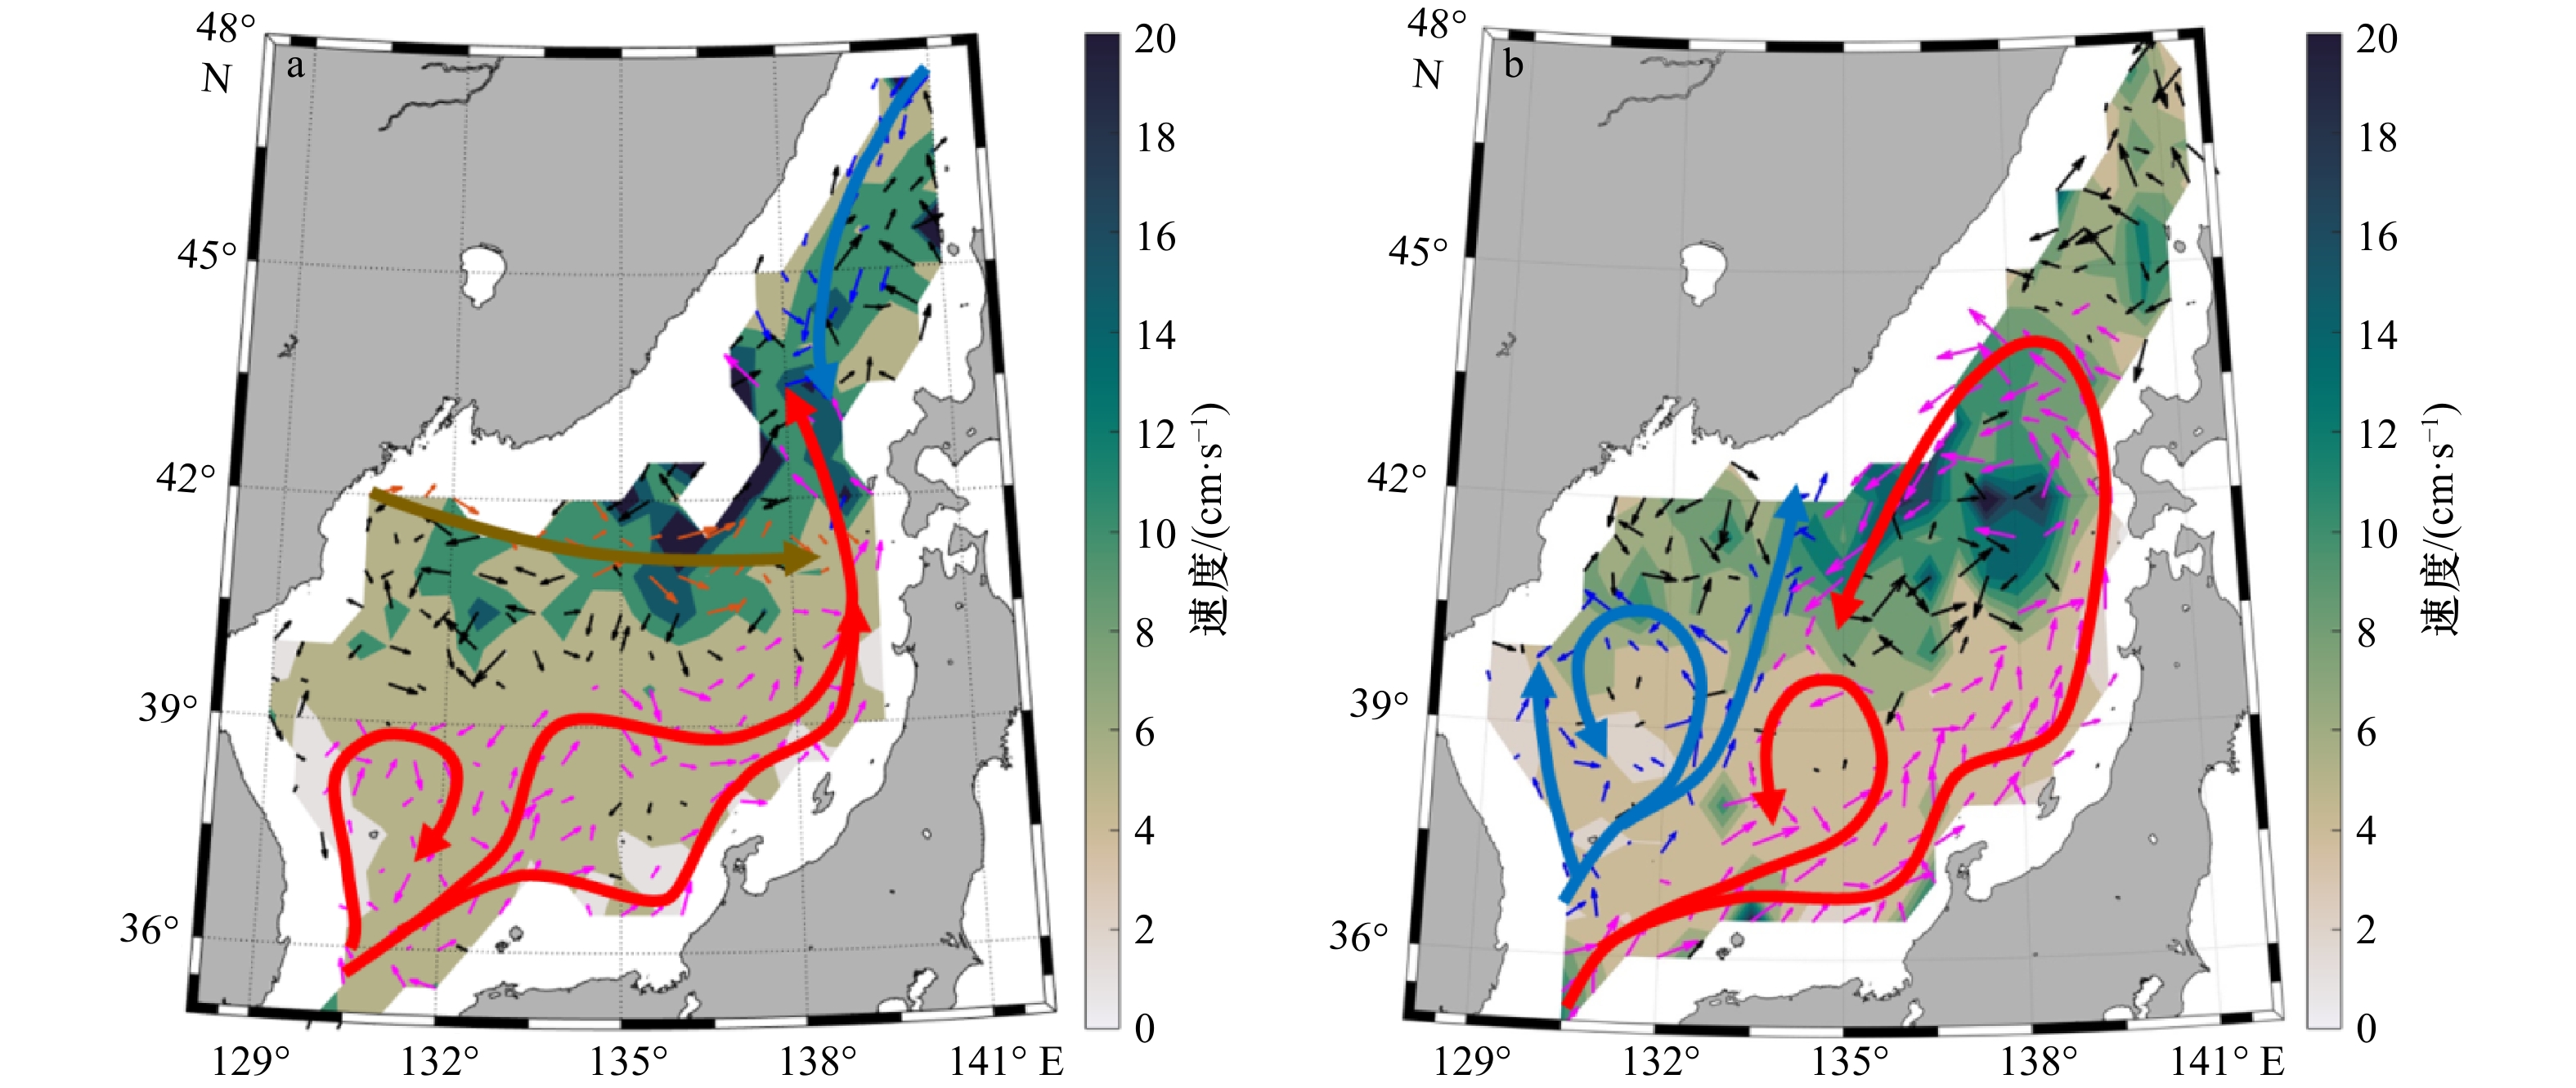
图 10 气旋(a)和反气旋(b)在0.5°×0.5°网格内的传播示意图
箭头代表相对传播方向,各线条为不同传播路径示意图
Fig. 10 Schematic diagram of cyclonic eddies (a) and anticyclonic eddies (b) propagation in a 0.5°×0.5° grid
The arrow represents the relative propagation direction, and each line is the schematic diagram of different propagation paths
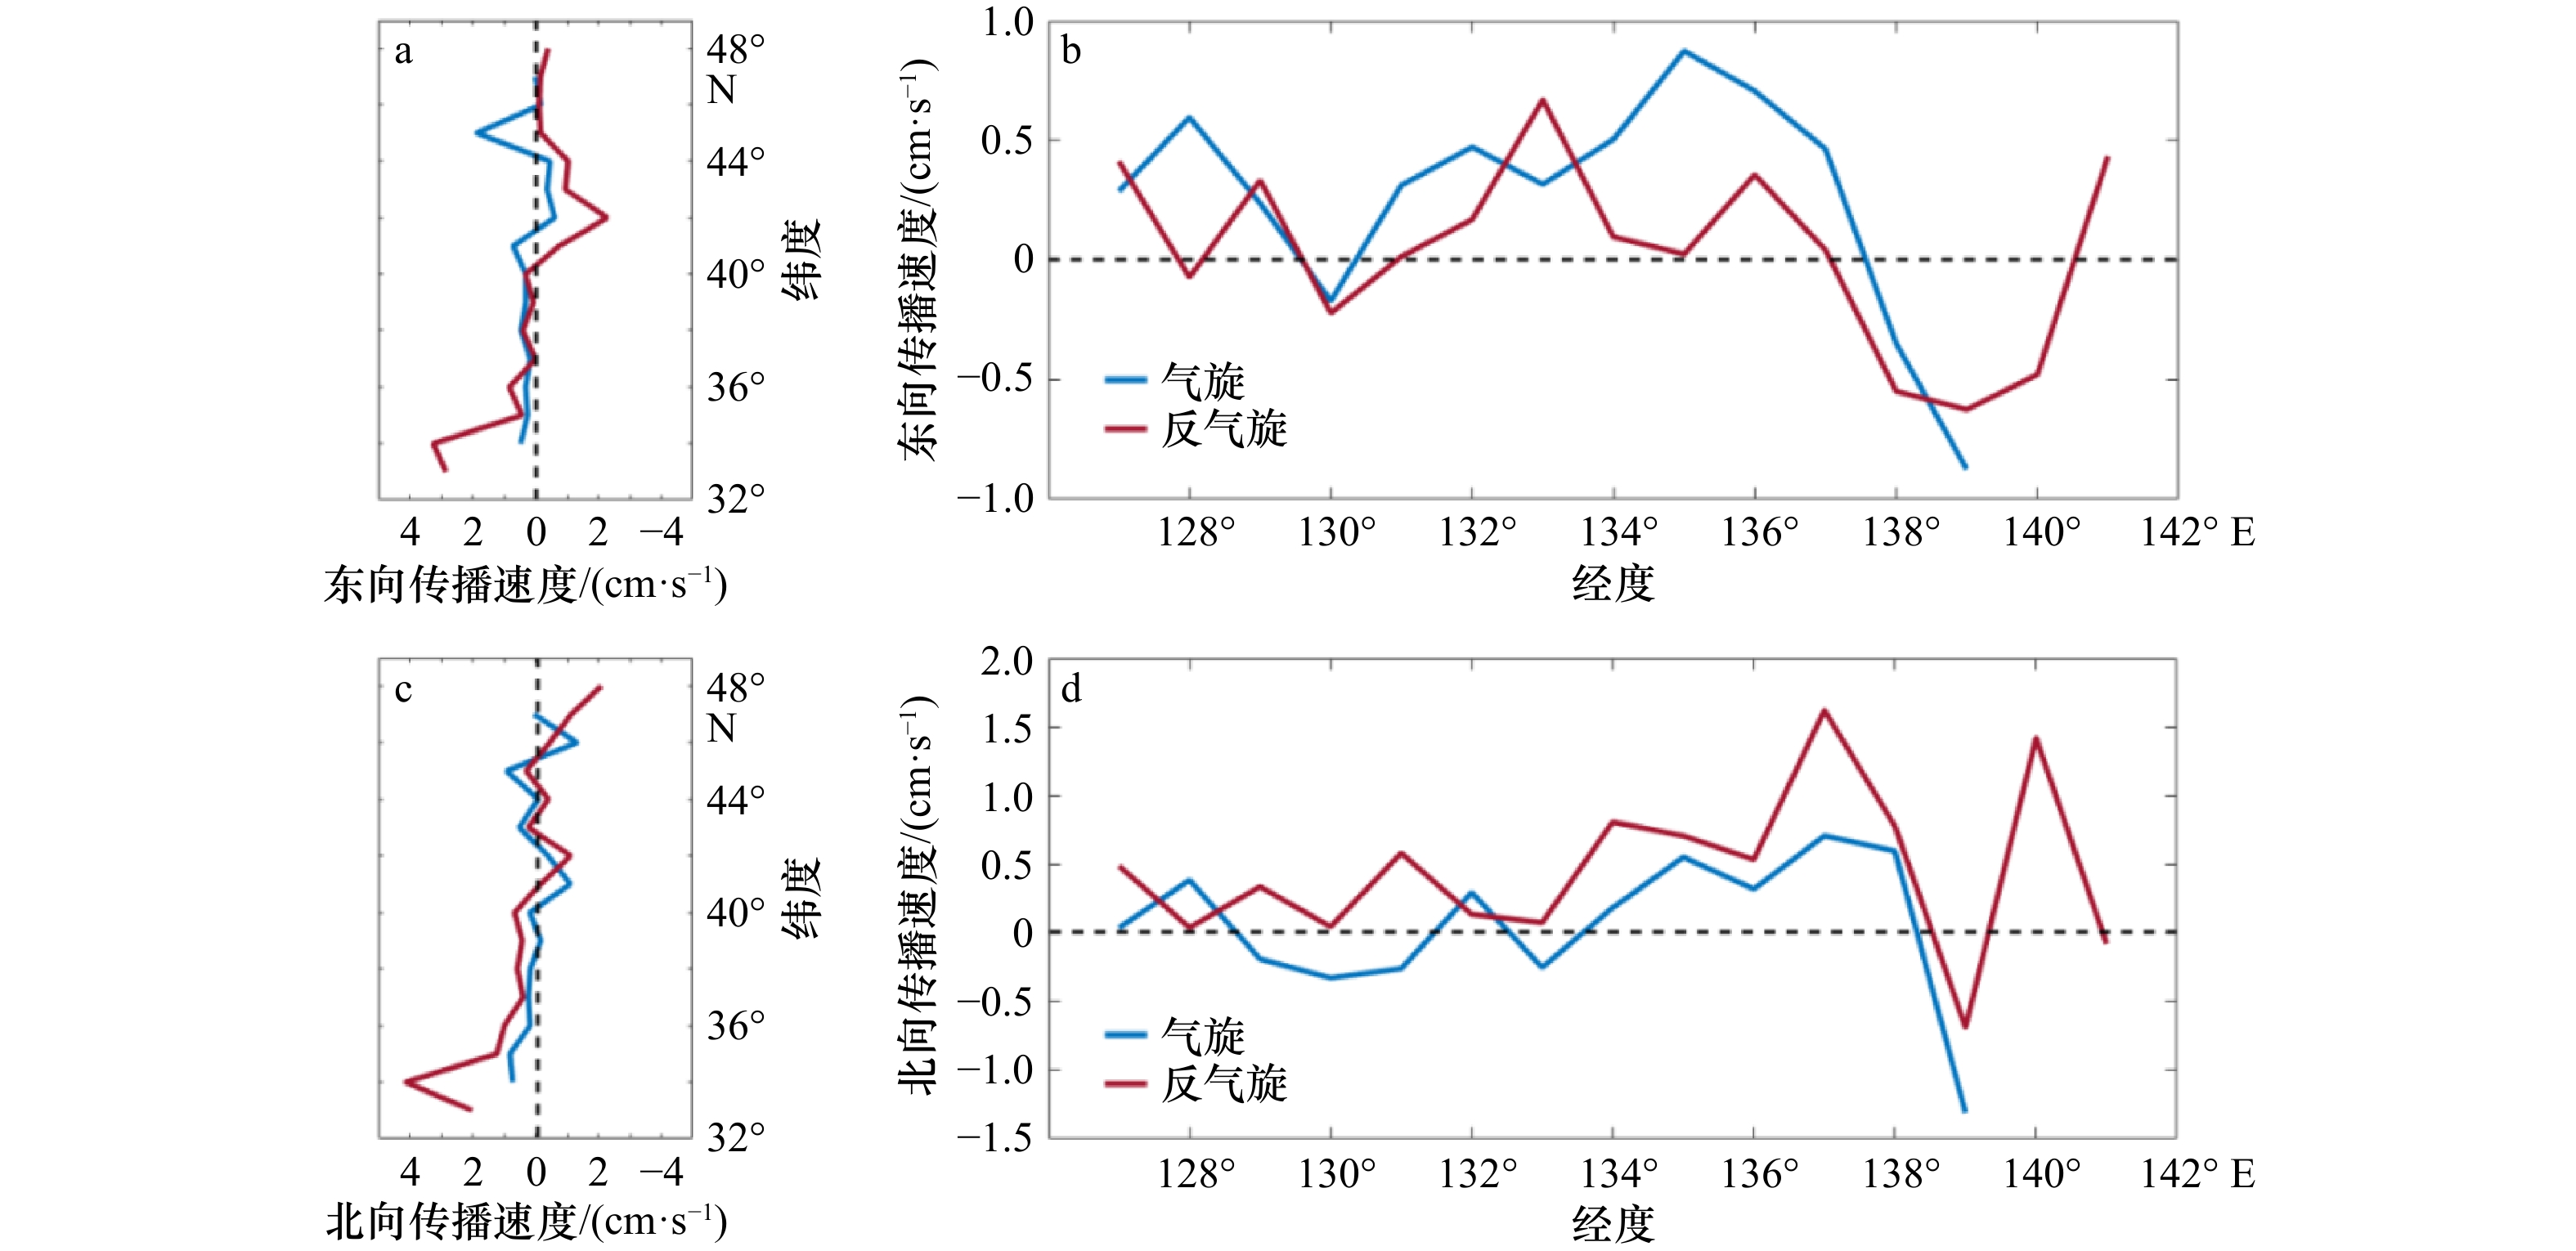
图 11 涡旋纬向和经向的平均传播速度
东向传播速度随纬度(a)、经度(b)的变化和北向传播速度随纬度(c)、经度(d)的变化。虚线表示速度零度线
Fig. 11 Zonal and meridional average propagation speeds of eddies
Eastward speed variation with latitude (a) and longitude (b). Northward speed variation with latitude (c) and longitude (d). The dotted line indicates that the speed is 0
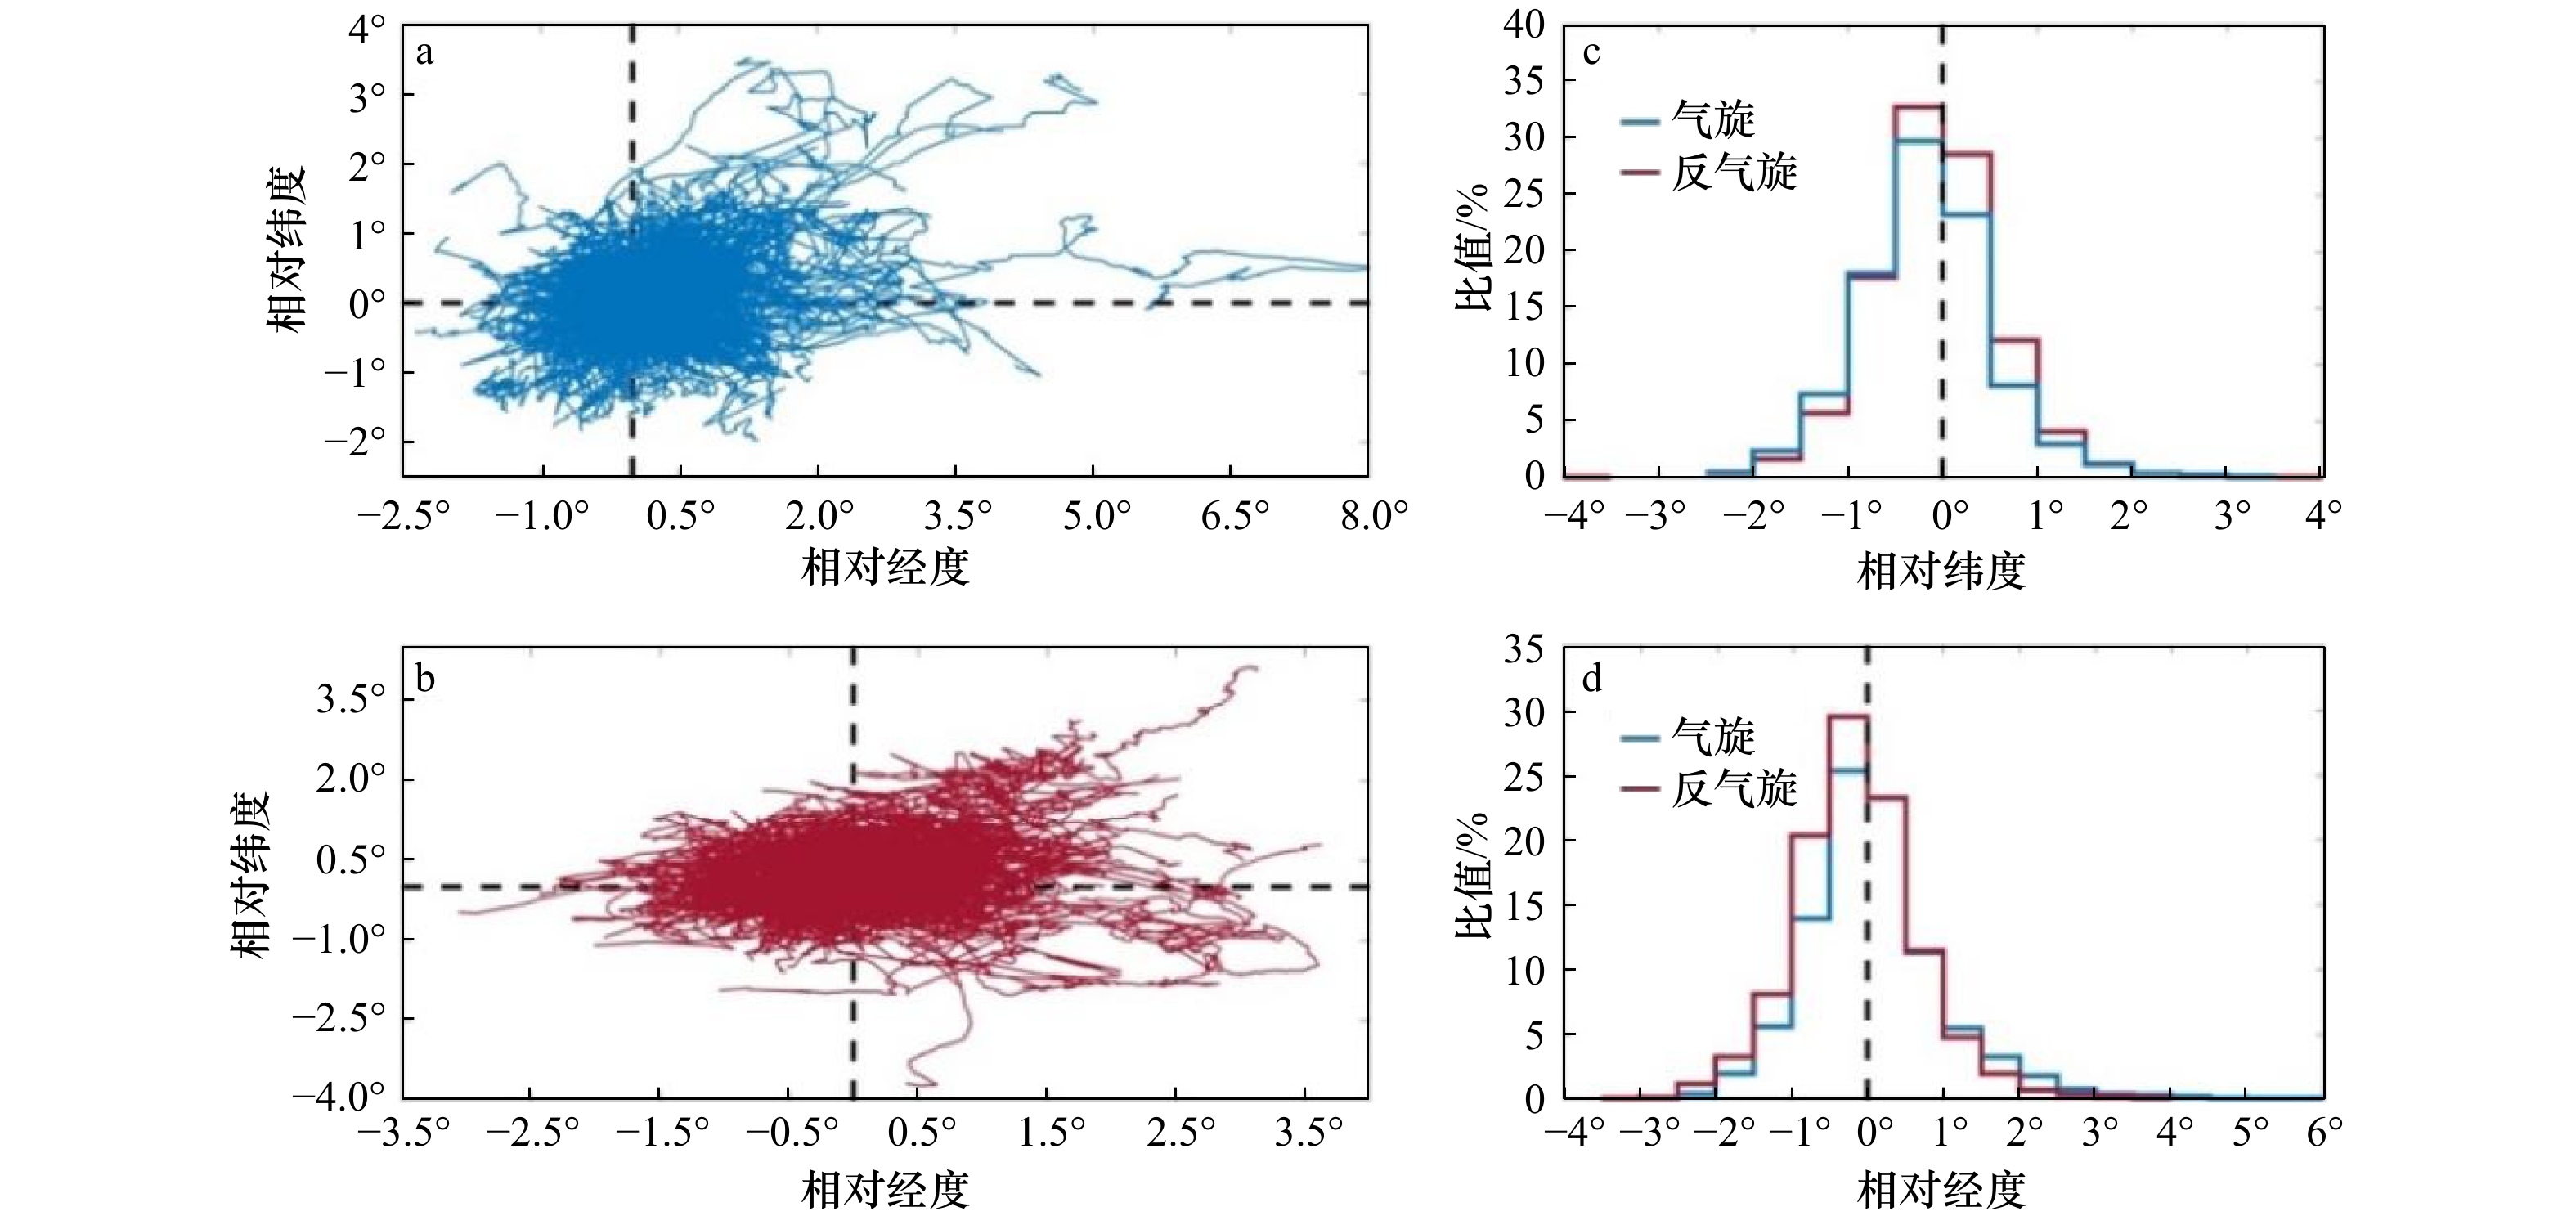
图 12 气旋(a)和反气旋(b)相对传播轨迹和涡旋北向(c)、东向(d)移动的概率分布
黑色虚线为零度线,c、d中纵坐标为不同极性涡旋占总涡旋数比值
Fig. 12 Probability distribution of relative trajectories of cyclonic eddies (a) and anticyclonic eddies (b) and eddies moving northward (c) and eastward (d)
The black dotted line is the zero line. y-axis in c and d is the ratio of eddies with different polarities to the total number of eddies
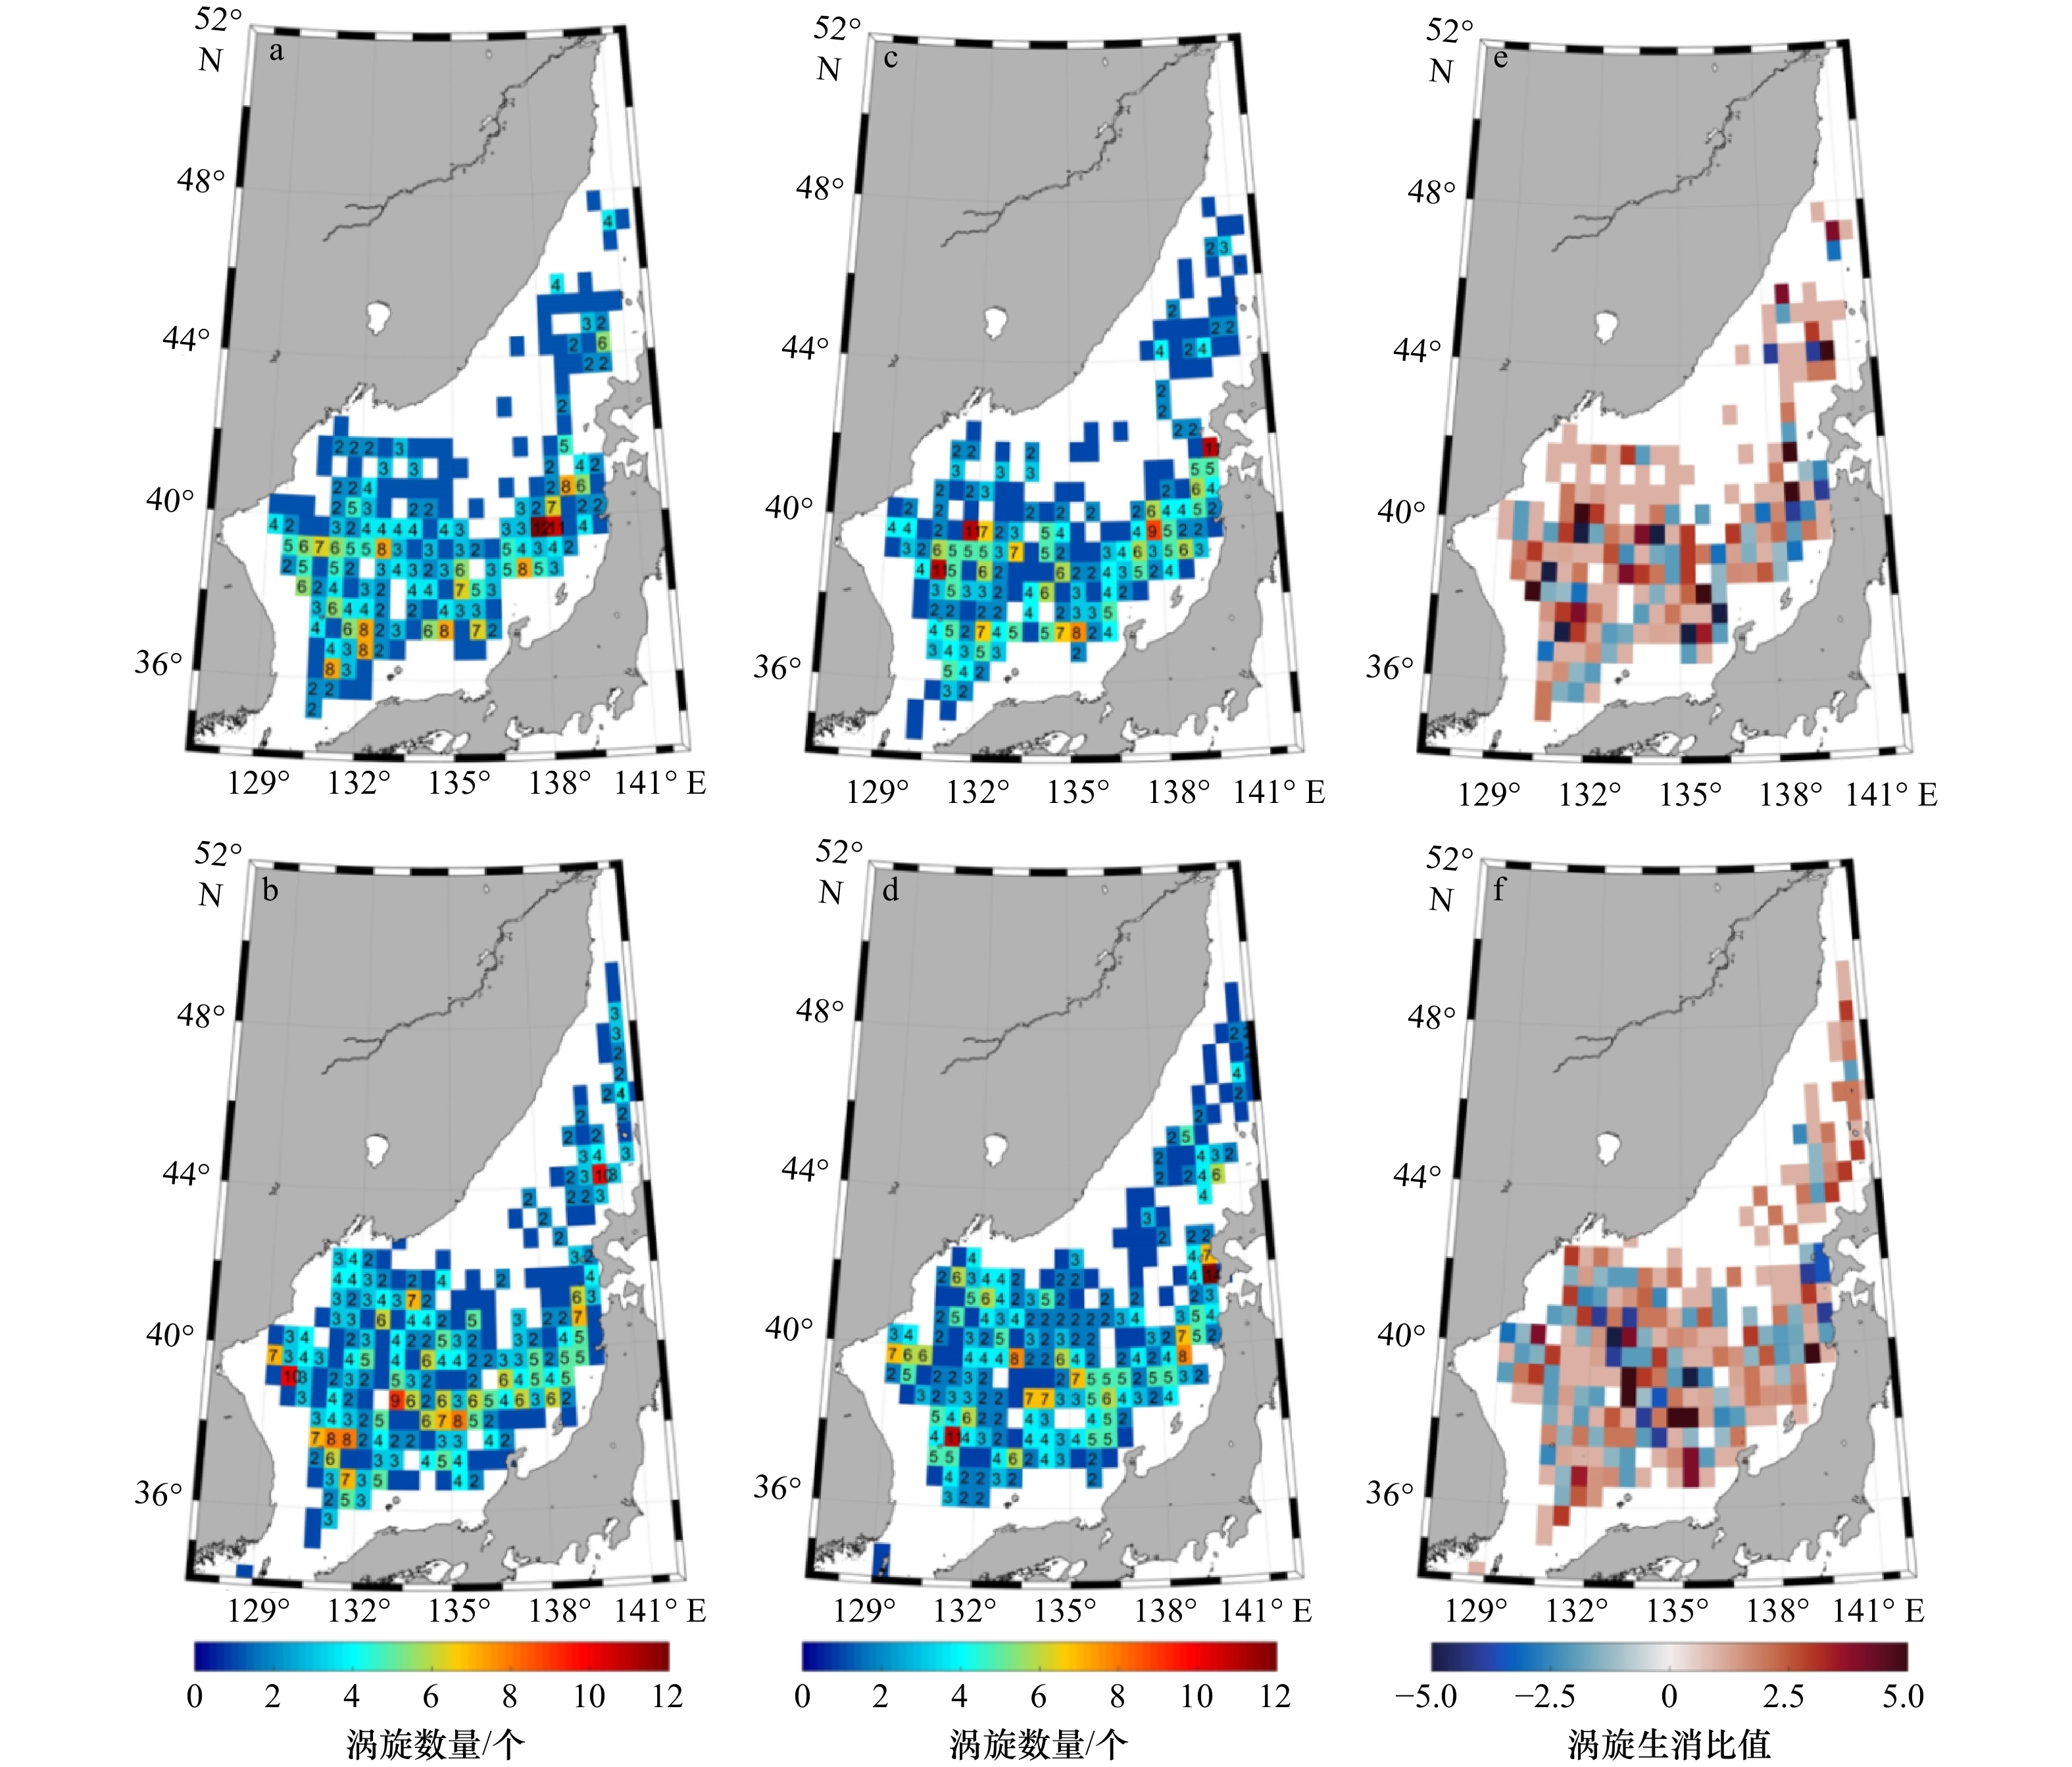
图 13 气旋(a,c,e)和反气旋(b,d,f)在0.5°×0.5°的网格内的空间分布
a、b为涡旋产生,c、d为涡旋消亡,e、f为涡旋生消比值,正值表示涡旋生成数大于涡旋消亡数,值大小为生成数/消亡数;负值表示涡旋消亡数大于生成数,值大小为消亡数/生成数
Fig. 13 Spatial distribution of cyclonic eddies (a, c, e) and anticyclonic eddies (b, d, f) in a 0.5°×0.5° grid
a and b are eddy generation, c and d are eddy extinction, e and f are eddy generation-extinction ratio. The positive value is that the number of eddy generation is greater than the number of eddy extinction, and the value is the generation/extinction number. A negative value means that the number of eddies dying is greater than the number of generation, and the value is the number of eddies dying/number of generation
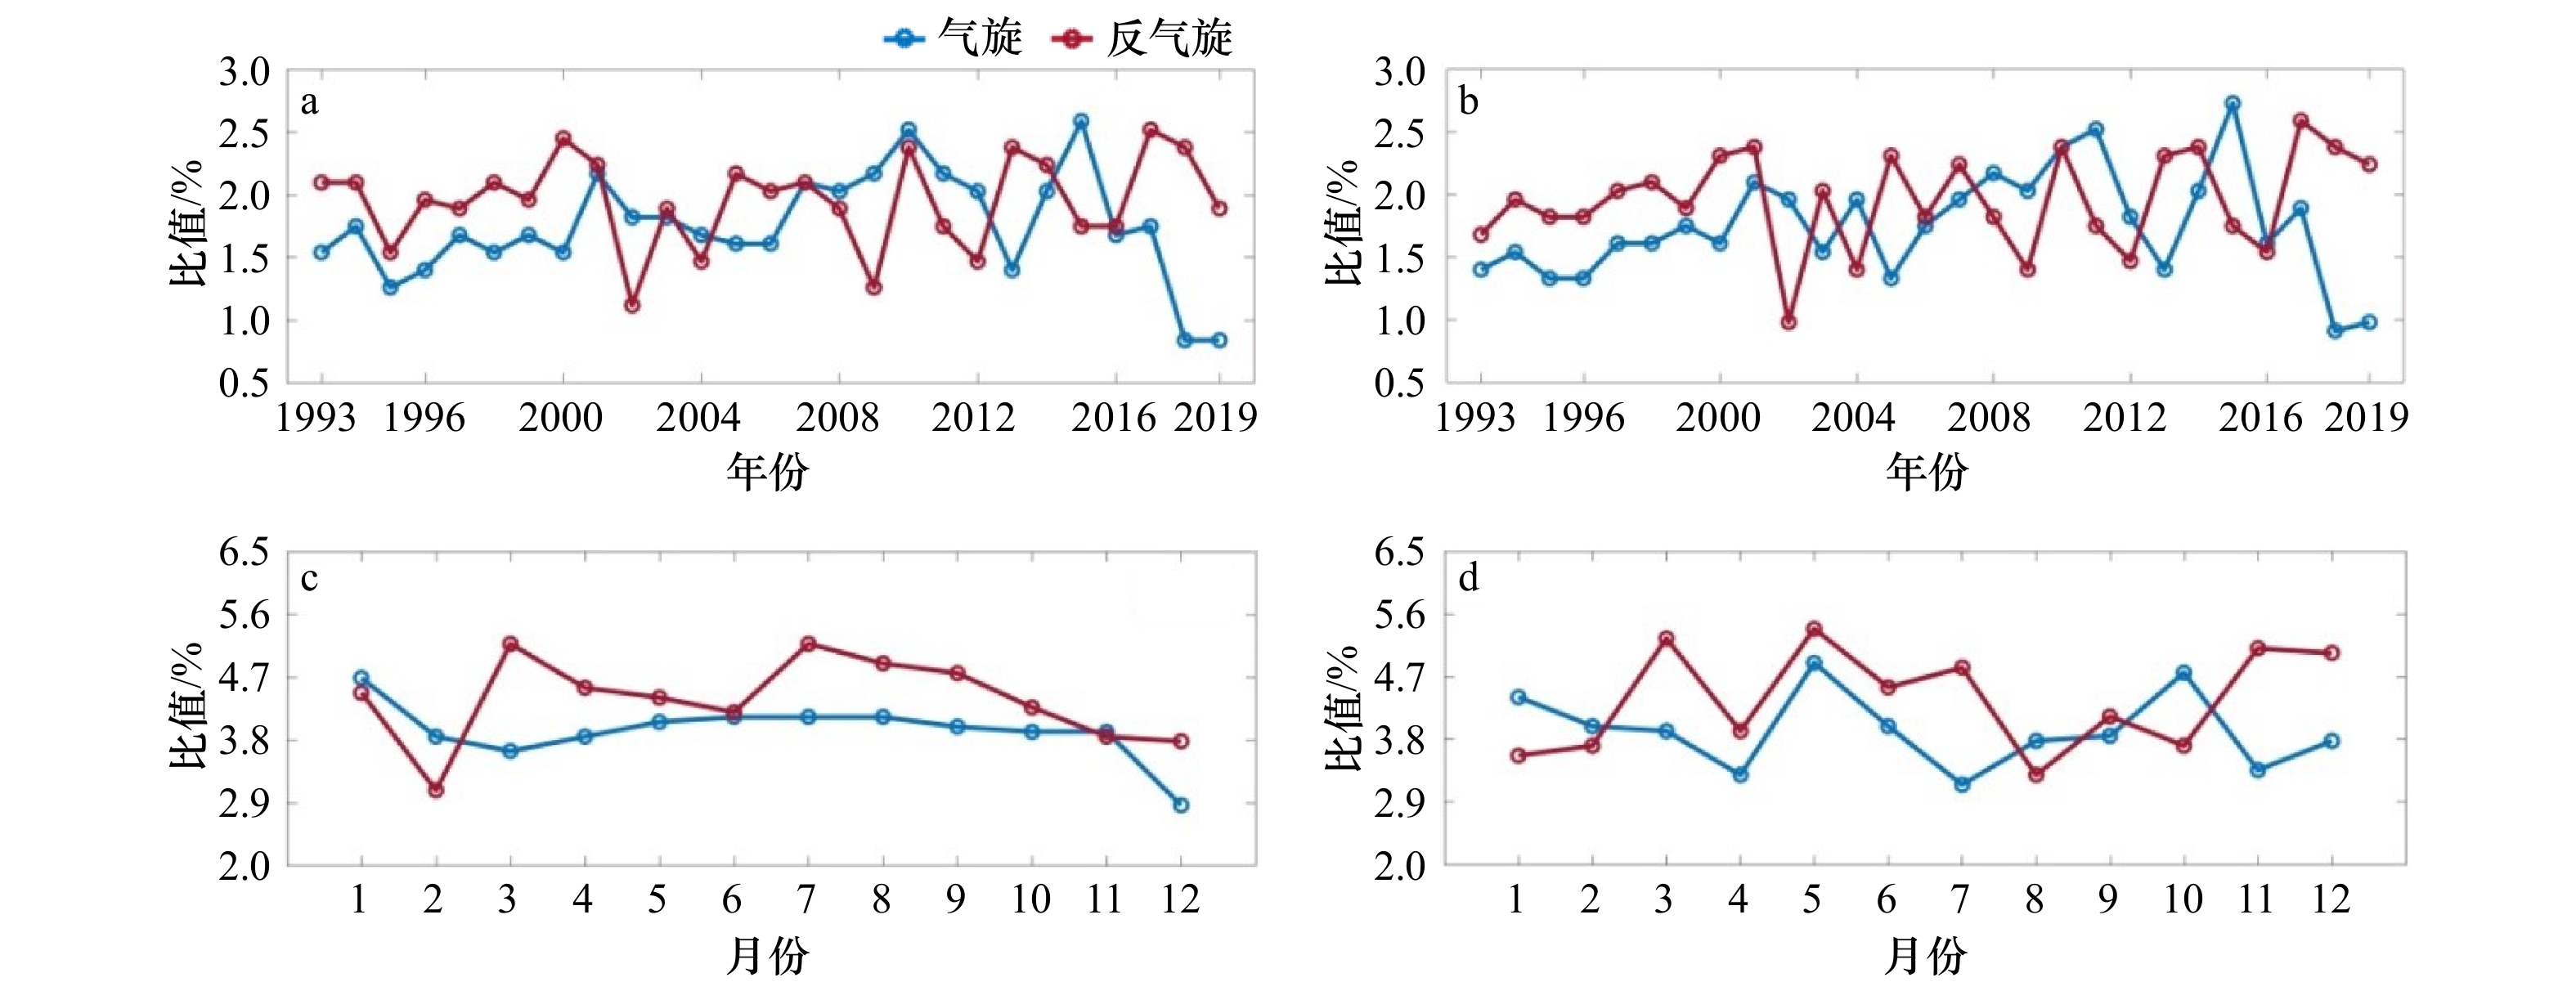
图 14 涡旋产生和消亡的年际变化(a,b)与月变化(c,d)
a、c表示涡旋产生,b、d表示涡旋消亡,纵坐标为不同极性涡旋占总涡旋数的比值
Fig. 14 Interannual variation (a, b) and monthly variation (c, d) of eddy generation and extinction
a and c represent the generation of eddies. b and d represent the extinction of eddies. y-axis is the ratio of eddies with different polarities to the total number of eddies

图 15 研究区域内经向SST梯度的年际变化(a)和月变化(b)
a中黑线表示1993–2019年月平均经向SST梯度,红线表示13个月的滑动平均;b中黑线表示经向SST梯度的季节变化,红线表示反气旋的月平均产生数量比率,蓝线表示气旋的月平均产生数量比率。CC数值代表相关系数,SG表示SST梯度,CG和AG分别表示气旋和反气旋的产生百分比,撇号表示各变量6–12月的相关系数
Fig. 15 Interannual variation (a) and monthly variation (b) of the SST gradient in the study area
a. The middle black line represents the monthly average meridional SST gradient from 1993 to 2019, and the red line represents the 13-month moving average. b.The middle black line shows the seasonal variation of the meridional SST gradient , the red line shows the ratio of the average monthly number of anticyclonic eddies and the blue line shows the ratio of the average monthly number of cyclonic eddies. The CC value represents the correlation coefficient, SG represents the SST gradient, CG and AG represent the percentage of cyclone and anticyclone eddy generation respectively, and the apostrophe represents the correlation coefficient of each variable from June to December
-
[1] Robinson A R. Eddies in Marine Science[M]. New York: Springer-Verlag, 1983: 609. [2] 李立. 南海中尺度海洋现象研究概述[J]. 台湾海峡, 2002, 21(2): 265−274.Li Li. A review on mesoscale oceanographical phenomena in the South China Sea[J]. Journal of Oceanography in Taiwan Strait, 2002, 21(2): 265−274. [3] Wang Huizan, Liu Ding, Zhang Weimin, et al. Characterizing the capability of mesoscale eddies to carry drifters in the northwest Pacific[J]. Journal of Oceanology and Limnology, 2020, 38(6): 1711−1728. doi: 10.1007/s00343-019-9149-y [4] Holland W R. The role of mesoscale eddies in the general circulation of the ocean—numerical experiments using a wind-driven quasi-geostrophic model[J]. Journal of Physical Oceanography, 1978, 8(3): 363−392. doi: 10.1175/1520-0485(1978)008<0363:TROMEI>2.0.CO;2 [5] McWilliams J C, Flierl G R. On the evolution of isolated, nonlinear vortices[J]. Journal of Physical Oceanography, 1979, 9(6): 1155−1182. doi: 10.1175/1520-0485(1979)009<1155:OTEOIN>2.0.CO;2 [6] Chelton D B, Schlax M G, Samelson R M, et al. Global observations of large oceanic eddies[J]. Geophysical Research Letters, 2007, 34(15): L15606. [7] Chelton D B, Schlax M G, Samelson R M. Global observations of nonlinear mesoscale eddies[J]. Progress in Oceanography, 2011, 91(2): 167−216. doi: 10.1016/j.pocean.2011.01.002 [8] Gruber N, Lachkar Z, Frenzel H, et al. Eddy-induced reduction of biological production in eastern boundary upwelling systems[J]. Nature Geoscience, 2011, 4(11): 787−792. doi: 10.1038/ngeo1273 [9] Liu Yu, Dong Changming, Guan Yuping, et al. Eddy analysis in the subtropical zonal band of the North Pacific Ocean[J]. Deep-Sea Research Part I: Oceanographic Research Papers, 2012, 68: 54−67. doi: 10.1016/j.dsr.2012.06.001 [10] Petersen M R, Williams S J, Maltrud M E, et al. A three-dimensional eddy census of a high-resolution global ocean simulation[J]. Journal of Geophysical Research: Oceans, 2013, 118(4): 1759−1774. doi: 10.1002/jgrc.20155 [11] Dong Changming, McWilliams J C, Liu Yu, et al. Global heat and salt transports by eddy movement[J]. Nature Communications, 2014, 5(1): 3294. doi: 10.1038/ncomms4294 [12] Sun Wenjin, Dong Changming, Wang Ruyun, et al. Vertical structure anomalies of oceanic eddies in the Kuroshio Extension region[J]. Journal of Geophysical Research: Oceans, 2017, 122(2): 1476−1496. doi: 10.1002/2016JC012226 [13] Sun Wenjin, Dong Changming, Tan Wei, et al. Statistical characteristics of cyclonic warm-core eddies and anticyclonic cold-core eddies in the north Pacific based on remote sensing data[J]. Remote Sensing, 2019, 11(2): 208. doi: 10.3390/rs11020208 [14] Lguensat R, Sun Miao, Fablet R, et al. EddyNet: a deep neural network for pixel-wise classification of oceanic eddies[C]//Proceedings of the IGARSS 2018·2018 IEEE International Geoscience and Remote Sensing Symposium. Valencia: IEEE, 2018: 1764−1767. [15] Xu Guangjun, Cheng Cheng, Yang Wenxian, et al. Oceanic eddy identification using an AI scheme[J]. Remote Sensing, 2019, 11(11): 1349. doi: 10.3390/rs11111349 [16] Duo Zijun, Wang Wenke, Wang Huizan. Oceanic mesoscale eddy detection method based on deep learning[J]. Remote Sensing, 2019, 11(16): 1921. doi: 10.3390/rs11161921 [17] Santana O J, Hernández-Sosa D, Martz J, et al. Neural network training for the detection and classification of oceanic mesoscale eddies[J]. Remote Sensing, 2020, 12(16): 2625. doi: 10.3390/rs12162625 [18] Yang Xiao, Xu Guangjun, Liu Yu, et al. Multi-source data analysis of mesoscale eddies and their effects on surface chlorophyll in the Bay of Bengal[J]. Remote Sensing, 2020, 12(21): 3485. doi: 10.3390/rs12213485 [19] Park K A, Park J E, Choi B J, et al. An oceanic current map of the east sea for science textbooks based on scientific knowledge acquired from oceanic measurements[J]. The Sea: Journal of the Korean Society of Oceanography, 2013, 18(4): 234−265. [20] Ichiye T, Takano K. Mesoscale eddies in the Sea of Japan[J]. La Mer, 1988, 26: 69−76. [21] Tanioka K. On the east Korean Warm Current (Tosen Warm Current)[J]. Oceanographical Magazine, 1968, 20: 31−38. [22] Kim K, Legeckis R. Branching of the Tsushima current in 1981–83[J]. Progress in Oceanography, 1986, 17(3/4): 265−276. [23] Isoda Y, Saitoh S I. The northward intruding eddy along the east coast of Korea[J]. Journal of Oceanography, 1993, 49(4): 443−458. doi: 10.1007/BF02234959 [24] Isoda Y. Warm eddy movements in the eastern Japan Sea[J]. Journal of Oceanography, 1994, 50(1): 1−15. doi: 10.1007/BF02233852 [25] Lie H J, Byun S K, Bang I, et al. Physical structure of eddies in the southwestern East Sea[J]. Journal of the Korean Society Oceanography, 1995, 30(3): 170−183. [26] Jacobs G A, Hogan P J, Whitmer K R. Effects of eddy variability on the circulation of the Japan/East Sea[J]. Journal of Oceanography, 1999, 55(2): 247−256. doi: 10.1023/A:1007898131004 [27] Morimoto A, Yanagi T, Kaneko A. Eddy field in the Japan Sea derived from satellite altimetric data[J]. Journal of Oceanography, 2000, 56(4): 449−462. doi: 10.1023/A:1011184523983 [28] Ebuchi N, Hanawa K. Influence of mesoscale eddies on variations of the Kuroshio path south of Japan[J]. Journal of Oceanography, 2003, 59(1): 25−36. doi: 10.1023/A:1022856122033 [29] Mitchell D A, Teague W J, Wimbush M, et al. The Dok cold eddy[J]. Journal of Physical Oceanography, 2005, 35(3): 273−288. doi: 10.1175/JPO-2684.1 [30] Lee D K, Niiler P P. The energetic surface circulation patterns of the Japan/East Sea[J]. Deep-Sea Research Part II: Topical Studies in Oceanography, 2005, 52(11/13): 1547−1563. [31] Lee D K, Niiler P. Eddies in the southwestern East/Japan Sea[J]. Deep-Sea Research Part I: Oceanographic Research Papers, 2010, 57(10): 1233−1242. doi: 10.1016/j.dsr.2010.06.002 [32] Shin H R, Kim I, Kim D, et al. Physical characteristics and classification of the Ulleung warm eddy in the East Sea (Japan Sea)[J]. The Sea: Journal of the Korean Society of Oceanography, 2019, 24(2): 298−317. [33] Hogan P J, Hurlburt H E. Why do intrathermocline eddies form in the Japan/East Sea? A modeling perspective[J]. Oceanography, 2006, 19(3): 134−143. doi: 10.5670/oceanog.2006.50 [34] Gordon A L, Giulivi C F, Lee C M, et al. Japan/East Sea intrathermocline eddies[J]. Journal of Physical Oceanography, 2002, 32(6): 1960−1974. doi: 10.1175/1520-0485(2002)032<1960:JESIE>2.0.CO;2 [35] Yong H J, Jang G C, Jinku P. Physical boundaries of intrathermocline Ulleung eddies in the East/Japan Sea[J]. Deep-Sea Research Part II: Topical Studies in Oceanography, 2017, 143: 15−23. doi: 10.1016/j.dsr2.2016.09.004 [36] Gaube P, McGillicuddy Jr D J, Chelton D B, et al. Regional variations in the influence of mesoscale eddies on near-surface chlorophyll[J]. Journal of Geophysical Research: Oceans, 2014, 119(12): 8195−8220. doi: 10.1002/2014JC010111 [37] Dufois F, Hardman-Mountford N J, Greenwood J, et al. Anticyclonic eddies are more productive than cyclonic eddies in subtropical gyres because of winter mixing[J]. Science Advances, 2016, 2(5): e1600282. doi: 10.1126/sciadv.1600282 [38] Maúre E R, Ishizaka J, Sukigara C, et al. Mesoscale eddies control the timing of spring phytoplankton blooms: a case study in the Japan Sea[J]. Geophysical Research Letters, 2017, 44(21): 11115−11124. [39] 赵新华, 侯一筠, 刘泽, 等. 基于卫星高度计和浮标漂流轨迹的海洋涡旋特征信息对比分析[J]. 海洋与湖沼, 2019, 50(4): 759−764. doi: 10.11693/hyhz20181100269Zhao Xinhua, Hou Yijun, Liu Ze, et al. Analysis of the global eddies based on altimeter snapshots and buoy drifting trajectory data[J]. Journal of Oceanologia and Limnologia, 2019, 50(4): 759−764. doi: 10.11693/hyhz20181100269 [40] Meng Yao, Liu Hailong, Lin Pengfei, et al. Oceanic mesoscale eddy in the Kuroshio extension: comparison of four datasets[J]. Atmospheric and Oceanic Science Letters, 2020, 14(1): 100011. [41] Teague W J, Jacobs G A, Ko D S, et al. Connectivity of the Taiwan, Cheju, and Korea straits[J]. Continental Shelf Research, 2003, 23(1): 63−77. doi: 10.1016/S0278-4343(02)00150-4 [42] Chen Gengxin, Wang Dongxiao, Hou Yijun. The features and interannual variability mechanism of mesoscale eddies in the Bay of Bengal[J]. Continental Shelf Research, 2012, 47: 178−185. doi: 10.1016/j.csr.2012.07.011 [43] Takematsu M, Ostrovski A G, Nagano Z. Observations of eddies in the Japan Basin interior[J]. Journal of Oceanography, 1999, 55(2): 237−246. doi: 10.1023/A:1007846114165 [44] Kim C H, Lie H J, Chu K S. On the intermediate water in the southwestern East Sea (Sea of Japan)[J]. Elsevier Oceanography Series, 1991, 54: 129−141. [45] Arruda W Z, Nof D, O’Brien J J. Does the Ulleung eddy owe its existence to β and nonlinearities?[J]. Deep-Sea Research Part I: Oceanographic Research Papers, 2004, 51(12): 2073−2090. doi: 10.1016/j.dsr.2004.07.014 [46] Rhines P B. Vorticity Dynamics of the oceanic general circulation[J]. Annual Review of Fluid Mechanics, 1986, 18(1): 433−497. doi: 10.1146/annurev.fl.18.010186.002245 [47] Zhong Yisen, Bracco A, Villareal T A. Pattern formation at the ocean surface: Sargassum distribution and the role of the eddy field[J]. Limnology and Oceanography: Fluids and Environments, 2012, 2(1): 12−27. doi: 10.1215/21573689-1573372 [48] Rodgers J L, Nicewander W A. Thirteen ways to look at the correlation coefficient[J]. The American Statistician, 1988, 42(1): 59−66. [49] Shin H R, Shin C W, Kim C, et al. Movement and structural variation of warm eddy WE92 for three years in the western East/Japan Sea[J]. Deep-Sea Research Part II: Topical Studies in Oceanography, 2005, 52(11/13): 1742−1762. -

 下载:
下载:
计量
- 文章访问数: 711
- HTML全文浏览量: 337
- PDF下载量: 104
- 被引次数: 0
