

Geometric positioning method of HY-1C/D satellite Chinese ocean color and temperature scanner
-
摘要: 海洋一号C/D(HY-1C/D)卫星中国海洋水色水温扫描仪(Chinese Ocean Color and Temperature Scanner,COCTS)主要用于探测海洋水色、水温等要素,这些要素需要经过卫星资料处理才能获取,而几何定位是预处理的核心,直接影响这些要素的质量。COCTS具有114°视场角和四元逐点摆扫的特征,据此研究出一套完整的几何定位方法。从0级数据中提取卫星星历,利用插值法从中获取采样时间对应的卫星位置和速度,进而得到轨道(ORB)坐标系到地心旋转(ECR)坐标系的转换矩阵。基于四元逐点摆扫的特征,中心视矢量分别绕X轴、Y轴旋转相应角度,获得扫描行各采样点ORB视矢量,建立视矢量与地球交叉点关系模型,从而对根据波段数据绘制的遥感图像进行地理定位。本文使用插值法替代了传统需要6个轨道根数来计算卫星位置的复杂方法,同时直接计算ORB到ECR的转换矩阵,而不采用传统的两步转换方法。经过多组数据计算及定性定量验证,HY-1C/D COCTS几何定位结果一致;采样像元尺度效应导致从星下点到两侧边缘、从赤道到两极,误差逐渐增大,约在两个像元内。该方法满足一定的定位精度要求,可以用于COCTS的几何定位。
-
关键词:
- HY-1C/D卫星 /
- 中国海洋水色水温扫描仪 /
- 几何定位 /
- 逐点摆扫
Abstract: Chinese Ocean Color Temperature Scanner (COCTS) of Haiyang 1C/D (HY-1C/D) satellite is mainly used to detect ocean water color, water temperature and other elements. These elements can only be achieved by processing satellite data, and geometric positioning is the core of preprocessing, which directly affects quality of these elements. COCTS has the characteristics of 114° field of view and quaternary whisk broom point by point. A set of complete geometric positioning method has been developed based on COCTS characteristics. The satellite position and velocity corresponding to the sampling time are obtained by using the interpolation method in the satellite ephemeris extracted from 0 level data, and then the transformation matrix from orbital coordinate system (ORB) to earth-centered rotating coordinate system (ECR) will be achieved. Based on the quaternary whisk broom point by point, the ORB viewing vector of every sampling point in a sweep can be calculated by rotating center viewing vector around X and Y axis in corresponding angles. The relationship model of viewing vector and the earth intersection point can be established to carry out geolocation of remote sensing images obtained from band data. This article uses interpolation to replace the traditional complex method that requires 6 orbital elements to calculate the satellite position, and directly calculates ORB to ECR transformation matrix rather than the traditional two-step transformation method. After multiple sets of data calculation and qualitative and quantitative verification, the HY-1C/D COCTS geometric positioning results are consistent. As a result of the sampling pixel scale effect, the error increases gradually from Nadir to the edge of two sides and from the equator to two poles, all within the error of 2 pixels. This method meets certain positioning accuracy requirements and can be employed for geometric positioning of COCTS.-
Key words:
- HY-1C/D satellite /
- COCTS /
- geometric positioning /
- whisk broom point by point
-
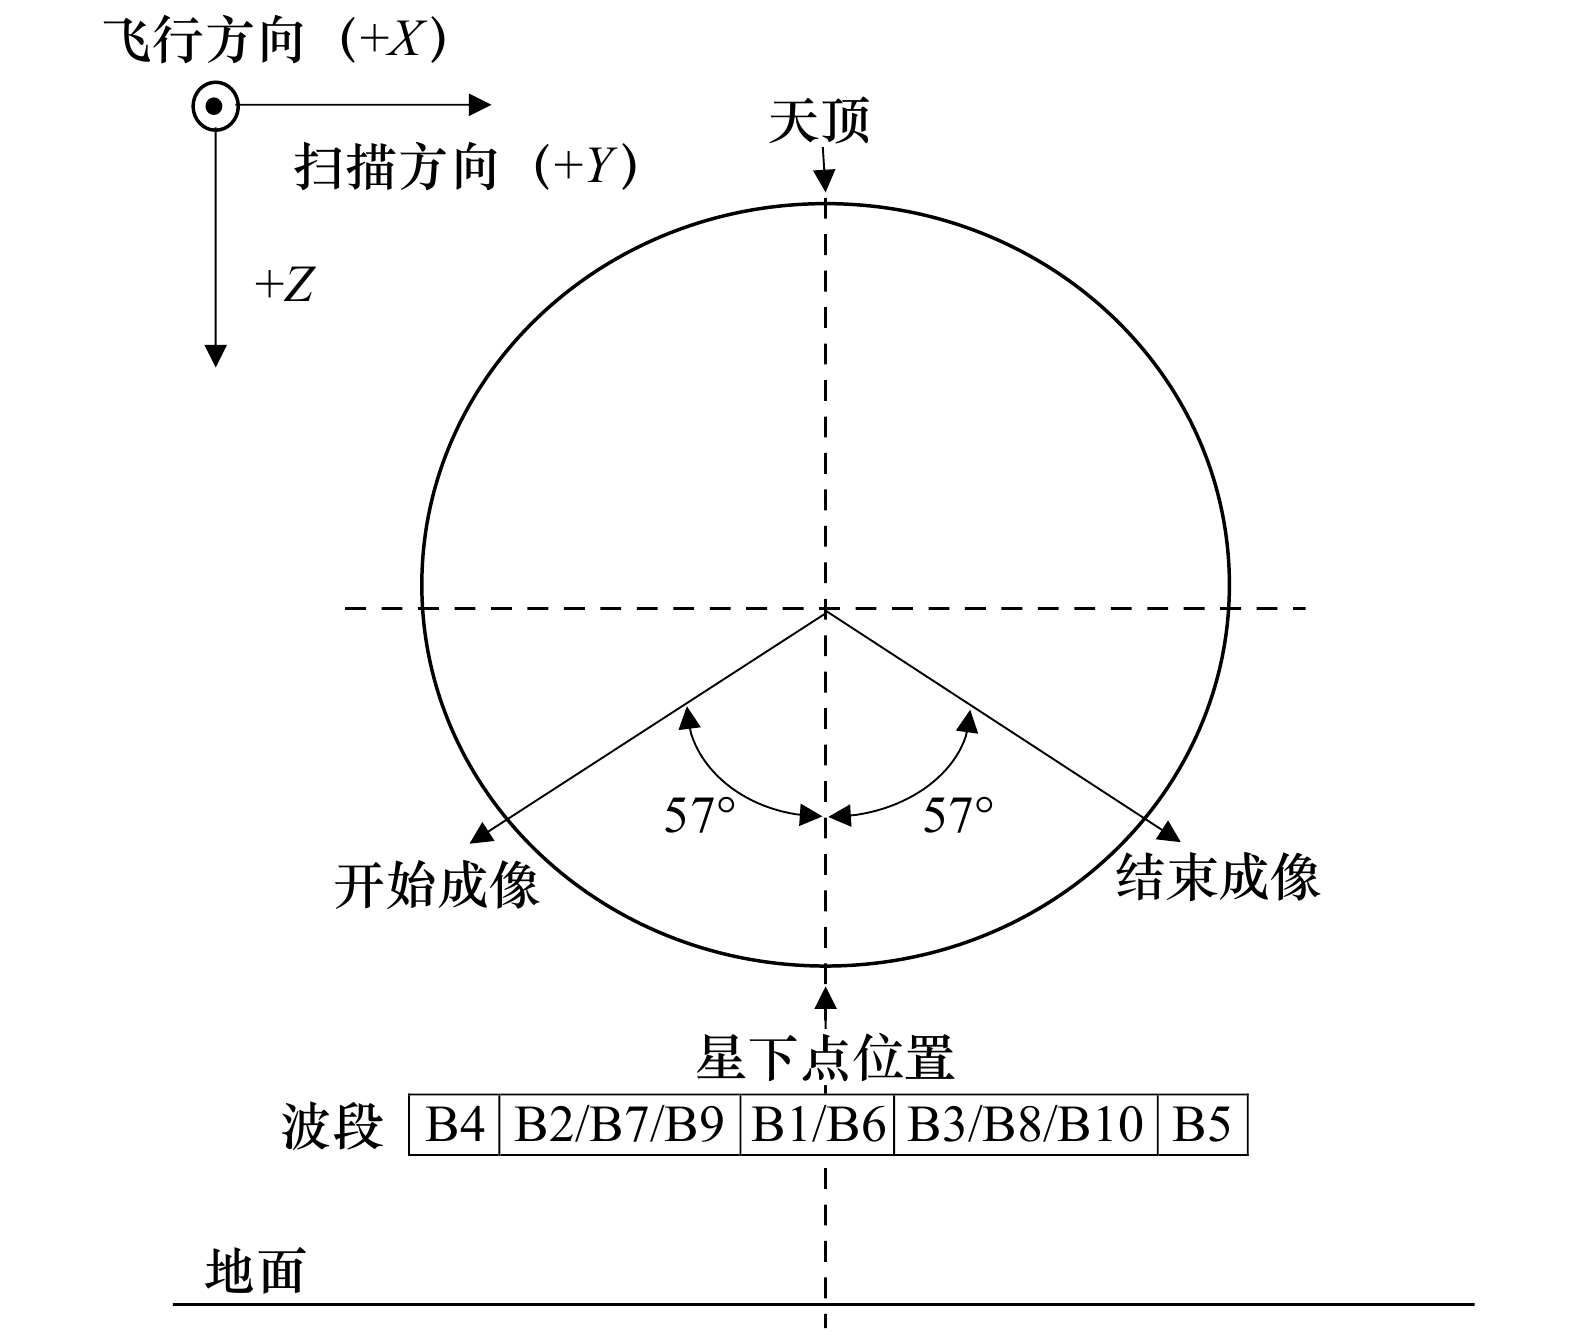
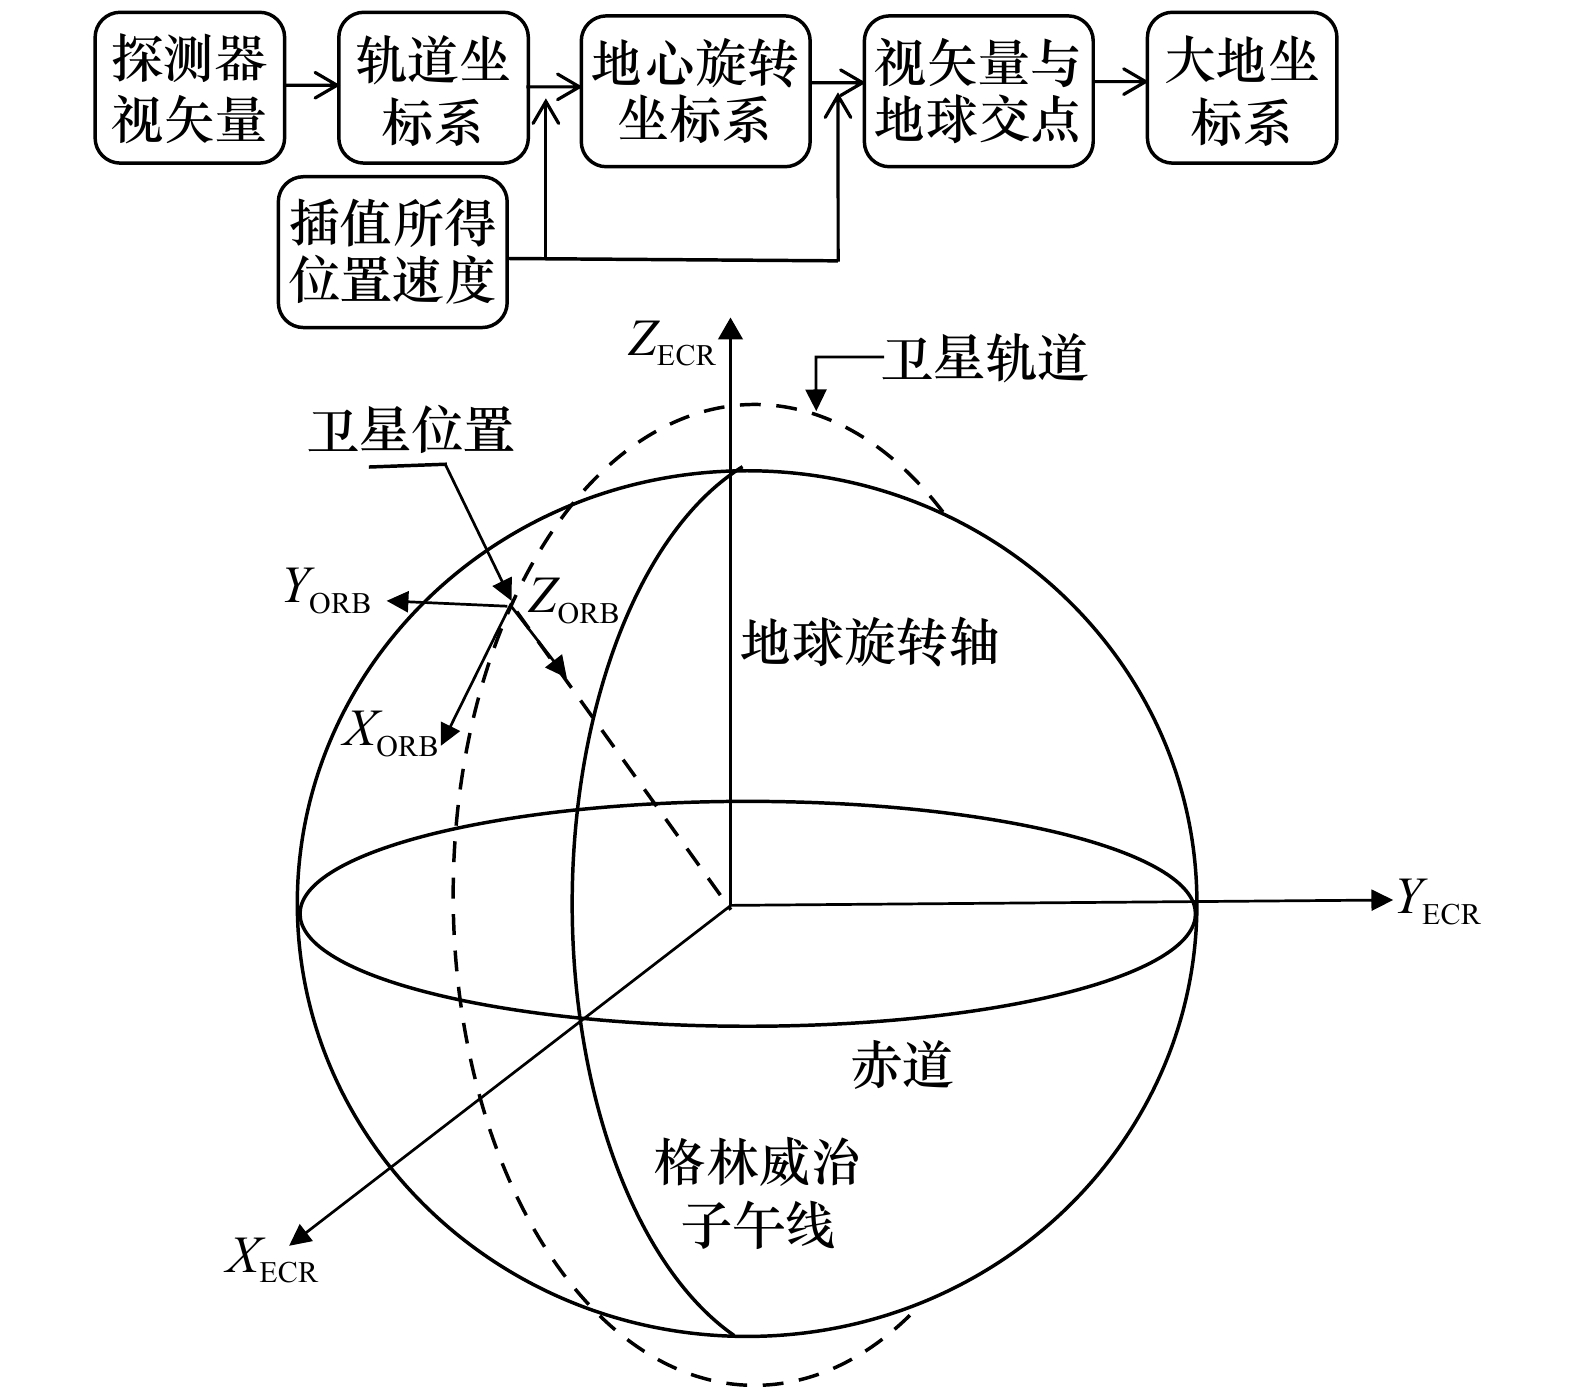
图 1 水色仪COCTS周期扫描成像几何关系示意
Fig. 1 Diagram of the geometric relation of COCTS periodic scanning imaging
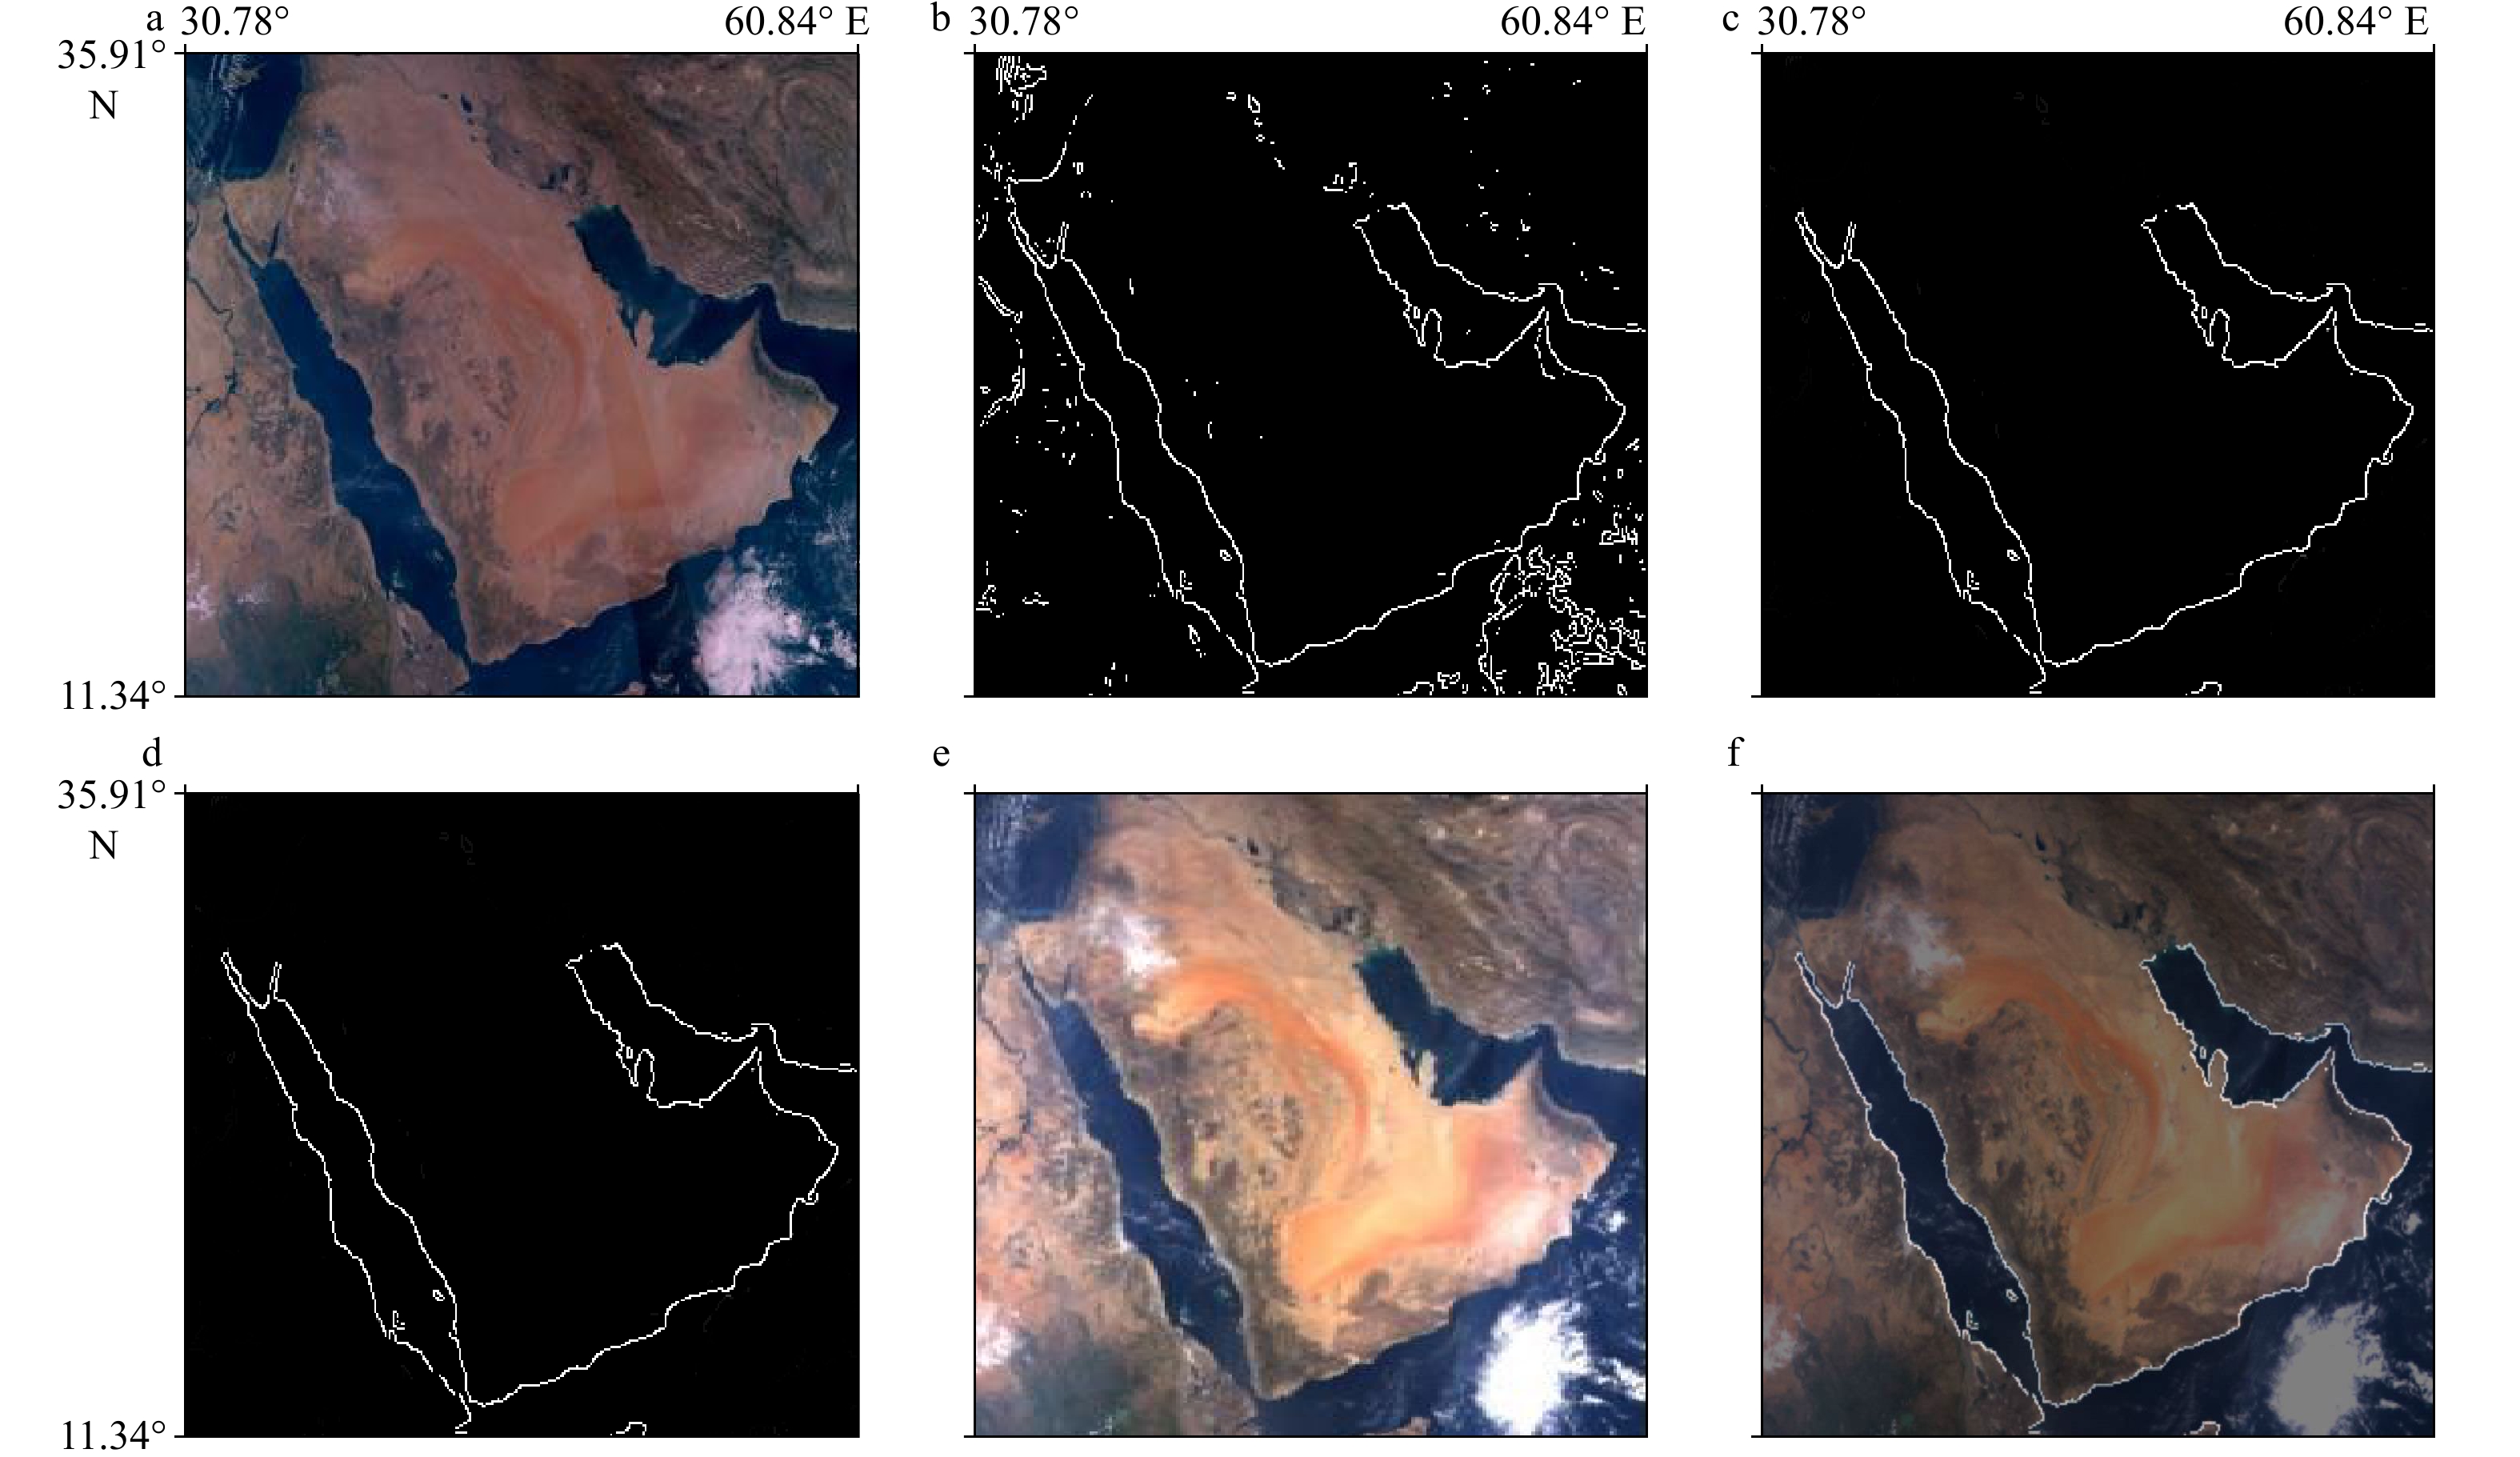
图 7 阿拉伯半岛海岸线提取与匹配
a. MODIS遥感图;b. Canny边缘检测;c, d. 人工优化;e. COCTS遥感图;f. 海岸线匹配
Fig. 7 Extraction and match of coastline in the Arabian Peninsula
a. MODIS remote sensing image; b. Canny edge detection; c, d. artificial optimization; e. COCTS remote sensing image; f. coastline match
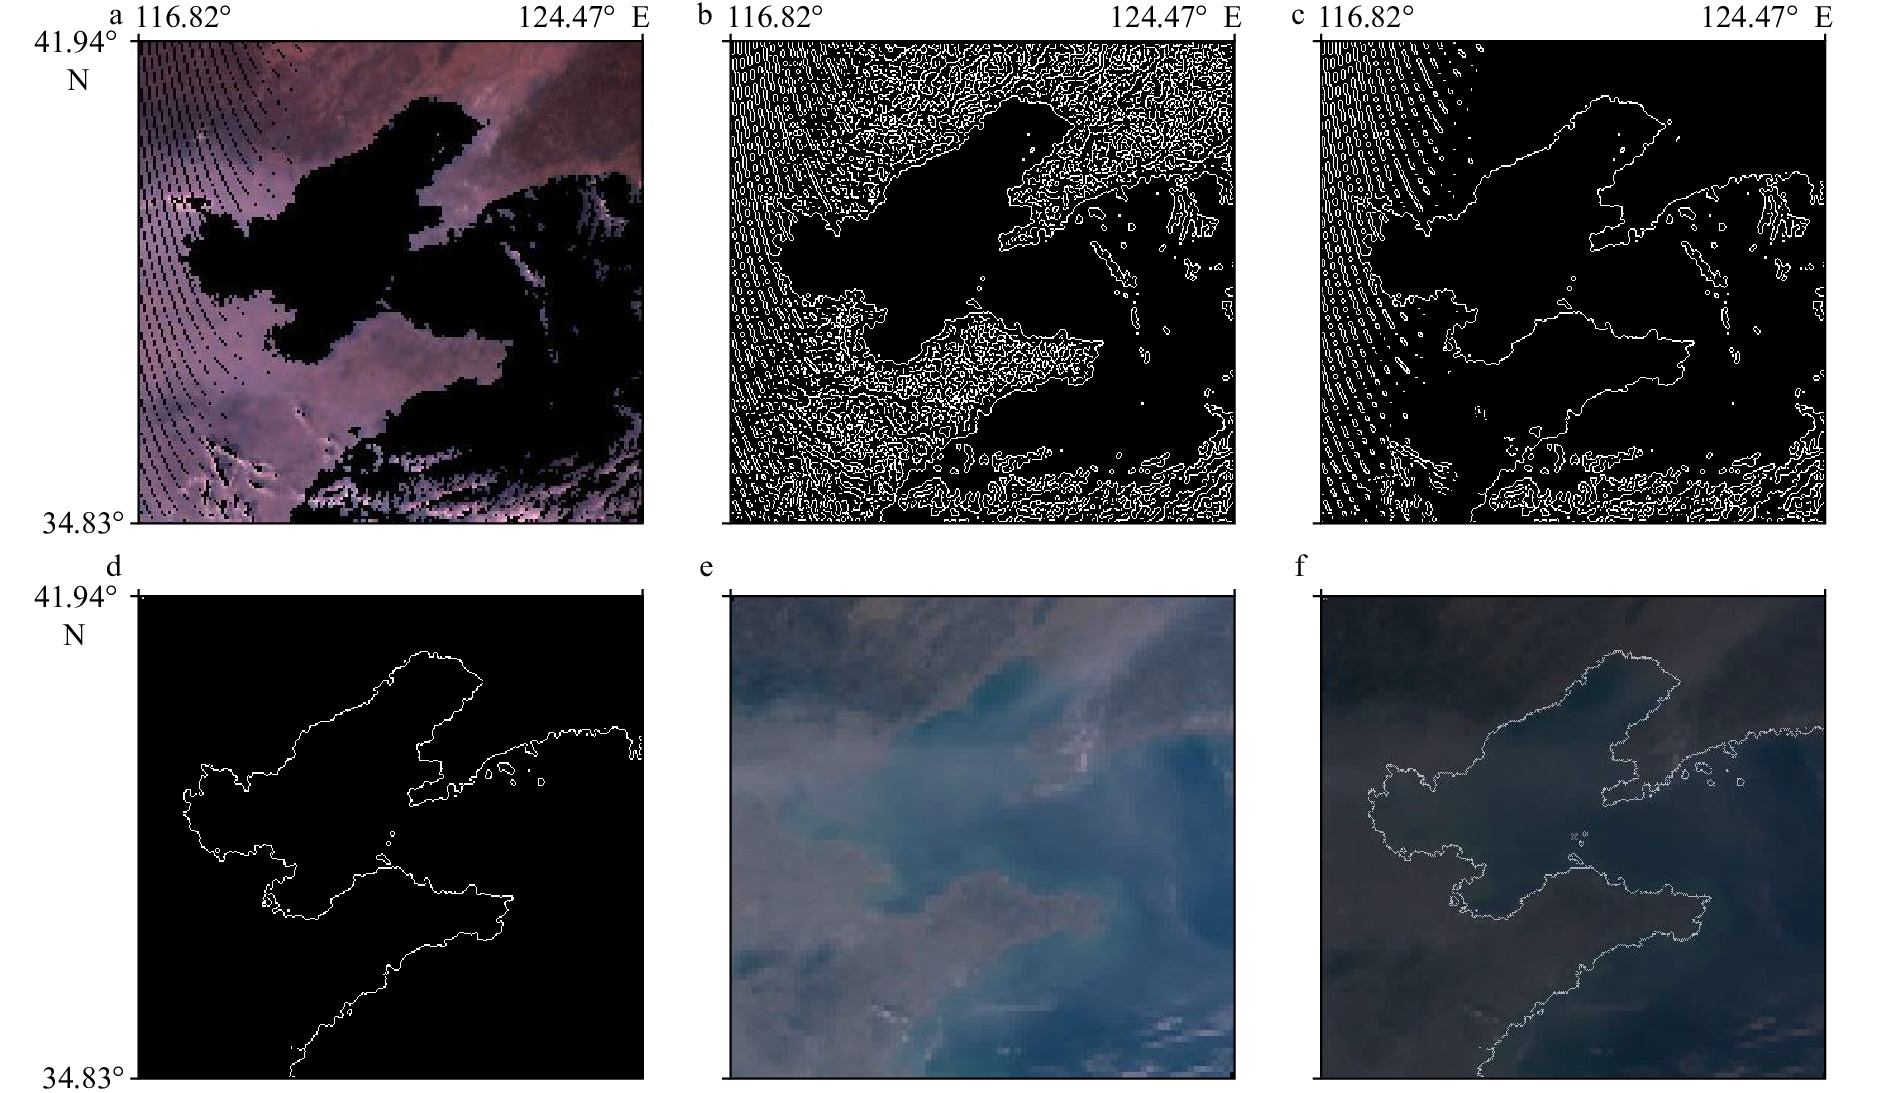
图 8 渤海湾海岸线提取与匹配
a. NDVI处理;b. Canny边缘检测;c. 参数调整;d. 人工优化;e. MODIS遥感图;f. 海岸线匹配
Fig. 8 Extraction and match of coastline in the Bohai Gulf
a. NDVI processing; b. Canny edge detection; c. parameter adjustment; d. artificial optimization; e. MODIS remote sensing image; f. coastline match

图 9 阿拉伯半岛遥感图参考海岸线叠加(a),星下点附近中间放大区域(b),星下点两侧边缘放大区域(c)
Fig. 9 Reference coastline overlaying Arabian remote sensing image (a), middle enlargement area near Nadir (b), marginal enlargement area away from Nadir (c)
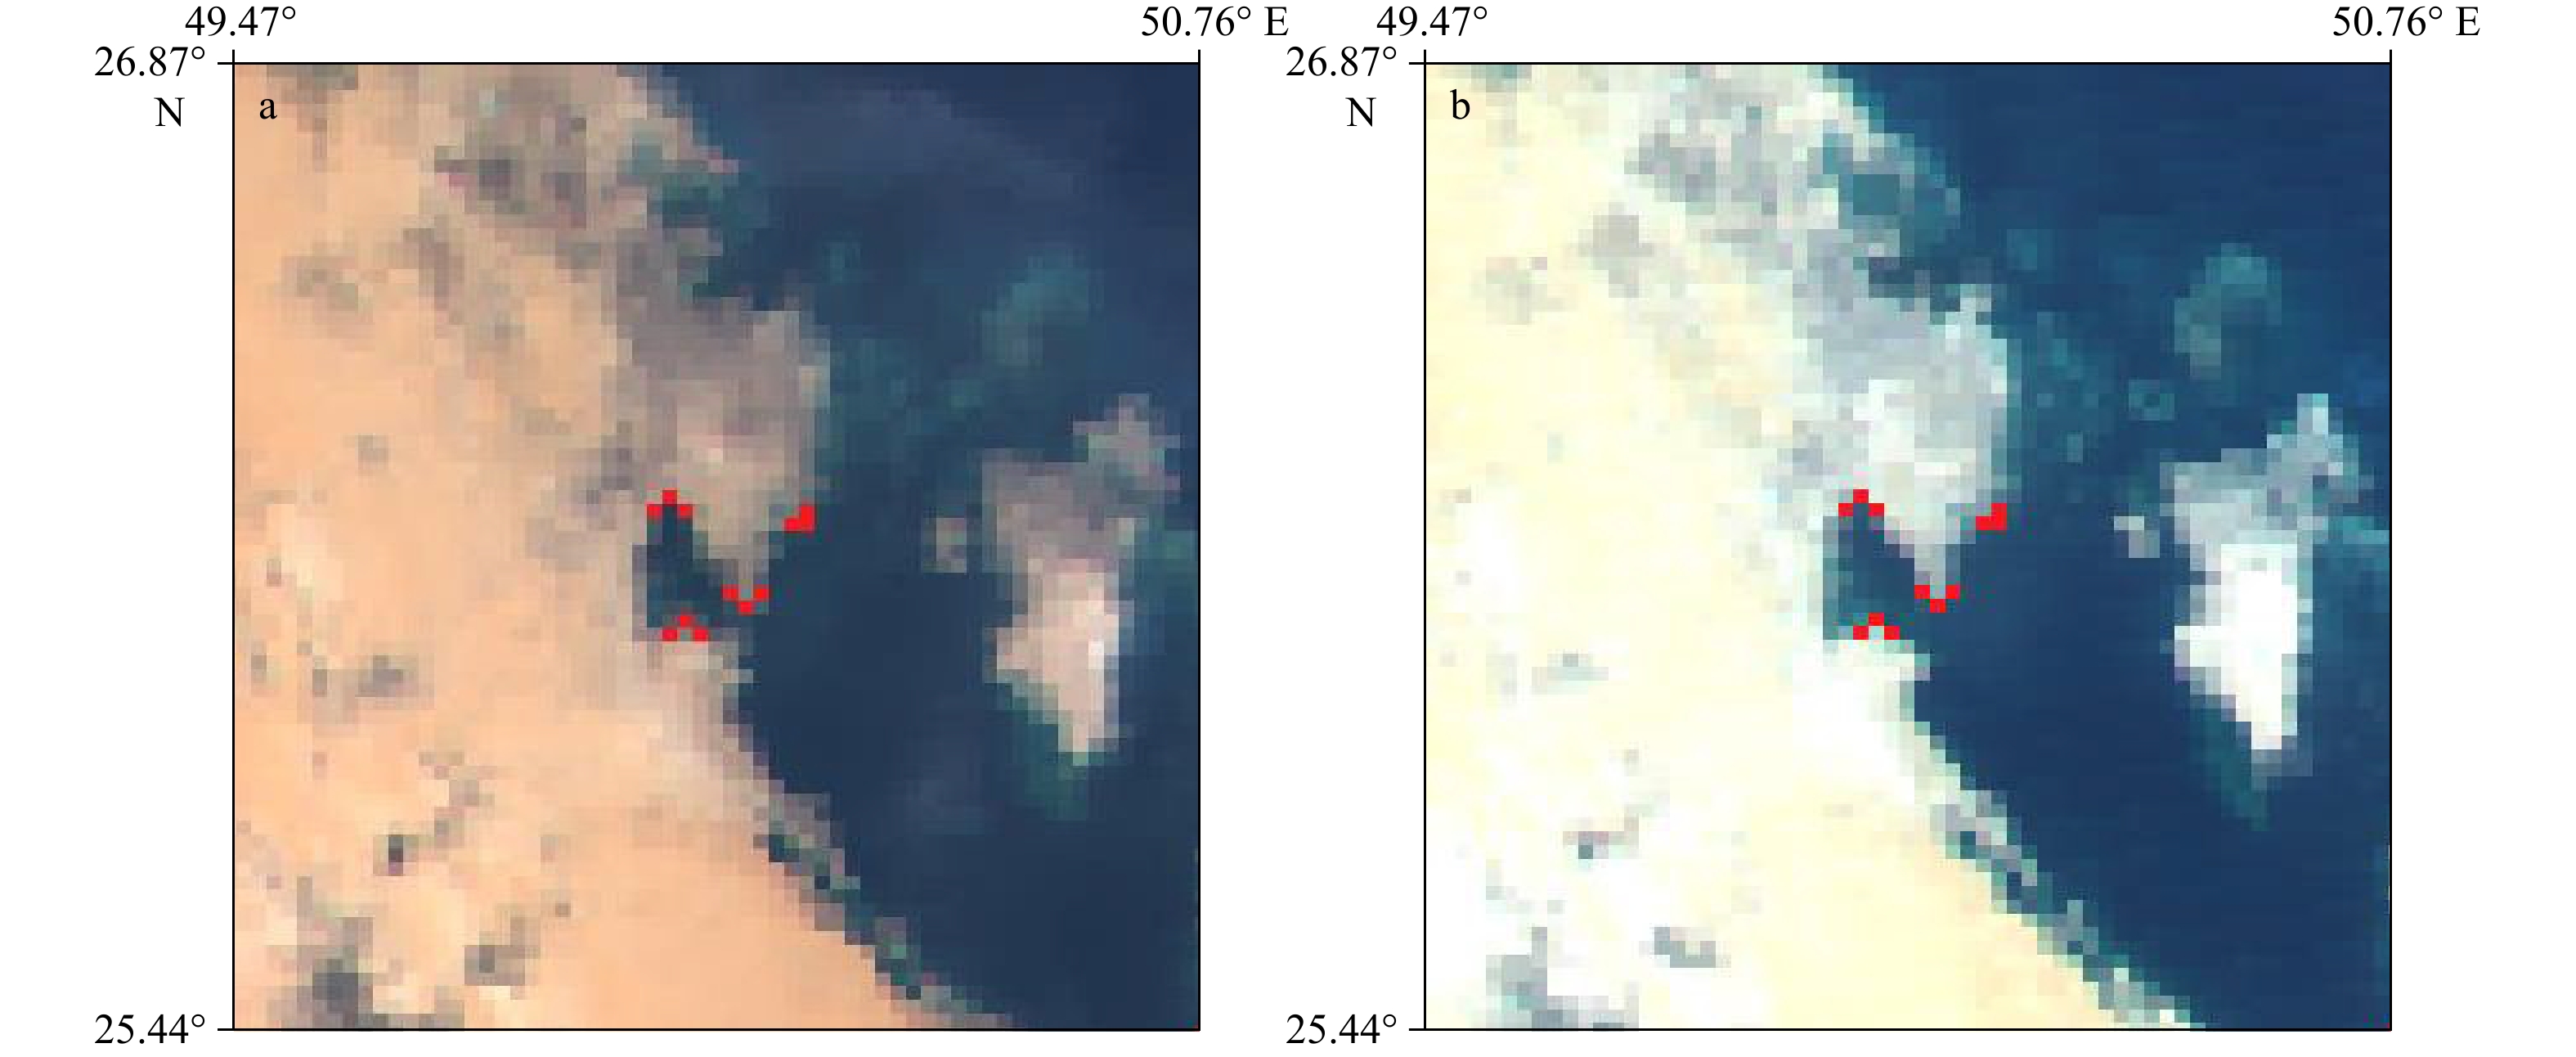
图 10 HY-1C卫星(a)与HY-1D卫星(b)对应特征点采样
Fig. 10 Corresponding feature points sampled from HY-1C satellite (a) and HY-1D satellite (b)

图 11 7对样本列距离变化趋势
Fig. 11 Distance change trends of seven pairs of adjacent sample arrays
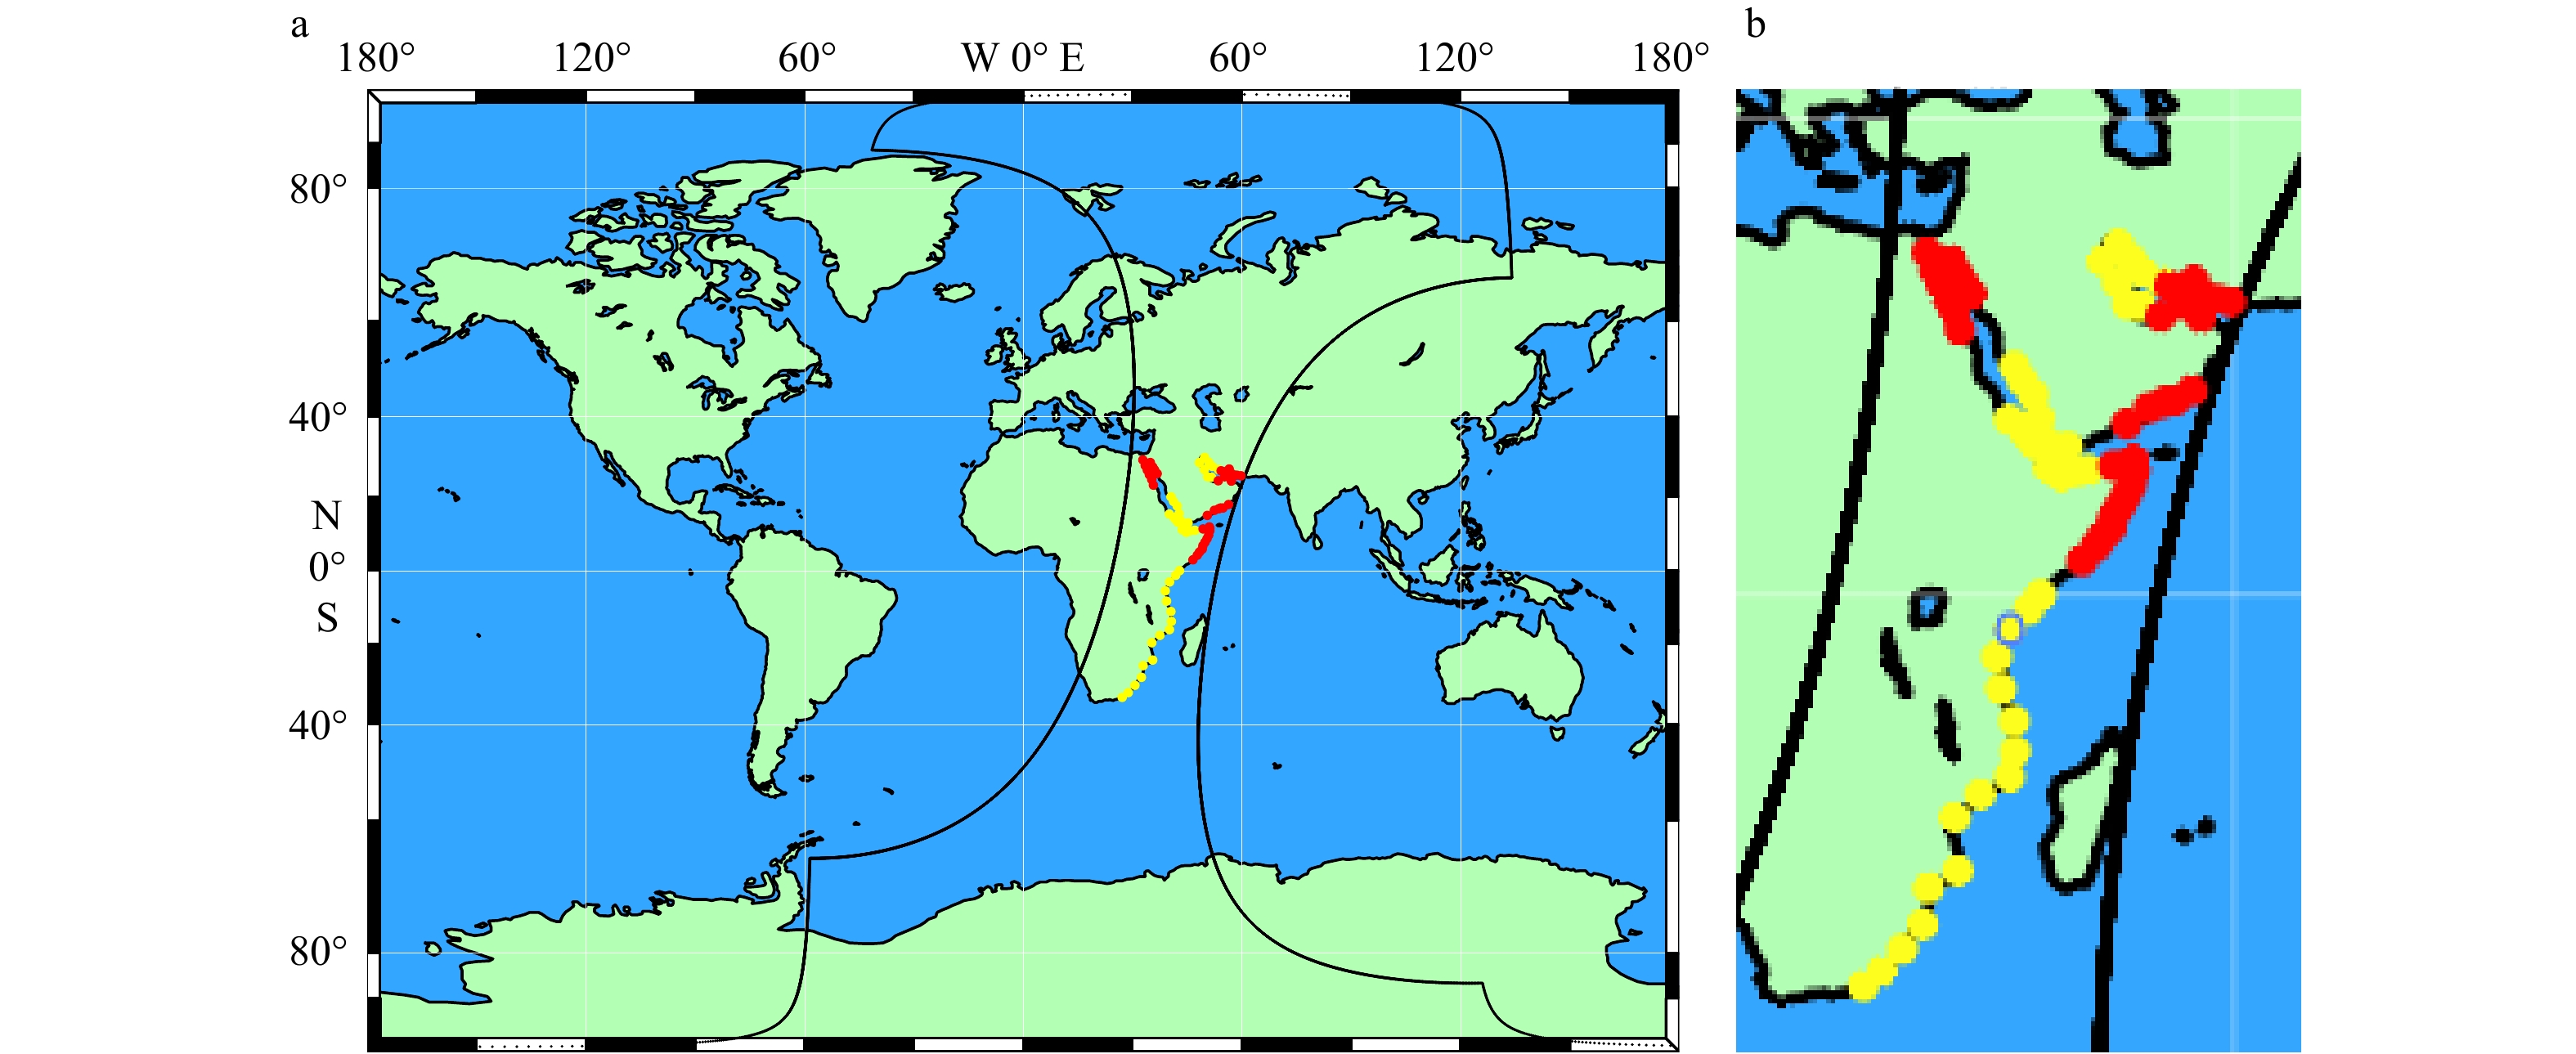
图 12 中间及两侧边缘特征点采样(a)及放大(b)
Fig. 12 Feature points sampled in the middle and marginal sides (a) and enlargement (b)

图 13 赤道及两侧特征点采样(a)及放大(b)
Fig. 13 Feature points sampled near the equator and its both sides (a) and enlargement (b)
表 1 COCTS地球区图像数据传输格式
Tab. 1 COCTS earth area image data transmission format
第1元第1
采样点… 第4元第1
采样点… 第1元第1 664
采样点… 第4元第1 664
采样点B1…B10 … B1…B10 … B1…B10 … B1…B10  下载: 导出CSV
表 2 计算值与参考值误差统计
Tab. 2 Error statistics between calculated and reference values
占比误差 范围 0°~30°(S/N) 30°~60°(S/N) 60°~90°(S/N) (−∞,0.001°) 4.17% 2.10% 0% [0.001°,0.01°) 42.57% 34.37% 28.62% [0.01°,0.02°) 53.26% 63.53% 71.38%
下载: 导出CSV
表 3 HY-1C/D卫星特征区域采样点比较
Tab. 3 Sampling points comparison of HY-1C/D satellite feature areas
HY-1C卫星 HY-1D卫星 偏差/像元 行号 列号 行号 列号 纬度方向 经度方向 6 389 23 013 6 389 23 013 0 0 6 390 23 014 6 390 23 014 0 0 6 389 23 015 6 389 23 015 0 0 6 384 23 017 6 384 23 017 0 0 6 384 23 018 6 384 23 018 0 0 6 383 23 018 6 383 23 018 0 0 6 392 23 009 6 392 23 009 0 0 6 391 23 010 6 391 23 010 0 0 6 392 23 011 6 392 23 011 0 0 6 383 23 008 6 383 23 008 0 0 6 382 23 009 6 382 23 009 0 0 6 383 23 010 6 383 23 010 0 0 平均偏差/像元 0 0
下载: 导出CSV
表 4 相邻样本列距离(单位:(°))
Tab. 4 Distance of adjacent sample arrays (unit: (°))
区域 样本对 1/2 208/209 416/417 832/833 1247/1248 1454/1455 1663/1664 前1/3区域 0.180 6 0.1095 0.0355 0.0182 0.0206 0.0305 0.0848 中间1/3区域 0.0683 0.0206 0.0124 0.0089 0.0124 0.0205 0.0686 后1/3区域 0.0911 0.0317 0.0213 0.0190 0.0380 0.1319 0.1856 半轨区域 0.1233 0.0669 0.0250 0.0160 0.0259 0.0790 0.1243
下载: 导出CSV
表 5 靠近边缘两侧区域特征点误差
Tab. 5 Errors of feature points on both edge-nearing sides of the track
序号 行号 列号 纬度方向像元误差 经度方向像元误差 序号 行号 列号 纬度方向像元误差 经度方向像元误差 1 6 393 21 569 1 2 21 7 360 23 244 2 2 2 6 548 21 524 1 2 22 7 496 23 049 1 1 3 6 424 21 460 0 1 23 7 861 22 933 2 0 4 6 308 21 404 0 1 24 7 805 23 105 0 1 5 6 189 21 345 2 2 25 7 909 23 117 1 2 6 6 049 21 281 2 1 26 8 028 23 088 2 1 7 6 177 21 449 0 1 27 8 128 23 041 1 1 8 6 116 21 488 1 2 28 8 224 22 985 0 1 9 6 229 21 413 1 2 29 8 316 22 929 1 2 10 6 397 21 673 0 1 30 8 412 22 909 0 3 11 6 325 23 428 1 1 31 8 492 22 833 2 0 12 6 280 23 649 2 0 32 8 704 22 656 1 1 13 6 409 23 736 0 2 33 8 577 22 773 2 2 14 6 453 23 973 1 0 34 7 844 23 120 0 1 15 6 581 23 352 2 1 35 6 304 21 604 0 1 16 6 477 23 529 0 2 36 6 229 21 553 1 1 17 6 425 23 633 0 2 37 6 345 23 488 1 0 18 6 589 23 709 2 1 38 6 437 23 857 1 0 19 7 205 23 632 1 0 39 7 297 23 480 1 2 20 7 297 23 413 1 3 40 7 317 23 365 1 1 平均误差/像元 0.95 1.25
下载: 导出CSV
表 6 中间区域特征点误差
Tab. 6 Errors of feature points in the middle area of the track
序号 行号 列号 纬度方向像元误差 经度方向像元误差 序号 行号 列号 纬度方向像元误差 经度方向像元误差 1 6293 23353 1 2 21 7648 22328 0 1 2 6212 23184 0 0 22 7721 22360 1 1 3 6109 23088 0 0 23 7732 22433 1 0 4 5985 22976 0 0 24 7696 22521 0 0 5 6117 22832 1 1 25 7897 22708 0 1 6 6292 22965 0 0 26 7909 22596 0 0 7 6477 23057 0 1 27 7953 22473 1 1 8 6489 23164 0 2 28 7881 22360 0 1 9 7676 22240 0 0 29 11408 21552 0 1 10 7601 22180 0 1 30 11552 21289 1 0 11 7553 22137 2 0 31 11849 21241 0 1 12 7460 22008 0 0 32 12049 21064 0 1 13 7000 22052 1 1 33 12232 20881 0 1 14 7124 22121 0 0 34 12351 20713 1 0 15 7244 22221 0 1 35 10757 21749 0 2 16 7445 22276 0 1 36 10385 22064 0 0 17 9001 22288 0 1 37 10117 22052 0 1 18 9129 22181 0 0 38 9836 21932 0 0 19 10605 22012 1 1 39 9312 22013 1 0 20 10953 21528 0 2 40 9553 21896 0 1 平均误差/像元 0.30 0.65
下载: 导出CSV
表 7 赤道附近特征点误差
Tab. 7 Errors of feature points near the equator
序号 行号 列号 纬度方向像元误差 经度方向像元误差 序号 行号 列号 纬度方向像元误差 经度方向像元误差 1 8832 22472 1 1 11 8968 22317 0 0 2 8844 22453 0 2 12 8984 22304 0 0 3 8856 22440 0 0 13 8996 22293 0 1 4 8872 22421 0 0 14 9008 22281 0 0 5 8892 22397 1 0 15 9017 22272 0 0 6 8904 22384 0 1 16 9032 22257 0 0 7 8917 22365 0 0 17 9048 22241 1 1 8 8929 22353 0 0 18 9065 22228 1 0 9 8944 22340 0 0 19 9080 22217 0 1 10 8957 22325 0 1 20 9093 22204 0 0 平均误差/像元 0.20 0.40
下载: 导出CSV
表 8 35°N附近特征点误差
Tab. 8 Errors of feature points near 35°N
序号 行号 列号 纬度方向像元误差 经度方向像元误差 序号 行号 列号 纬度方向像元误差 经度方向像元误差 1 5317 23312 0 0 11 5288 23036 0 0 2 5324 23292 0 1 12 5240 22917 1 1 3 5328 23272 0 1 13 5229 22904 1 0 4 5333 23252 2 1 14 5216 22897 0 2 5 5341 23200 1 0 15 5196 22892 0 0 6 5340 23176 0 0 16 5181 22889 1 0 7 5333 23152 1 2 17 5160 22888 0 3 8 5320 23093 1 1 18 5145 22888 2 1 9 5312 23077 1 0 19 5121 22885 0 0 10 5297 23049 0 1 20 5105 22893 0 1 平均误差/像元 0.55 0.80
下载: 导出CSV
表 9 35°S附近特征点误差
Tab. 9 Errors of feature points near 35°S
序号 行号 列号 纬度方向像元误差 经度方向像元误差 序号 行号 列号 纬度方向像元误差 经度方向像元误差 1 12397 20529 0 2 11 12356 20697 1 1 2 12404 20552 1 0 12 12344 20724 0 3 3 12401 20572 1 2 13 12333 20741 0 0 4 12389 20564 0 0 14 12317 20765 1 0 5 12381 20568 0 1 15 12300 20793 0 1 6 12369 20585 0 0 16 12268 20840 1 1 7 12369 20604 0 0 17 12252 20860 0 0 8 12373 20629 1 0 18 12236 20877 0 1 9 12373 20656 0 1 19 12221 20896 0 0 10 12364 20676 2 0 20 12197 20916 2 1 平均误差/像元 0.50 0.70
下载: 导出CSV
-
[1] 曾丽萍, 王振松. 一种新的MODIS 0级数据地理定位方法[J]. 现代电子技术, 2008, 31(2): 173−174. doi: 10.3969/j.issn.1004-373X.2008.02.057Zeng Liping, Wang Zhensong. A new MODIS 0 level earth location algorithm[J]. Modern Electronics Technique, 2008, 31(2): 173−174. doi: 10.3969/j.issn.1004-373X.2008.02.057 [2] Nishihama M, Wolfe R, Solomon D, et al. MODIS level 1A earth location: algorithm theoretical basis document version 3.0[EB/OL]. (1997−08−26) [2021−04−15]. https://modis.gsfc.nasa.gov/data/atbd/atbd_mod28_v3.pdf. [3] 孙从容. 中国海洋一号卫星遥感图像GPS地理定位算法研究与实现[J]. 航天器工程, 2003, 12(3): 144−150.Sun Congrong. Research and implementation of GPS geolocation algorithm for China HY-1 satellite remote sensing image[J]. Spacecraft Engineering, 2003, 12(3): 144−150. [4] 关敏, 杨忠东. FY-3微波成像仪遥感图像地理定位方法研究[J]. 遥感学报, 2009, 13(3): 469−474. doi: 10.11834/jrs.20090310Guan Min, Yang Zhongdong. Geolocation method for FY-3 MWRI’s remote sensing image[J]. Journal of Remote Sensing, 2009, 13(3): 469−474. doi: 10.11834/jrs.20090310 [5] Baker N. Joint Polar Satellite System VIIRS Geolocation Algorithm Theoretical Basis Document[R/OL]. (2011−06−31) [2021−04−15]. https://lpdaac.usgs.gov/documents/135/VNP03_ATBD.pdf [6] 潘德炉, 毛天明, 李淑菁. 海洋卫星资料的地理定位及相关几何参数算法研究[J]. 海洋学报, 1997, 19(5): 56−68.Pan Delu, Mao Tianming, Li Shujing. Research on geolocation of marine satellite data and related geometric parameter algorithms[J]. Haiyang Xuebao, 1997, 19(5): 56−68. [7] 柴毅. 基于多敏感器的卫星在轨高精度姿态确定技术研究[D]. 哈尔滨: 哈尔滨工程大学, 2018.Chai Yi. Research on high accuracy attitude determination methods for on-orbit satellite based on multiple sensors[D]. Harbin: Harbin Engineering University, 2018. [8] 边少锋, 纪兵, 李厚朴. 卫星导航系统概论[M]. 2版. 北京: 测绘出版社, 2016.Bian Shaofeng, Ji Bing, Li Houpu. Introduction to Satellite Navigation Systems[M]. 2nd ed. Beijing: Surveging and Mapping Press, 2016. [9] 关敏, 谷松岩, 杨忠东. 风云三号微波湿度计遥感图像地理定位方法[J]. 遥感技术与应用, 2008, 23(6): 712−716. doi: 10.11873/j.issn.1004-0323.2008.6.712Guan Min, Gu Songyan, Yang Zhongdong. Geolocation method for FY-3 MWHS’ remote sensing image[J]. Remote Sensing Technology and Application, 2008, 23(6): 712−716. doi: 10.11873/j.issn.1004-0323.2008.6.712 [10] 窦长勇, 岳昔娟. 轨道坐标系到地心固定坐标系的直接转换方法[J]. 航天返回与遥感, 2016, 37(5): 86−94. doi: 10.3969/j.issn.1009-8518.2016.05.010Dou Changyong, Yue Xijuan. Direct transformation from orbital to earth-centered earth-fixed reference frame[J]. Spacecraft Recovery & Remote Sensing, 2016, 37(5): 86−94. doi: 10.3969/j.issn.1009-8518.2016.05.010 [11] Noredlinger P D, Klein L. Theoretical basis of the SDP toolkit geolocation package for the ECS project. Landover: Hughes Applied Information Systems[R/OL]. (1995−05−18) [2021−04−15]. https://citeseerx.ist.psu.edu/viewdoc/download?doi=10.1.1.131.7265&rep=rep1&type=pdf. [12] 杨磊, 杨忠东, 张里阳, 等. 极轨气象卫星有效载荷航空校飞数据地理定位[J]. 计算机工程与应用, 2008, 44(30): 202−205. doi: 10.3778/j.issn.1002-8331.2008.30.062Yang Lei, Yang Zhongdong, Zhang Liyang, et al. Geolocation of airborne data for polar meteorological satellite payloads[J]. Computer Engineering and Applications, 2008, 44(30): 202−205. doi: 10.3778/j.issn.1002-8331.2008.30.062 [13] 熊显名, 尧雪娟, 滕惠忠, 等. 基于遥感图像光谱特征的水陆分界线提取[C]//2007’仪表, 自动化及先进集成技术大会论文集. 重庆: 《仪器仪表学报》杂志社, 2007.Xiong Xianming, Yao Xuejuan, Teng Huizhong, et al. Shoreline extract based on spectral signatures of remote sensing images[C]//2007’ Instrumentation, Automation and Advanced Integration Technology Conference. Chongqing: Chinese Journal of Scientific Instrument, 2007. [14] Lykhovyd P V. Forecasting oil crops yields on the regional scale using normalized difference vegetation index[J]. Journal of Ecological Engineering, 2021, 22(3): 53−57. doi: 10.12911/22998993/132436 [15] 李继红, 焦裕欣. 东北地区归一化植被指数与环境因子间的尺度依存关系[J]. 东北林业大学学报, 2021, 49(2): 70−77.Li Jihong, Jiao Yuxin. Dependence between NDVI and environmental factors in northeast China[J]. Journal of Northeast Forestry University, 2021, 49(2): 70−77. [16] 黄慧, 董林鹭, 何建华, 等. 强噪声下改进Canny算法的边缘检测[J]. 计算机技术与发展, 2021, 31(1): 83−87. doi: 10.3969/j.issn.1673-629X.2021.01.015Huang Hui, Dong Linlu, He Jianhua, et al. Edge detection of an improved canny algorithm under strong noise[J]. Computer Technology and Development, 2021, 31(1): 83−87. doi: 10.3969/j.issn.1673-629X.2021.01.015 [17] Loderer M, Beitelschmidt M. Improved edge detection based on fractional derivatives for real-time measurement systems[J]. PAMM, 2019, 19(1): e201900439. [18] Howard M, Hock M C, Meehan B T, et al. A locally adapting technique for edge detection using image segmentation[J]. SIAM Journal on Scientific Computing, 2018, 40(4): B1161−B1179. doi: 10.1137/17M1155363 [19] 黄祥李, 张杰, 计科峰, 等. 基于GSHHG数据库与改进CV模型的SAR图像海陆分割算法[C]//第五届高分辨率对地观测学术年会论文集. 西安: 中国科学院高分重大专项管理办公室, 2018.Huang Xiangli, Zhang Jie, Ji Kefeng, et al. Sea-land segmentation algorithm of SAR image based on GSHHG database and improved CV model[C]//The Fifth Annual Conference on High Resolution Earth Observation, Xi’an: High Score Major Project Management Office of Chinese Academy of Sciences, 2018. [20] 王存良. 对地面某区域某时段连续覆盖的卫星轨道计算[J]. 信息与电子工程, 2012, 10(4): 421−425. doi: 10.3969/j.issn.1672-2892.2012.04.008Wang Cunliang. Calculation of the satellite orbit covering certain area on the ground in some period of time[J]. Information and Electronic Engineering, 2012, 10(4): 421−425. doi: 10.3969/j.issn.1672-2892.2012.04.008 [21] 李跃跃, 胡彩波, 孙江艳, 等. 基于STK/Matlab的导航星座性能分析[C]//第九届中国卫星导航学术年会论文集——S08 测试评估技术. 哈尔滨: 中科北斗汇(北京)科技有限公司, 2018.Li Yueyue, Hu Caibo, Sun Jiangyan, et al. Performance analysis of navigation constellation based on STK/Matlab[C]//The Ninth China Satellite Navigation Conference. Harbin: Zhongke Beidouhui (Beijing) Technology Co., Ltd, 2018. -


计量
- 文章访问数: 560
- HTML全文浏览量: 330
- PDF下载量: 37
- 被引次数: 0
