

Spatiotemporal dynamic remote sensing monitoring of typical wetland vegetation in the Current Huanghe River Estuary Reserve
-
摘要: 滩涂植被是滨海湿地的重要组成部分,其动态变化影响着湿地生态系统的结构和功能。利用遥感技术监测和评估湿地植被的长期变化对于海岸带资源管理和生态保护具有重要意义。本文以多时相Landsat卫星影像为数据源,结合面向对象和随机森林算法实现现行黄河口保护区内典型湿地植被的精准分类,揭示了2000−2020年研究区内芦苇、盐地碱蓬和互花米草的时空变化特征。经验证,湿地植被制图的总体精度为84.74%~92.39%,Kappa系数为0.81~0.91。长时序的分类结果表明,芦苇是现行黄河口保护区内的优势物种,分布面积占比维持在6%以上且总体保持平稳增长;盐地碱蓬面积自2006年开始呈减少趋势,优势度不断减小且破碎化程度严重。互花米草由2002年的221.85 hm2增加到2020年的5267.79 hm2,其扩张过程可分为3个阶段:2008年以前为扩张初期,互花米草生长不稳定;2008−2014年为快速扩张阶段,年平均扩展率为54%,空间上表现为向海扩张侵占光滩和向陆扩张侵占碱蓬生境;2014年至今为缓慢增长阶段,进入生长的稳定期,年平均扩展率仅为9%。Abstract: The wetland vegetation is an important part of coastal wetlands, and its dynamic changes affect the structures and functions of wetland ecosystem. Therefore, it is of great significance to monitor and evaluate the long-term changes of wetland vegetation by remote sensing technology for the management of coastal resources and ecological protection. In this paper, we used multi-temporal Landsat satellite images as data sources, combined object-oriented method and random forest algorithm to achieve accurate classification of typical wetland vegetation in the Current Huanghe River Estuary Reserve, and revealed the spatiotemporal variation characteristics of Phragmites australis, Suaeda salsa and Spartina alterniflora in the study area from 2000 to 2020. It has been verified that the overall accuracy of wetland vegetation mapping is between 84.74% and 92.39%, and the Kappa coefficient is between 0.81 and 0.91. The results of long time series classification show that Phragmites australis is the dominant species in the Current Huanghe Estuary Reserve, and its distribution area is maintained at more than 6% and the overall growth is steady. The area of Suaeda salsa shows a decreasing trend since 2006. The dominance degree of Suaeda salsa is decreasing continuously and the degree of fragmentation is severe. The area of Spartina alterniflora increased year by year from 211.85 hm2 in 2002 to 5267.79 hm2 in 2020. The expansion process of Spartina alterniflora in the reserve could be divided into three stages: in the initial expansion period before 2008, the growth of Spartina alterniflora was unstable; from 2008 to 2014, there was a rapid expansion stage, with an average annual expansion rate of 54%, which showed that the seaward expansion invaded the plain and the landward expansion invaded the habitat of Suaeda salsa in space; since 2014, Spartina alterniflora has been growing slowly, entering a stable growth period, and the annual average expansion rate is only 9%.
-

图 2 2000−2020年现行黄河口保护区典型湿地植被分布
Fig. 2 Distribution of typical wetland vegetation in the Current Huanghe River Estuary Reserve from 2000 to 2020
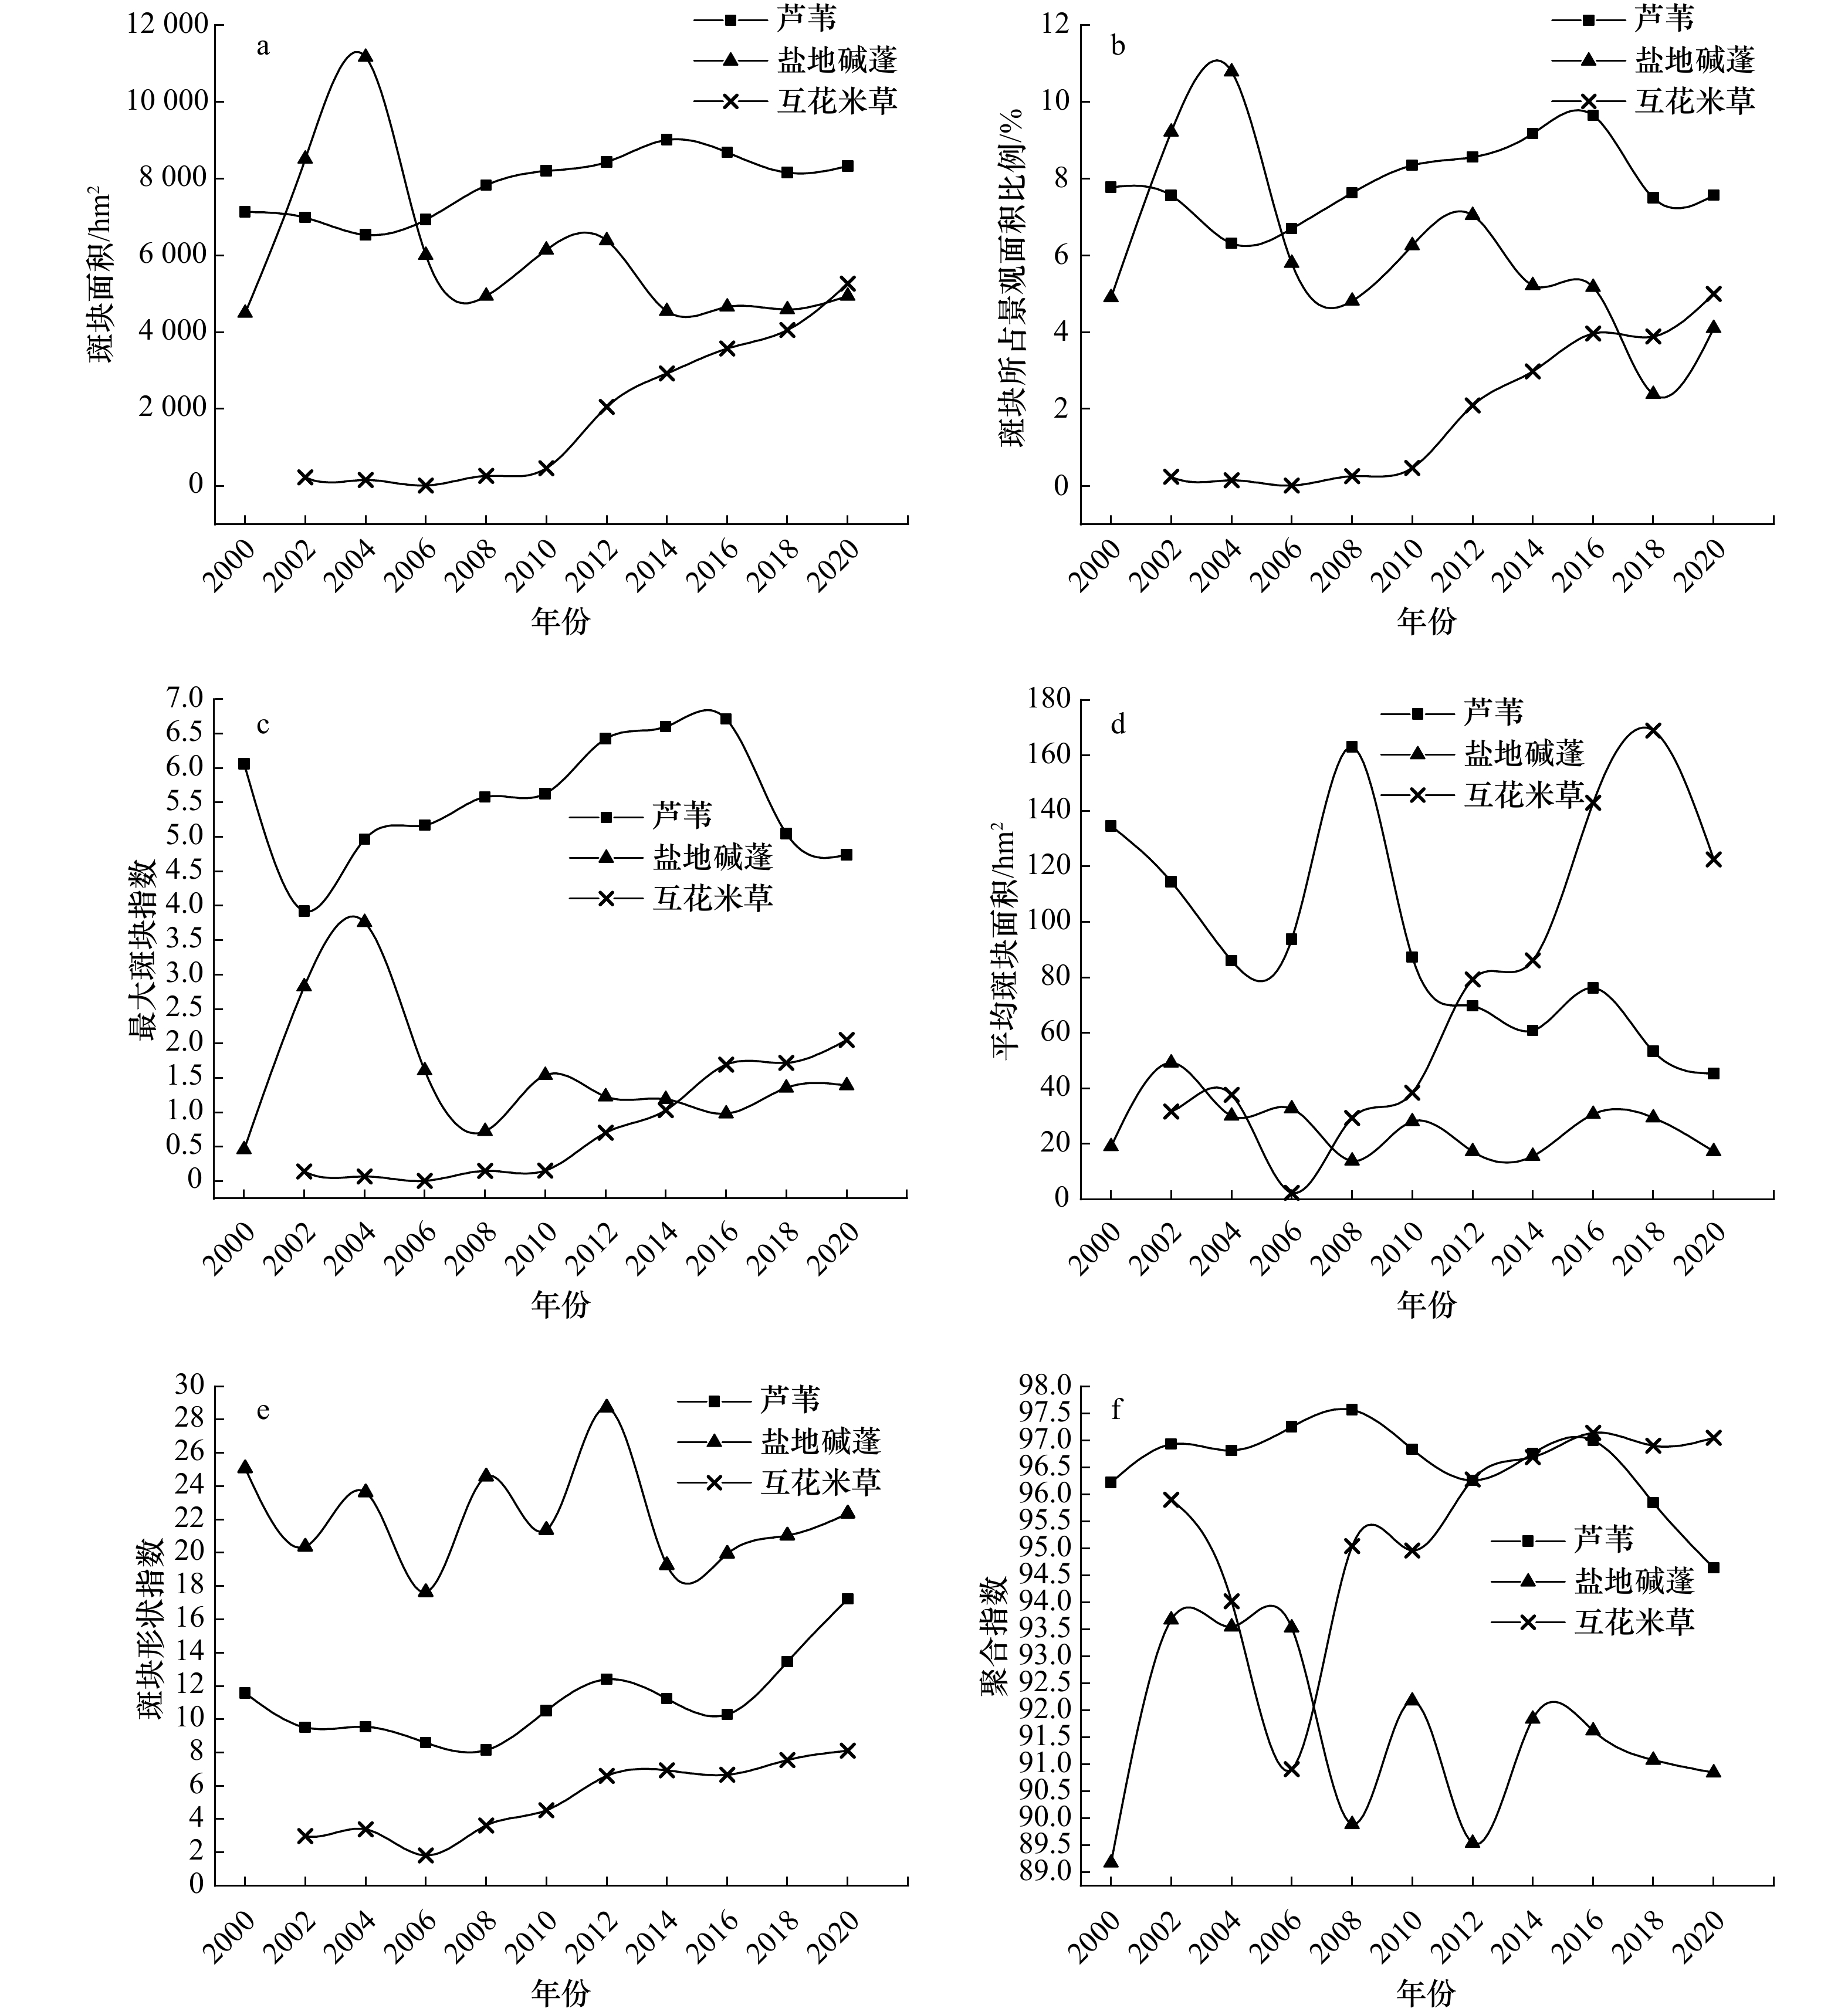
图 3 2000−2020年3种典型湿地植被的景观格局指数变化趋势
Fig. 3 Change trend of landscape pattern index of three typical wetland vegetations from 2000 to 2020

图 4 2002−2020年不同入侵年份互花米草分布格局及DSAS 计算2014−2020年互花米草扩张速率所用基线和断面分布
Fig. 4 Distribution pattern of Spartina alterniflora in different invasive years from 2002 to 2020 and the distributions of baseline and transects used by DSAS to calculate the expansion rate of S. alterniflora from 2014 to 2020
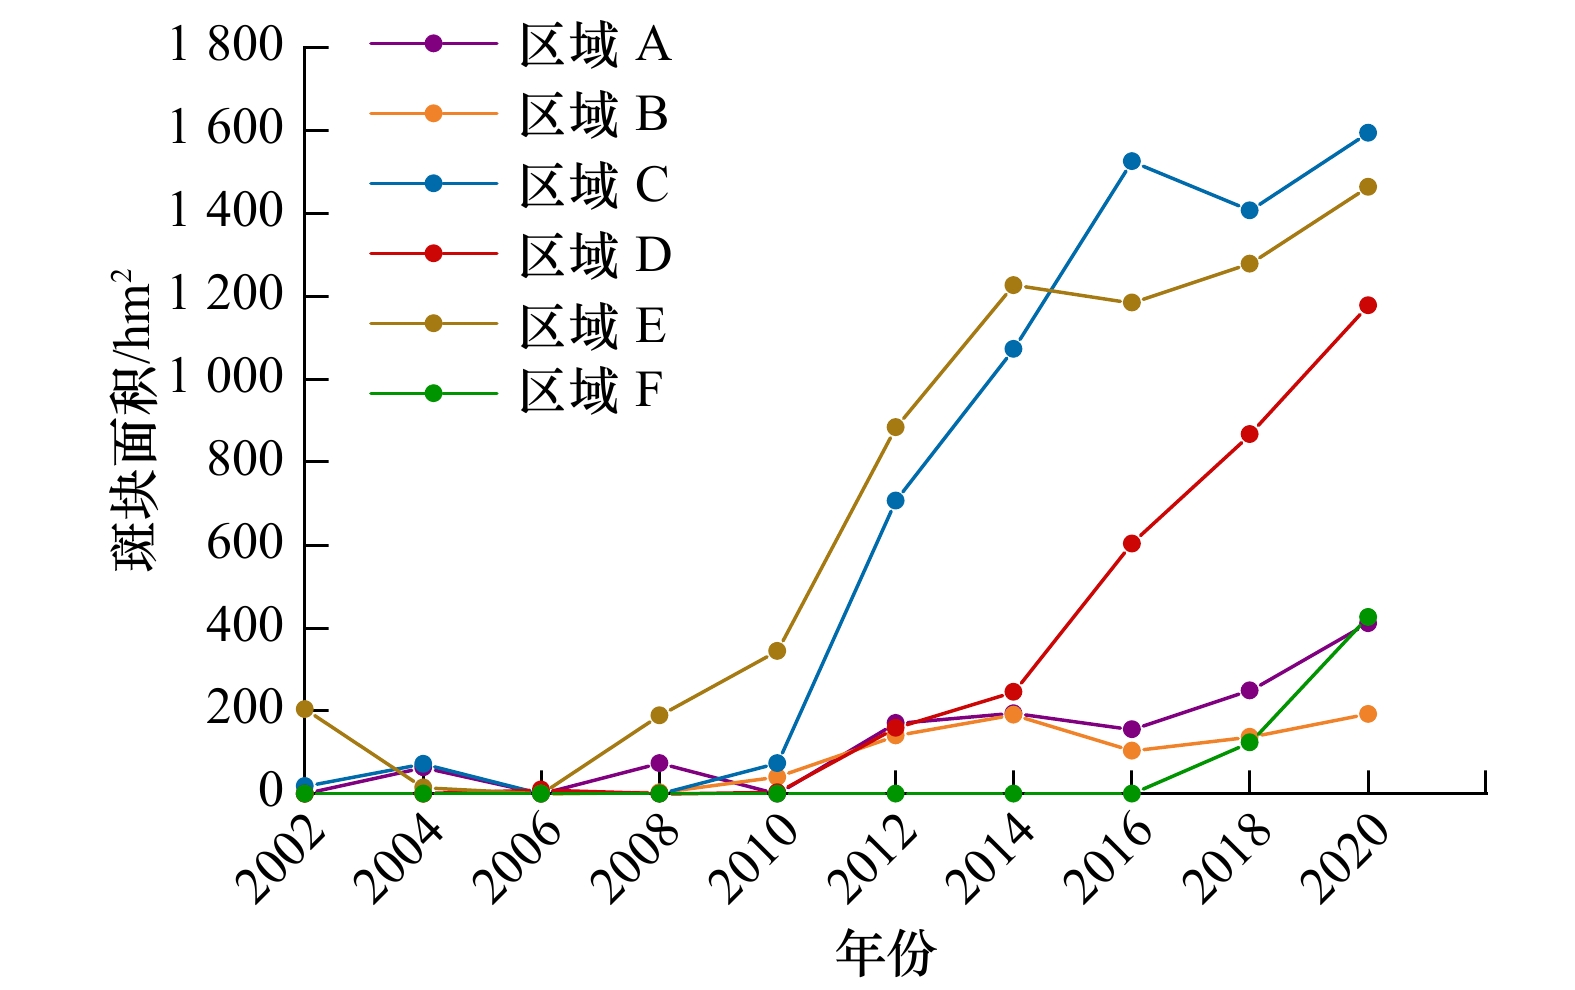
图 5 不同区域互花米草斑块面积变化
Fig. 5 Variation of Spartina alterniflora plaque area in different regions
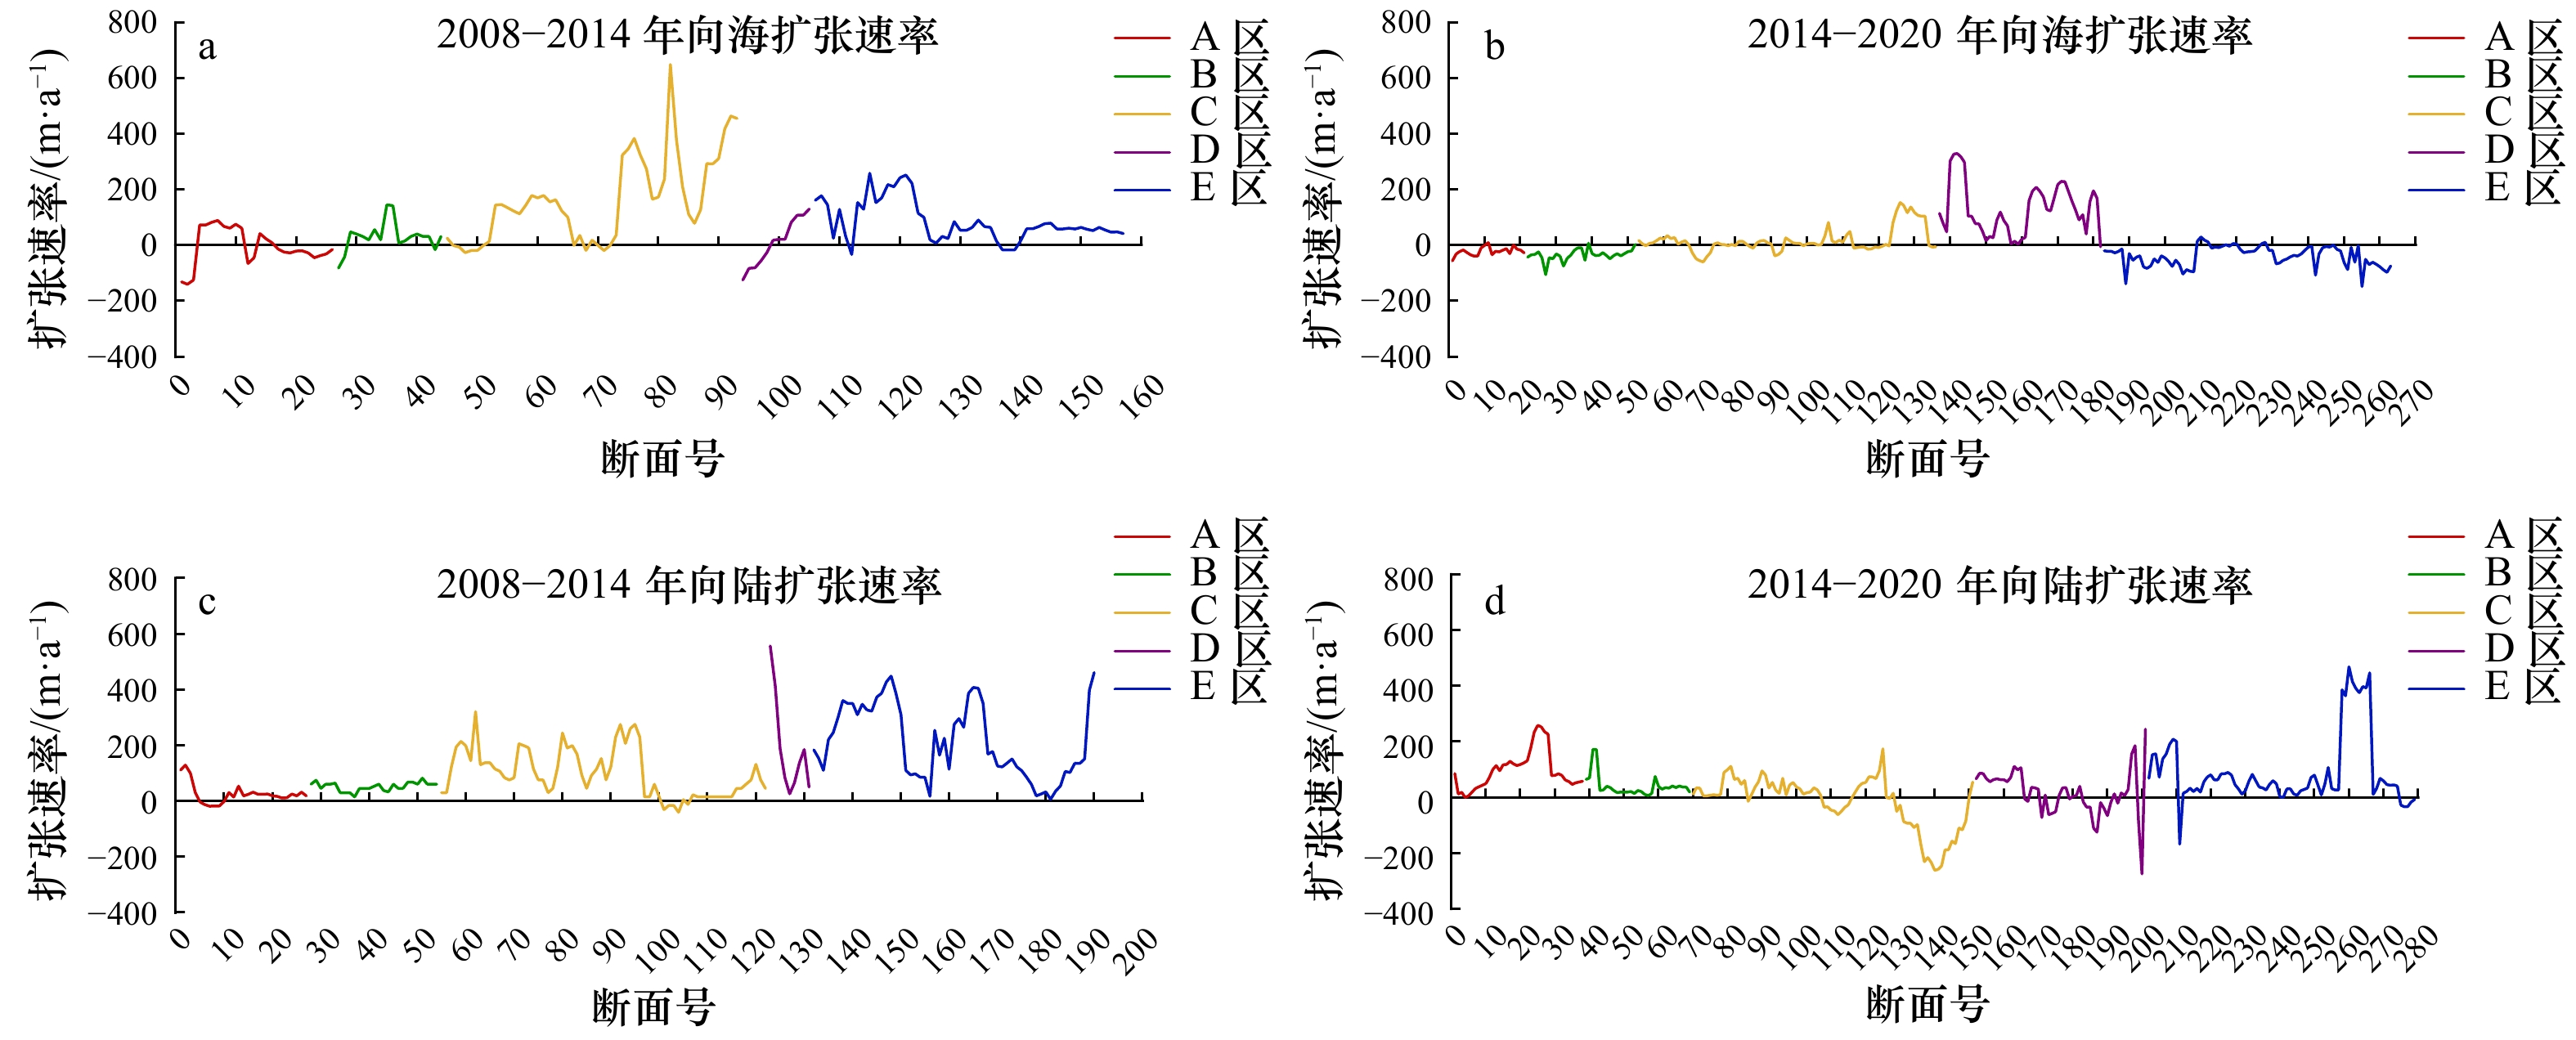
图 6 区域A−E互花米草向海和向陆的扩张速率
Fig. 6 Seaward and landward expansion rates of Spartina alterniflora in A−E areas
表 1 卫星数据信息
Tab. 1 Satellite data information
影像类型 成像时间 影像类型 成像时间 影像类型 成像时间 Landsat-7 ETM+ 2000年5月2日 Landsat-7 ETM+ 2006年10月26日 Landsat-8 OLI 2014年7月20日 Landsat-5 TM 2000年9月15日 Landsat-5 TM 2008年6月1日 Landsat-8 OLI 2014年10月24日 Landsat-5 TM 2000年10月17日 Landsat-5 TM 2008年9月5日 Landsat-7 ETM+ 2016年5月30日 Landsat-7 ETM+ 2002年5月24日 Landsat-7 ETM+ 2008年10月31日 Landsat-8 OLI 2016年8月26日 Landsat-7 ETM+ 2002年9月29日 Landsat-5 TM 2010年6月7日 Landsat-8 OLI 2016年11月14日 Landsat-5 TM 2002年10月23日 Landsat-5 TM 2010年9月11日 Landsat-8 OLI 2018年5月28日 Landsat-7 ETM+ 2004年5月13日 Landsat-5 TM 2010年10月13日 Landsat-8 OLI 2018年9月17日 Landsat-7 ETM+ 2004年9月18日 Landsat-7 ETM+ 2012年5月19日 Landsat-8 OLI 2018年10月19日 Landsat-7 ETM+ 2004年10月20日 Landsat-7 ETM+ 2012年8月23日 Landsat-8 OLI 2020年5月17日 Landsat-7 ETM+ 2006年6月4日 Landsat-7 ETM+ 2012年10月26日 Landsat-7 ETM+ 2020年9月30日 Landsat-7 ETM+ 2006年9月24日 Landsat-8 OLI 2014年5月1日 Landsat-8 OLI 2020年10月24日  下载: 导出CSV
表 2 2000−2020年不同地物类型的样本信息
Tab. 2 Sample information of different feature types from 2000 to 2020
类型 训练样本个数(对象)/验证样本个数(个) 2000年 2002年 2004年 2006年 2008年 2010年 2012年 2014年 2016年 2018年 2020年 芦苇 42/104 45/105 44/112 47/131 60/160 74/187 76/216 83/215 92/203 98/232 102/236 碱蓬 30/92 38/115 45/135 30/115 30/102 32/136 33/118 39/113 41/120 44/124 43/160 互花米草 − 6/25 5/21 2/10 5/32 12/46 38/112 48/138 80/220 92/240 95/262 光滩 37/118 38/121 31/108 36/105 42/110 38/125 31/114 46/129 45/102 51/127 45/132 水体 21/68 26/82 29/84 25/87 30/96 42/114 34/102 38/117 44/103 45/113 47/125 其他 15/38 16/32 17/30 15/32 16/30 31/32 32/48 30/48 30/52 36/64 38/85 注:−代表该年份研究区内无此地物类型分布。
下载: 导出CSV
表 3 初始特征空间
Tab. 3 The initial feature space
特征名称 光谱特征 蓝波段均值、绿波段均值、红波段均值、近红外波段均值、短波红外1波段均值、短波红外2波段均值、蓝波段标准差、绿波段标准差、红波段标准差、近红外波段标准差、短波红外1波段标准差、短波红外2波段标准差、亮度、最大化差异 几何特征 宽度、长度、长宽比、不对称性、边界指数、紧凑性、密度、形状指数 纹理特征 基于灰度共生矩阵的第一主成分的平均值、方差、同质性、对比度、非相似性、熵、角二矩阵和相关性 其他特征 归一化植被指数、差值植被指数、比值植被指数、归一化水体指数、改进归一化水体指数
下载: 导出CSV
表 4 优选特征分布
Tab. 4 Preferred feature distribution
月份 优选特征 5月 蓝波段均值、绿波段标准差、比值植被指数 9月 蓝波段标准差、短波红外1波段标准差、短波红外2波段均值、亮度、归一化植被指数、差值植被指数、改进归一化水体指数、
不对称性、长宽比、紧凑性、基于灰度共生矩阵的方差、对比度、熵10月 红波段标准差、短波红外2波段均值、短波红外2波段标准差、亮度、归一化植被指数、改进归一化水体指数、紧凑性、密度、
基于灰度共生矩阵的对比度、方差
下载: 导出CSV
表 5 景观格局指数及其生态意义
Tab. 5 Landscape pattern index and its ecological significance
指数 公式描述 生态意义 斑块面积(Class Area,CA) ${{\rm{CA} }=\sum\limits_{j=1}^{n}{a}_{ij} }$ 表征某一类型所有斑块的总面积,可度量景观的组分 斑块所占景观面积比例
(Percent of Landscape,PLAND)${ {\rm{PLAND} }=\dfrac{\sum\limits_{j=1}^{n}{a}_{ij} }{A}\times 100\text{%}}$ 表征某一斑块类型的面积占景观总面积的百分比,是确定景观中优势物种的重要依据 最大斑块指数
(Largest Patch Index,LPI)${{\rm{LPI} } = \max\limits_ {j = 1}^n \left( { {a_{ij} } } \right)/A}$ 表征某一类型中的最大斑块面积占整个景观的比例,有助于确定景观的优势类型 平均斑块面积(AREA_Mean) ${{\rm{AREA} }\_{\rm{Mean} }=\mathrm{C}\mathrm{A}/NP}$ 表征景观的破碎程度,值越小,斑块类型越破碎 斑块形状指数
(Landscape Shape Index,LSI)${ {\rm{LSI} }=0.25E/\sqrt{A} }$ 反映景观类型的形状变化,值越大,斑块形状越复杂 聚合指数(Aggregation Index,AI) $ {{\rm{AI} }=\dfrac{ {g}_{ij} }{ {\max}{g}_{ij} }\times 100 }$ 反映景观类型中斑块之间的聚散程度,值越大,斑块内部的连接度越高,而破碎度越低 注:aij表示斑块ij的面积;A表示所有景观总面积;E表示所有斑块边界的总长度;gij表示相应景观类型的相似邻接斑块数量;NP表示斑块个数。
下载: 导出CSV
表 6 精度验证结果
Tab. 6 Results of accuracy verification
类别 2000年 2002年 2004年 2006年 2008年 2010年 2012年 2014年 2016年 2018年 2020年 平均值 芦苇 96.15a 95.24a 93.75a 90.84a 92.50a 87.70a 93.52a 88.84a 98.03a 91.81a 93.64a 92.91a 92.59b 99.01b 96.33b 88.81b 94.27b 96.47b 91.82b 83.77b 93.87b 90.64b 94.44b 92.90b 碱蓬 81.52a 82.61a 82.22a 86.09a 89.22a 84.56a 88.14a 84.07a 88.33a 83.87a 87.41a 85.28a 84.27b 87.16b 86.72b 81.15b 81.25b 86.47b 87.39b 83.33b 80.92b 85.95b 84.29b 84.44b 互花米草 − 84.00a 95.24a 90.00a 84.380a 82.61a 84.82a 86.96a 90.91a 92.50a 96.18a 88.57a − 100.00b 90.91b 90.00b 100.00b 84.44b 89.62b 81.63b 97.56b 94.07b 93.33b 92.16b 总体精度/% 88.57 89.58 88.57 86.88 89.81 91.09 90.70 84.74 91.75 90.22 92.39 89.48 Kappa系数 0.85 0.87 0.86 0.83 0.87 0.89 0.88 0.81 0.89 0.88 0.91 0.87 注:a为制图精度(%);b为用户精度(%);−代表该年份研究区内无此地物类型分布。
下载: 导出CSV
表 7 研究区互花米草的新增面积增速及年扩展率
Tab. 7 Area increasing rate and annual expansion rate of Spartina alterniflora in the study area
项目 2008−2010年 2010−2012年 2012−2014年 2014−2016年 2016−2018年 2018−2020年 面积增速/(hm2·a−1) 97.56 799.88 434.25 322.81 240.68 605.84 年扩展率/% 31.53 111.42 19.16 10.45 3.10 13.97
下载: 导出CSV
-
[1] Barbier E B. Valuing ecosystem services for coastal wetland protection and restoration: progress and challenges[J]. Resources, 2013, 2(3): 213−230. doi: 10.3390/resources2030213 [2] 宗秀影, 刘高焕, 乔玉良, 等. 黄河三角洲湿地景观格局动态变化分析[J]. 地球信息科学学报, 2009, 11(1): 91−97. doi: 10.3969/j.issn.1560-8999.2009.01.014Zong Xiuying, Liu Gaohuan, Qiao Yuliang, et al. Study on dynamic changes of wetland landscape pattern in Yellow River Delta[J]. Journal of Geo-Information Science, 2009, 11(1): 91−97. doi: 10.3969/j.issn.1560-8999.2009.01.014 [3] Fitzsimmons O N, Ballard B M, Merendino M T, et al. Implications of coastal wetland management to nonbreeding waterbirds in Texas[J]. Wetlands, 2012, 32(6): 1057−1066. doi: 10.1007/s13157-012-0336-2 [4] Fu Bolin, Wang Yeqiao, Campbell A, et al. Comparison of object-based and pixel-based Random Forest algorithm for wetland vegetation mapping using high spatial resolution GF-1 and SAR data[J]. Ecological Indicators, 2017, 73: 105−117. doi: 10.1016/j.ecolind.2016.09.029 [5] Jin Kangkang, Fan Jinshan, Zhao Xuan, et al. Analysis on dynamic change of vegetation coverage in coastal wetland of Yellow River Delta[J]. IOP Conference Series: Earth and Environmental Science, 2020, 450: 012108. doi: 10.1088/1755-1315/450/1/012108 [6] 韩美, 张晓惠, 刘丽云. 黄河三角洲湿地研究进展[J]. 生态环境学报, 2006, 15(4): 872−875. doi: 10.3969/j.issn.1674-5906.2006.04.041Han Mei, Zhang Xiaohui, Liu Liyun. Research progress on wetland of the Yellow River Delta[J]. Ecology and Environment, 2006, 15(4): 872−875. doi: 10.3969/j.issn.1674-5906.2006.04.041 [7] 莫利江, 曹宇, 胡远满, 等. 面向对象的湿地景观遥感分类——以杭州湾南岸地区为例[J]. 湿地科学, 2012, 10(2): 206−213. doi: 10.3969/j.issn.1672-5948.2012.02.013Mo Lijiang, Cao Yu, Hu Yuanman, et al. Object-oriented classification for satellite remote sensing of wetlands: a case study in southern Hangzhou Bay area[J]. Wetland Science, 2012, 10(2): 206−213. doi: 10.3969/j.issn.1672-5948.2012.02.013 [8] Ren Kai, Sun Weiwei, Meng Xiangchao, et al. Fusing China GF-5 hyperspectral data with GF-1, GF-2 and sentinel-2A multispectral data: which methods should Be used?[J]. Remote Sensing, 2020, 12(5): 882. doi: 10.3390/rs12050882 [9] Sun Weiwei, Du Qian. Hyperspectral band selection: a review[J]. IEEE Geoscience and Remote Sensing Magazine, 2019, 7(2): 118−139. doi: 10.1109/MGRS.2019.2911100 [10] Zhu Yuanhui, Liu Kai, Liu Lin, et al. Retrieval of mangrove aboveground biomass at the individual species level with WorldView-2 images[J]. Remote Sensing, 2015, 7(9): 12192−12214. doi: 10.3390/rs70912192 [11] Wang Anqi, Chen Jiadai, Jing Changwei, et al. Monitoring the invasion of Spartina alterniflora from 1993 to 2014 with Landsat TM and SPOT 6 satellite data in Yueqing Bay, China[J]. PLoS ONE, 2015, 10(8): e0135538. doi: 10.1371/journal.pone.0135538 [12] Ai Jinquan, Gao Wei, Gao Zhiqiang, et al. Phenology-based Spartina alterniflora mapping in coastal wetland of the Yangtze Estuary using time series of GaoFen satellite No. 1 wide field of view imagery[J]. Journal of Applied Remote Sensing, 2017, 11(2): 026020. doi: 10.1117/1.JRS.11.026020 [13] Huang Huamei, Zhang Liquan. A study of the population dynamics of Spartina alterniflora at Jiuduansha shoals, Shanghai, China[J]. Ecological Engineering, 2007, 29(2): 164−172. doi: 10.1016/j.ecoleng.2006.06.005 [14] Lee T M, Yeh H C. Applying remote sensing techniques to monitor shifting wetland vegetation: a case study of Danshui River estuary mangrove communities, Taiwan[J]. Ecological Engineering, 2009, 35(4): 487−496. doi: 10.1016/j.ecoleng.2008.01.007 [15] Zhang Xi, Xiao Xiangming, Wang Xinxin, et al. Quantifying expansion and removal of Spartina alterniflora on Chongming Island, China, using time series Landsat images during 1995−2018[J]. Remote Sensing of Environment, 2020, 247: 111916. doi: 10.1016/j.rse.2020.111916 [16] Laba M, Downs R, Smith S, et al. Mapping invasive wetland plants in the Hudson River National Estuarine Research Reserve using quickbird satellite imagery[J]. Remote Sensing of Environment, 2008, 112(1): 286−300. doi: 10.1016/j.rse.2007.05.003 [17] Szantoi Z, Escobedo F J, Abd-Elrahman A, et al. Classifying spatially heterogeneous wetland communities using machine learning algorithms and spectral and textural features[J]. Environmental Monitoring and Assessment, 2015, 187(5): 262. doi: 10.1007/s10661-015-4426-5 [18] Zlinszky A, Mücke W, Lehner H, et al. Categorizing wetland vegetation byairborne laser scanning on Lake Balaton and Kis-Balaton, Hungary[J]. Remote Sensing, 2012, 4(6): 1617−1650. doi: 10.3390/rs4061617 [19] Han Xingxing, Chen Xiaoling, Feng Lian. Four decades of winter wetland changes in Poyang Lake based on Landsat observations between 1973 and 2013[J]. Remote Sensing of Environment, 2015, 156: 426−437. doi: 10.1016/j.rse.2014.10.003 [20] Timm B C, McGarigal K. Fine-scale remotely-sensed cover mapping of coastal dune and salt marsh ecosystems at Cape Cod National Seashore using Random Forests[J]. Remote Sensing of Environment, 2012, 127: 106−117. doi: 10.1016/j.rse.2012.08.033 [21] 毕恺艺, 牛铮, 黄妮, 等. 基于Sentinel-2A时序数据和面向对象决策树方法的植被识别[J]. 地理与地理信息科学, 2017, 33(5): 16−20, 27. doi: 10.3969/j.issn.1672-0504.2017.05.003Bi Kaiyi, Niu Zheng, Huang Ni, et al. Identifying vegetation with decision tree model based on object-oriented method using multi-temporal Sentinel-2A images[J]. Geography and Geo-Information Science, 2017, 33(5): 16−20, 27. doi: 10.3969/j.issn.1672-0504.2017.05.003 [22] Lantz N J, Wang Jinfei. Object-based classification of Worldview-2 imagery for mapping invasive common reed, Phragmites australis[J]. Canadian Journal of Remote Sensing, 2013, 39(4): 328−340. doi: 10.5589/m13-041 [23] Cao Mingchang, Liu Gaohuan, Zhang Xiaoyu. An object-oriented approach to map wetland vegetation: a case study of Yellow River Delta, 2007[C]//2007 IEEE International Geoscience and Remote Sensing Symposium. Barcelona, Spain: IEEE, 2007: 4585−4587. [24] 徐洋. 黄河口沙嘴地貌特征对植被分布格局的影响研究[D]. 烟台: 鲁东大学, 2019.Xu Yang. Study on the impacts of Yellow River estuary sand mouth geomorphological characteristics on vegetation distribution pattern[D]. Yantai: Ludong University, 2019. [25] 杨俊芳, 马毅, 任广波, 等. 基于国产高分卫星遥感数据的现代黄河三角洲入侵植物互花米草监测方法[J]. 海洋环境科学, 2017, 36(4): 596−602.Yang Junfang, Ma Yi, Ren Guangbo, et al. Monitoring method of invasive vegetation Spartina alterniflora in modern Yellow River Delta based on GF remote sensing data[J]. Marine Environmental Science, 2017, 36(4): 596−602. [26] 刘康, 闫家国, 邹雨璇, 等. 黄河三角洲盐地碱蓬盐沼的时空分布动态[J]. 湿地科学, 2015, 13(6): 696−701.Liu Kang, Yan Jiaguo, Zou Yuxuan, et al. Dynamics of spatial and temporal distribution of Suaeda salsas salt marshes in the Yellow River Delta[J]. Wetland Science, 2015, 13(6): 696−701. [27] Ren Guangbo, Zhao Yajie, Wang Jianbu, et al. Ecological effects analysis of Spartina alterniflora invasion within Yellow River Delta using long time series remote sensing imagery[J]. Estuarine, Coastal and Shelf Science, 2021, 249: 107111. doi: 10.1016/j.ecss.2020.107111 [28] Ding Qiong, Chen Wu, King B A, et al. Coastal wetland investigations by airborne LiDAR: a case study in the Yellow River Delta, China[J]. Marine Technology Society Journal, 2011, 45(5): 59−70. doi: 10.4031/MTSJ.45.5.6 [29] Sun Chao, Li Jialin, Liu Yongxue, et al. Plant species classification in salt marshes using phenological parameters derived from Sentinel-2 pixel-differential time-series[J]. Remote Sensing of Environment, 2021, 256: 112320. doi: 10.1016/j.rse.2021.112320 [30] 耿仁方, 付波霖, 蔡江涛, 等. 基于无人机影像和面向对象随机森林算法的岩溶湿地植被识别方法研究[J]. 地球信息科学学报, 2019, 21(8): 1295−1306. doi: 10.12082/dqxxkx.2019.180631Geng Renfang, Fu Bolin, Cai Jiangtao, et al. Object-based karst wetland vegetation classification method using unmanned aerial vehicle images and random forest algorithm[J]. Journal of Geo-Information Science, 2019, 21(8): 1295−1306. doi: 10.12082/dqxxkx.2019.180631 [31] Moffett K B, Gorelick S M. Distinguishing wetland vegetation and channel features with object-based image segmentation[J]. International Journal of Remote Sensing, 2013, 34(4): 1332−1354. doi: 10.1080/01431161.2012.718463 [32] Liu Jianhua, Du Mingyu, Mao Zhengyuan. Scale computation on high spatial resolution remotely sensed imagery multi-scale segmentation[J]. International Journal of Remote Sensing, 2017, 38(18): 5186−5214. doi: 10.1080/01431161.2017.1325536 [33] Drǎguţ L, Tiede D, Levick S R. ESP: a tool to estimate scale parameter for multiresolution image segmentation of remotely sensed data[J]. International Journal of Geographical Information Science, 2010, 24(6): 859−871. doi: 10.1080/13658810903174803 [34] 张磊, 宫兆宁, 王启为, 等. Sentinel-2影像多特征优选的黄河三角洲湿地信息提取[J]. 遥感学报, 2019, 23(2): 313−326.Zhang Lei, Gong Zhaoning, Wang Qiwei, et al. Wetland mapping of Yellow River Delta wetlands based on multi-feature optimization of Sentinel-2 images[J]. Journal of Remote Sensing, 2019, 23(2): 313−326. [35] 刘明月. 中国滨海湿地互花米草入侵遥感监测及变化分析[D]. 长春: 中国科学院大学(中国科学院东北地理与农业生态研究所), 2018.Liu Mingyue. Remote sensing analysis of Spartina alterniflora in the coastal areas of China during 1990 to 2015[D]. Changchun: University of Chinese Academy of Sciences (Northeast Institute of Geography and Agroecology, Chinese Academy of Sciences), 2018. [36] Zhang Cheng, Gong Zhaoning, Qiu Huachang, et al. Mapping typical salt-marsh species in the Yellow River Delta wetland supported by temporal-spatial-spectral multidimensional features[J]. Science of the Total Environment, 2021, 783: 147061. doi: 10.1016/j.scitotenv.2021.147061 [37] 赵可夫, 冯立田, 张圣强, 等. 黄河三角洲不同生态型芦苇对盐度适应生理的研究Ⅱ. 不同生态型芦苇的光合气体交换特点[J]. 生态学报, 2000, 20(5): 795−799. doi: 10.3321/j.issn:1000-0933.2000.05.014Zhao Kefu, Feng Litian, Zhang Shengqiang, et al. The salinity-adaptation physiology in different ecotypes of Phragmites communis in the Yellow River Delta Ⅱ. The characteristics of photosynthetic gas exchange in different ecotypes of Phragmites communis[J]. Acta Ecologica Sinica, 2000, 20(5): 795−799. doi: 10.3321/j.issn:1000-0933.2000.05.014 -


计量
- 文章访问数: 1045
- HTML全文浏览量: 422
- PDF下载量: 140
- 被引次数: 0
