

Theoretical analysis of anomalous equatorial ocean stationary wave and its interannual variability
-
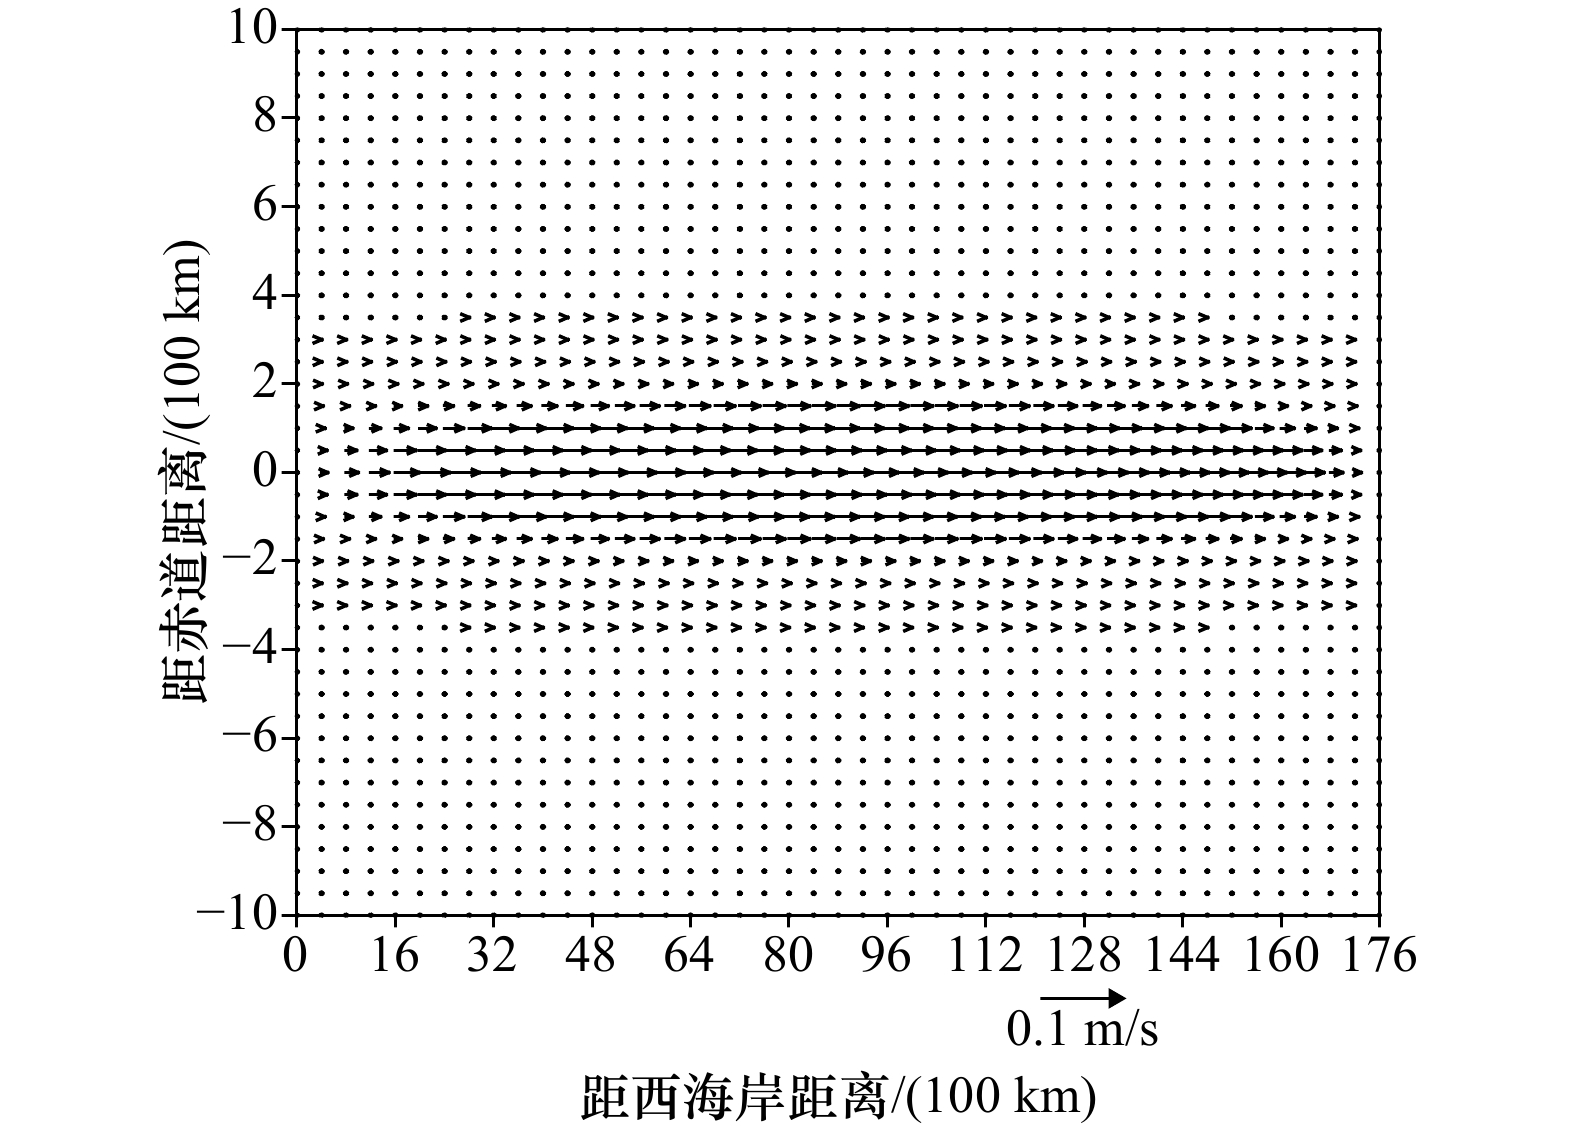
摘要: 本文采用赤道β平面近似下的线性化正压扰动方程组,引入约化重力加速度后,得到了赤道驻波异常的解析解,给出了此解的计算结果,并与实际热带太平洋和印度洋流场异常复EOF分析的模态做了比较,得到以下主要结论:赤道驻波异常的模态1,其流场异常在整个大洋为半波,呈一致的纬向流;流场异常在热带大洋中部最大,并向赤道南北两侧迅速衰减,其被限制在赤道两侧约2º的范围内。赤道驻波的模态2,其流场异常在整个大洋为1波,在大洋东、西部纬向流的流动方向相反,流场异常向赤道南北两侧衰减的程度同模态1。赤道驻波异常分别满足南北走向的东、西海岸边条件。决定赤道驻波异常在赤道两侧衰减程度的系数,其仅与约化重力加速度和上层海水标准深度之乘积的平方根值成反比;当该值取得相同时该衰减程度也相同。赤道驻波异常的振荡频率与模态序号及上述平方根值成正比,与热带大洋宽度成反比;模态序号越低,该宽度越大,则该频率越低,相应振荡周期也越长;模态1的振荡周期最长。当取各参数为典型值,并取模态序号为1,再分别取热带太平洋和印度洋的宽度时,对赤道驻波异常计算的结果表明,其与实际相应海洋上层流场异常复EOF分析中得到的第一模态空间分布和年际变化相一致;这意味着此复EOF分析第一模态的本质是赤道驻波异常,这也表明该驻波异常在实际大洋中确实存在,并推断该驻波异常是ENSO和印度洋偶极子的形成机制之一。Abstract: In this paper, using the equatorial beta-plane approximation of the linear barotropic perturbation equations and introducing the reduced gravitational acceleration, we obtain the analytical solutions of anomalous equatorial ocean stationary wave and give the calculation results of the solutions. Then we compare the results with the modes of complex EOF analysis about abnormal circulation of the real tropical Pacific Ocean and Indian Ocean. The main conclusions are: in the first mode of anomalous equatorial ocean stationary wave, the current disturbance throughout the whole ocean is the half wave, which appears as the consistent zonal flow. The maximum disturbance appears at the middle of the tropical ocean and decays rapidly from equator to north and south, which is restricted in about 2 degree range on both sides of the equator. In the second mode, the current disturbance throughout the whole ocean is the full wave and has the opposite flow direction at east and west of the ocean. The degree of the attenuation of the current disturbance from equator to north and south is as that of the first mode. Anomalous equatorial ocean stationary wave meets the boundary conditions of the east and west coast directing along the longitude. The coefficient is inversely proportional to the square root of the product of the reduced gravity acceleration and the upper water standard depth, which determines the decay rate of anomalous equatorial ocean stationary wave on both sides of the equator. If the square root values take the same, the decay rates are the same. The oscillation frequency of anomalous stationary wave is proportional to the modal number and the square root values, which is inversely proportional to the width of tropical ocean. The modal number is lower and the width is larger, the frequency is lower and the corresponding oscillation period is longer; the first mode of the oscillation period is the longest. Taking every parameters as the typical values and the modal number as one, then taking the width of the equatorial Pacific Ocean and Indian Ocean respectively, the calculation results show that the spatial distribution and interannual variability of the first mode are the same as the corresponding mode of the real abnormal circulation obtaining from the complex EOF analysis; this means that the nature of the first mode above is the anomalous equatorial ocean stationary wave and the anomalous stationary wave is one of the generating mechanism of ENSO and IOD.
-
Key words:
- equatorial stationary wave /
- Pacific Ocean /
- Indian Ocean /
- interannual variability
-

图 2 t=0,n=1时位势场异常(单位:m2/s2)的分布
Fig. 2 Anomalous potential field (unit: m2/s2) distribution at t=0, n=1
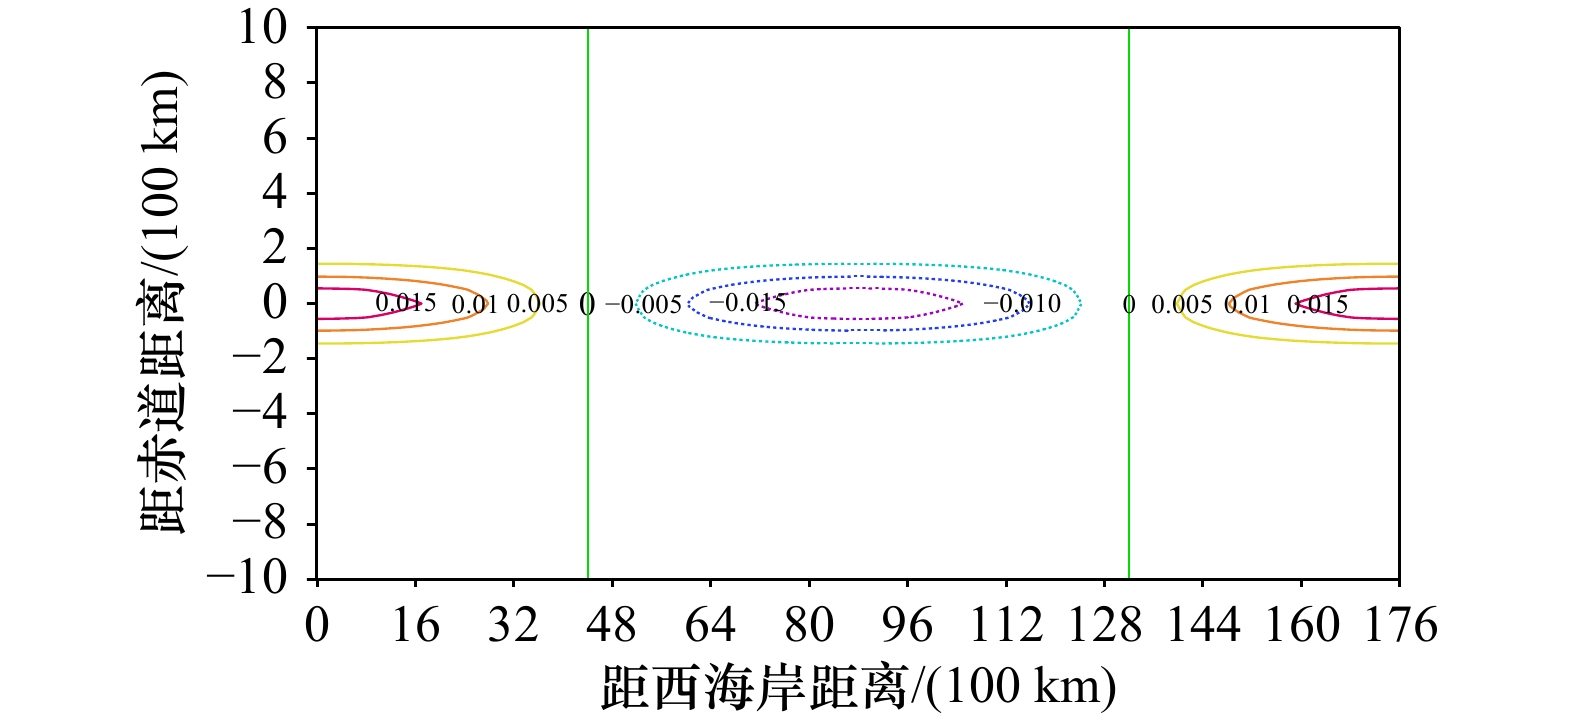
图 4 t=0,n=2时位势场异常(单位:m2/s2)的分布
Fig. 4 Anomalous potential field (unit: m2/s2) distribution at t=0, n=2
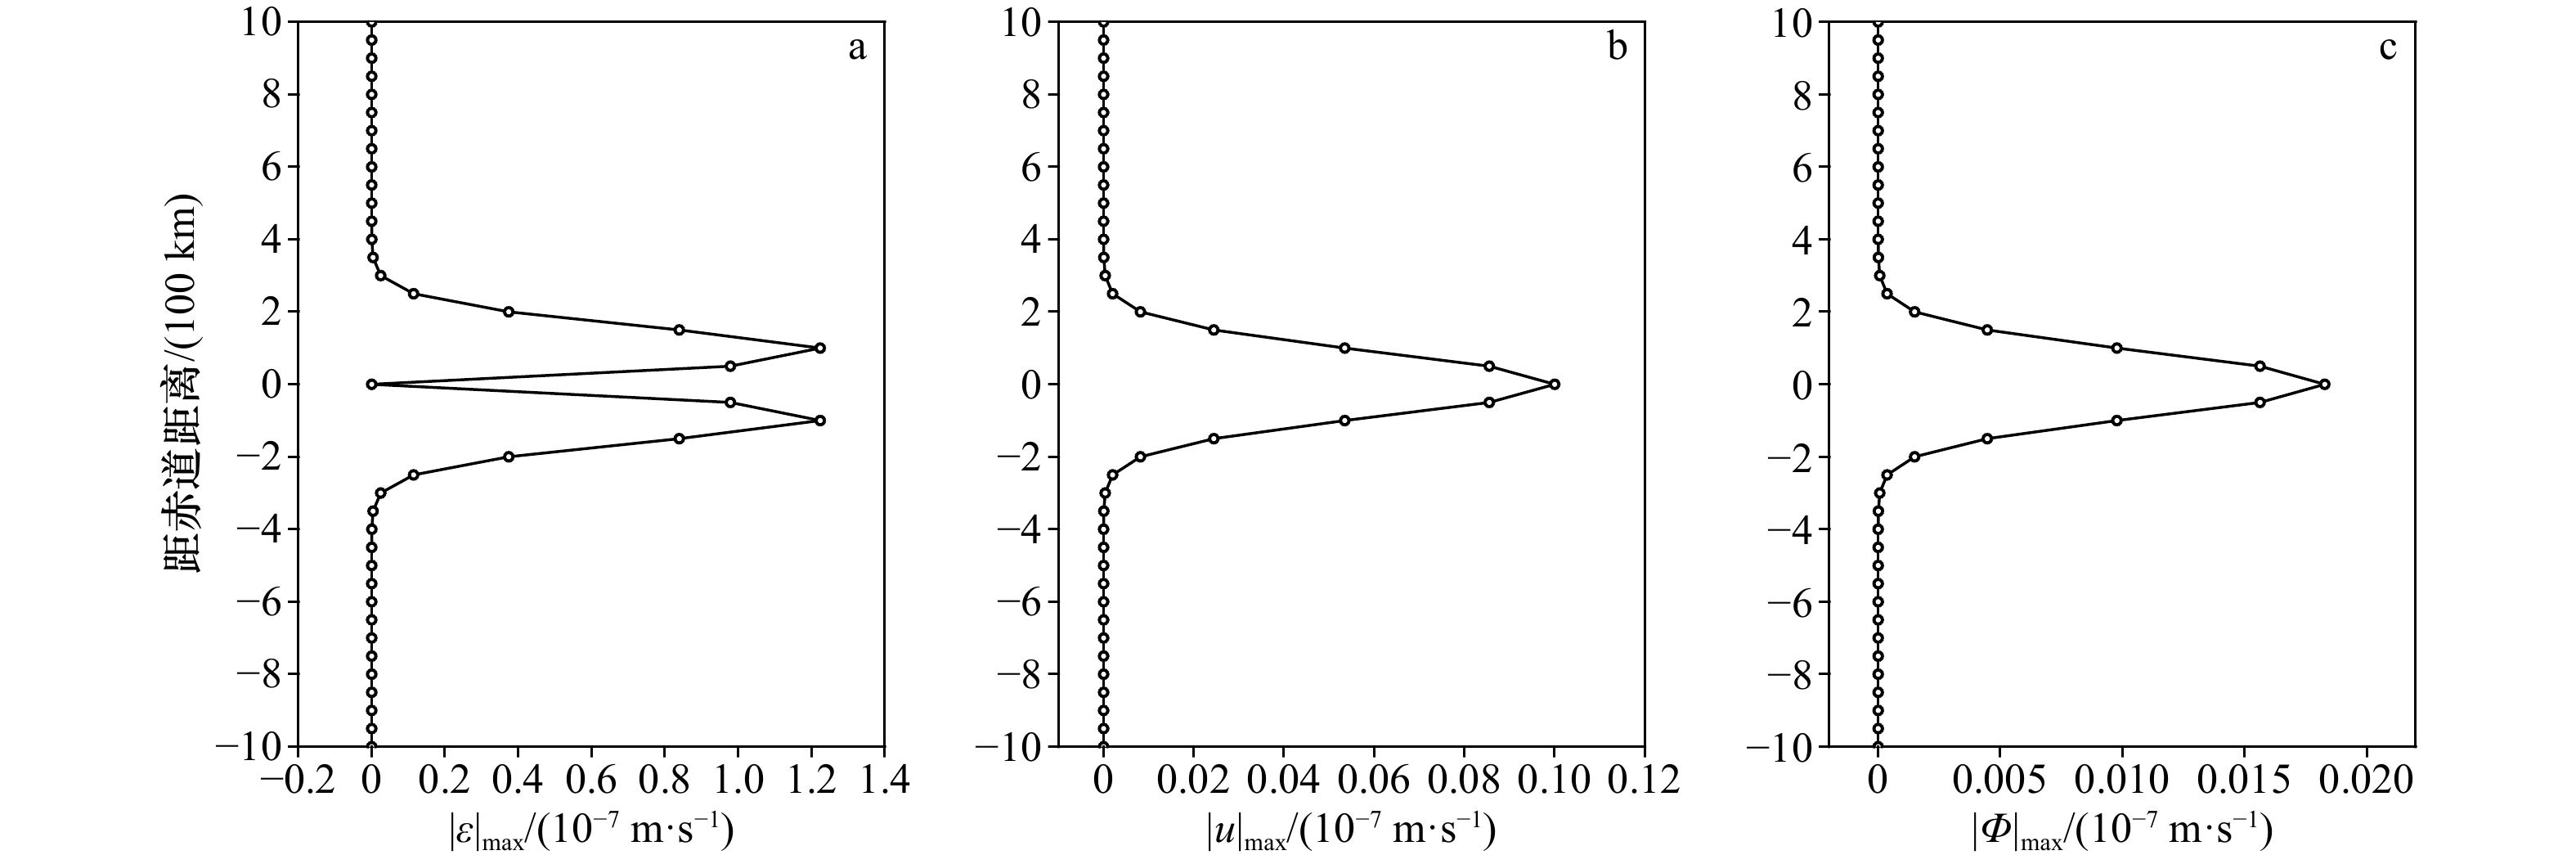
图 5
$ {\left| \varepsilon \right|_{\max }} $ (a)、$ {\left| u \right|_{\max }} $ (b)和${\left| \varPhi \right|_{\max }}$ (c)沿经向的分布Fig. 5 The distribution of
$ {\left| \varepsilon \right|_{\max }} $ (a)、$ {\left| u \right|_{\max }} $ (b)和$ {\left| \varPhi \right|_{\max }} $ (c) along longitude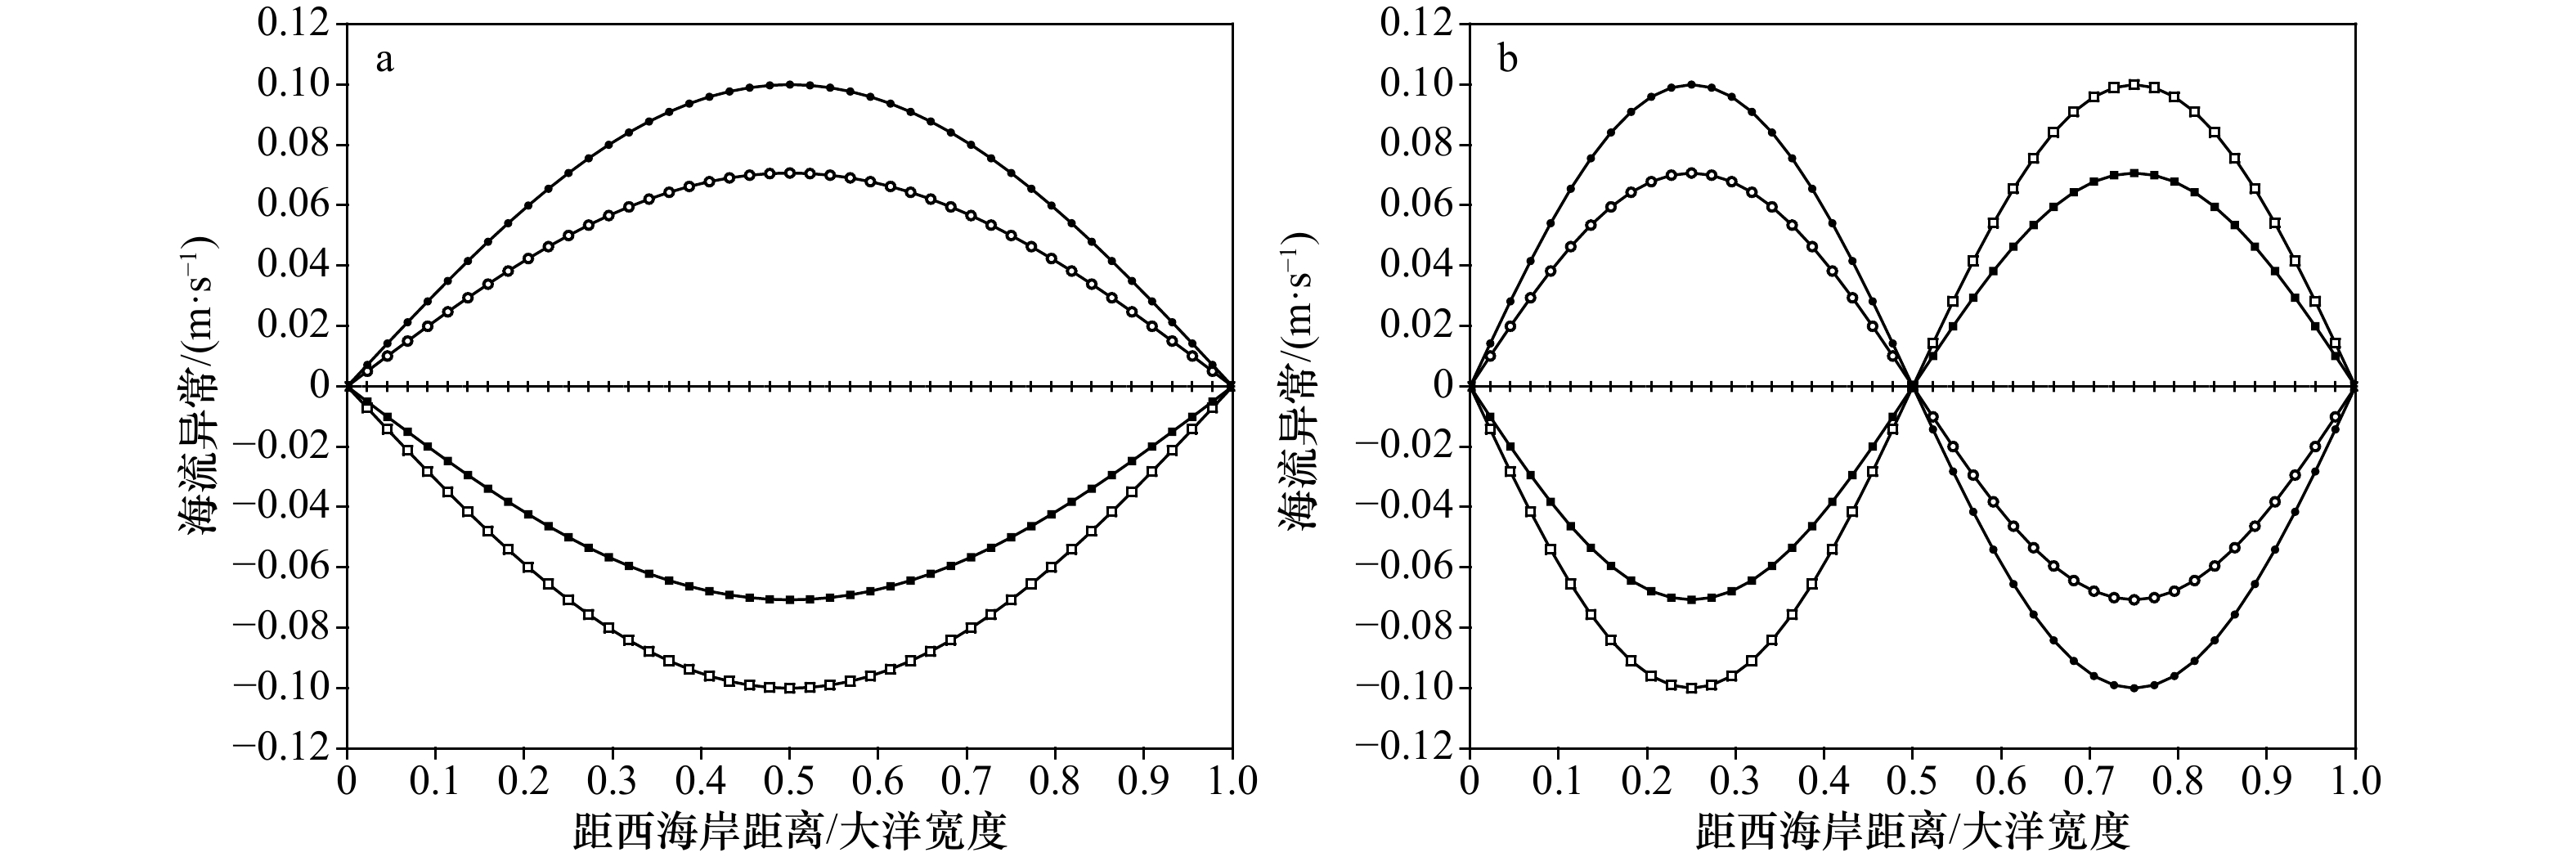
图 6 模态1(a)、模态2(b)中流场异常随时间分布
时刻0、T/8、T/4、5T/8、3T/4的波形分别用叉号线、空心圆线、实心圆线、实心方块线、空心方块线表示;时刻3T/8、T/2、7T/8的波形分别与T/8、0、5T/8的相同,在此T为模态1,模态2的周期
Fig. 6 Anomalous current distribution at different time in mode 1 (a) and mode 2 (b)
The hollow round line, the solid round line, the hollow block line and the solid block line represent the wave form at 0, T/8, T/4, 5T/8 and 3T/4 respectively; the wave forms at 3T/8, T/2 and 7T/8 are the same as T/8, 0, and 5T/8 respectively, here T represents period of mode 1, mode 2

图 7 模态1(a)、模态2(b)位势场异常(单位:m2/s2) 随时间的分布
时刻0、T/8、T/4、3T/8、T/2的波形分别用叉号线、空心圆线、实心圆线、空心方块线、实心方块线表示;时刻5T/8、3T/4、7T/8的波形分别与3T/8、T/4、T/8的相同,在此T为模态1,模态2的周期
Fig. 7 Anomalous potential field (unit: m2/s2) distribution at different time in mode 1 (a) and mode 2 (b)
The cross line, the hollow round line, the solid round line, the hollow block line and the solid block line represent the wave form at 0, T/8, T/4, 3 T/8 and T/2 respectively; the waveforms at 5T/8, 3T/4 and 7T/8 are the same as 3T/8, T/4 and T/8 respectively, here T represents period of mode 1, mode 2
-
[1] Matsuno T. Quasi-geostrophic motions in the equatorial area[J]. Journal of the Meteorological Society of Japan. Ser. II, 1966, 44(1): 25−43. doi: 10.2151/jmsj1965.44.1_25 [2] 巢纪平. 厄尔尼诺和南方涛动动力学[M]. 北京: 气象出版社, 1993.Chao Jiping. Dynamics of El Nino and Southern Oscillation[M]. Beijing: China Meteorological Press, 1993. [3] Hirst A C. Slow instabilities in tropical ocean basin-global atmosphere models[J]. Journal of the Atmospheric Sciences, 1988, 45(5): 830−852. doi: 10.1175/1520-0469(1988)045<0830:SIITOB>2.0.CO;2 [4] Yamagata T, Masumoto Y. A simple ocean-atmosphere coupled model for the origin of a warm El Niño Southern Oscillation event[J]. Philosophical Transactions of the Royal Society A: Mathematical, Physical and Engineering Sciences, 1989, 329(1604): 225−236. [5] 卢姁, 张东凌. 热带太平洋5月份上层洋流的动力统计诊断[J]. 热带海洋学报, 2009, 28(2): 22−30. doi: 10.3969/j.issn.1009-5470.2009.02.004Lu Xu, Zhang Dongling. A statistical diagnosis of upper-ocean currents in tropical Pacific Ocean in May[J]. Journal of Tropical Oceanography, 2009, 28(2): 22−30. doi: 10.3969/j.issn.1009-5470.2009.02.004 [6] 吕新刚, 乔方利, 夏长水. 胶州湾潮汐潮流动边界数值模拟[J]. 海洋学报, 2008, 30(4): 21−29.Lü Xingang, Qiao Fangli, Xia Changshui. Numerical simulation of tides and three-dimensional tidal currents in Jiaozhou Bay by a movable land-sea boundary model[J]. Haiyang Xuebao, 2008, 30(4): 21−29. [7] 李希彬, 孙晓燕, 姚志刚. 基于船载ADCP观测对半封闭海湾湾口断面潮流及余流的分析(英文)[J]. 海洋通报, 2012, 14(2): 37−45.Li Xibin, Sun Xiaoyan, Yao Zhigang. Analysis of tidal and residual currents across semi-enclosed bay mouth based on shipboard ADCP measurements[J]. Marine Science Bulletin, 2012, 14(2): 37−45. [8] 王春阳, 张永强, 王恩康, 等. 广东红海湾海流季节性特征分析[J]. 应用海洋学学报, 2020, 39(4): 480−489. doi: 10.3969/J.ISSN.2095-4972.2020.04.004Wang Chunyang, Zhang Yongqiang, Wang Enkang, et al. Seasonal characteristics of currents in Honghai Bay, Guangdong Province[J]. Journal of Applied Oceanography, 2020, 39(4): 480−489. doi: 10.3969/J.ISSN.2095-4972.2020.04.004 [9] Zheng Quanan, Hu Jianyu, Zhu Benlu, et al. Standing wave modes observed in the South China Sea deep basin[J]. Journal of Geophysical Research: Oceans, 2014, 119(7): 4185−4199. doi: 10.1002/2014JC009957 [10] Navas-Montilla A, Martínez-Aranda S, Lozano A, et al. 2D experiments and numerical simulation of the oscillatory shallow flow in an open channel lateral cavity[J]. Advances in Water Resources, 2021, 148: 103836. doi: 10.1016/j.advwatres.2020.103836 [11] Zhang Dongling, Zhu Juan, Lu Xu, et al. Wave packet solutions in a bounded equatorial ocean and its interannual and decadal variabilities[J]. Acta Oceanologica Sinica, 2019, 38(3): 45−59. doi: 10.1007/s13131-019-1398-2 [12] 卢姁, 张永鹏. 热带太平洋5月份海气联合动力统计诊断[J]. 海洋科学进展, 2009, 27(4): 411−420. doi: 10.3969/j.issn.1671-6647.2009.04.001Lu Xu, Zhang Yongpeng. Dynamic statistics and diagnostic analysis for air-sea integrated system in the Tropical Pacific Ocean in May[J]. Advances in Marine Science, 2009, 27(4): 411−420. doi: 10.3969/j.issn.1671-6647.2009.04.001 [13] 张东凌, 何卷雄. 热带印度洋上层洋流的动力统计诊断[J]. 气候与环境研究, 2005, 10(3): 387−400. doi: 10.3878/j.issn.1006-9585.2005.03.12Zhang Dongling, He Juanxiong. Dynamic statistic diagnosis of upper current in Tropical Indian Ocean[J]. Climatic and Environmental Research, 2005, 10(3): 387−400. doi: 10.3878/j.issn.1006-9585.2005.03.12 [14] 张东凌, 卢姁, 张铭. 印度洋冬季风异常海气环流耦合模态分析[J]. 大气科学, 2017, 41(5): 975−987.Zhang Dongling, Lu Xu, Zhang Ming. Analysis of abnormal air-sea coupled mode and the Indian winter monsoon[J]. Chinese Journal of Atmospheric Sciences, 2017, 41(5): 975−987. [15] 卢姁, 包赟, 吕庆平. 热带太平洋上层洋流异常的复EOF分析[J]. 海洋预报, 2014, 31(2): 56−66. doi: 10.11737/j.issn.1003-0239.2014.02.009Lu Xu, Bao Yun, Lü Qingping. CEOF analysis for upper current of tropic Pacific Ocean[J]. Marine Forecasts, 2014, 31(2): 56−66. doi: 10.11737/j.issn.1003-0239.2014.02.009 [16] 张东凌, 卢姁. 冬季热带印度洋上层流场异常模态分析[J]. 气候与环境研究, 2017, 22(4): 463−472. doi: 10.3878/j.issn.1006-9585.2016.15011Zhang Dongling, Lu Xu. Analysis of abnormal upper circulation over the Tropical Indian Ocean in winter[J]. Climatic and Environmental Research, 2017, 22(4): 463−472. doi: 10.3878/j.issn.1006-9585.2016.15011 [17] 张东凌, 卢姁, 张铭. 1月份两类ENSO的海气环流模态分析[J]. 大气科学, 2019, 43(4): 741−758.Zhang Dongling, Lu Xu, Zhang Ming. Analysis of ocean-atmosphere circulation modes associated with two types of ENSO in January[J]. Chinese Journal of Atmospheric Sciences, 2019, 43(4): 741−758. [18] 张东凌, 卢姁, 张铭. 春季WYRTKI急流异常及其与亚洲热带夏季风的关系[J]. 海洋学研究, 2018, 36(1): 16−26. doi: 10.3969/j.issn.1001-909X.2018.01.002Zhang Dongling, Lu Xu, Zhang Ming. Wyrtki Jet anomaly in May and its relationship with Asian tropical summer monsoon[J]. Journal of Marine Sciences, 2018, 36(1): 16−26. doi: 10.3969/j.issn.1001-909X.2018.01.002 [19] Houghton R W, Tourre Y M. Characteristics of low-frequency sea surface temperature fluctuations in the Tropical Atlantic[J]. Journal of Climate, 1992, 5(7): 765−772. doi: 10.1175/1520-0442(1992)005<0765:COLFSS>2.0.CO;2 [20] Wang Bin, Wu Renguang, Fu Xiouhua, et al. Pacific-East Asian teleconnection: how does ENSO affect East Asian climate?[J]. Journal of Climate, 2000, 13(9): 1517−1536. doi: 10.1175/1520-0442(2000)013<1517:PEATHD>2.0.CO;2 [21] Saji N H, Goswami B N, Vinayachandran P N, et al. A dipole mode in the Tropical Indian Ocean[J]. Nature, 1999, 401(6751): 360−363. -

 下载:
下载:


计量
- 文章访问数: 507
- HTML全文浏览量: 239
- PDF下载量: 49
- 被引次数: 0
