

Evaluation on sediments quality around the Yongxing Island of Xisha
-
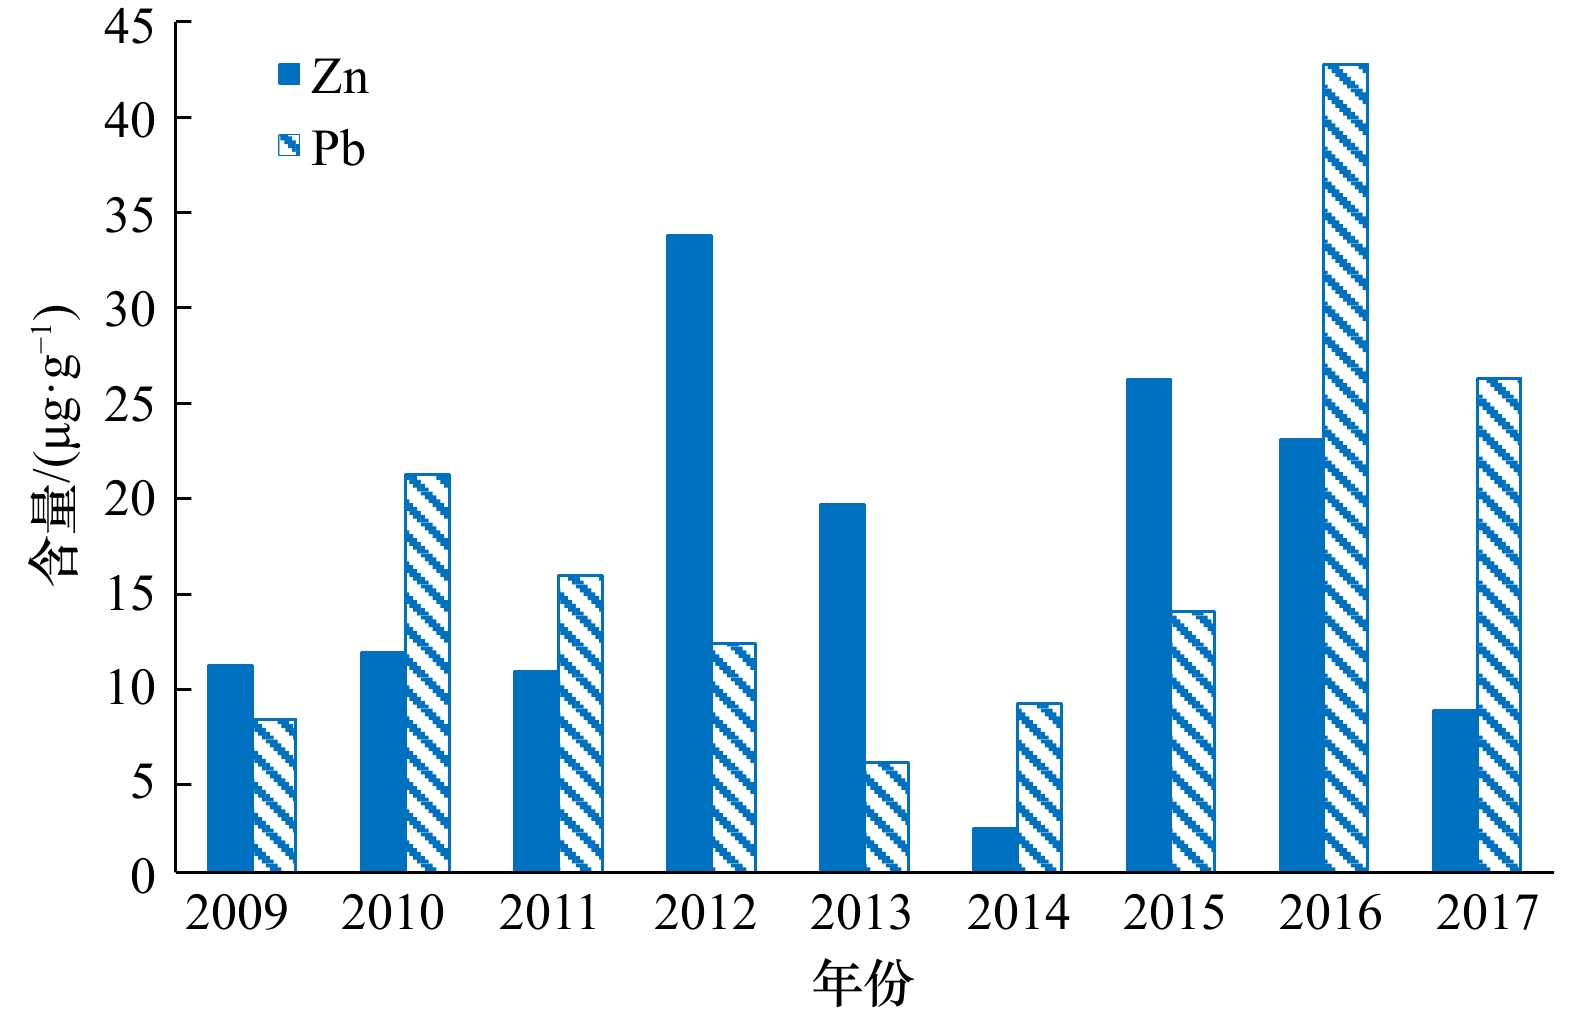
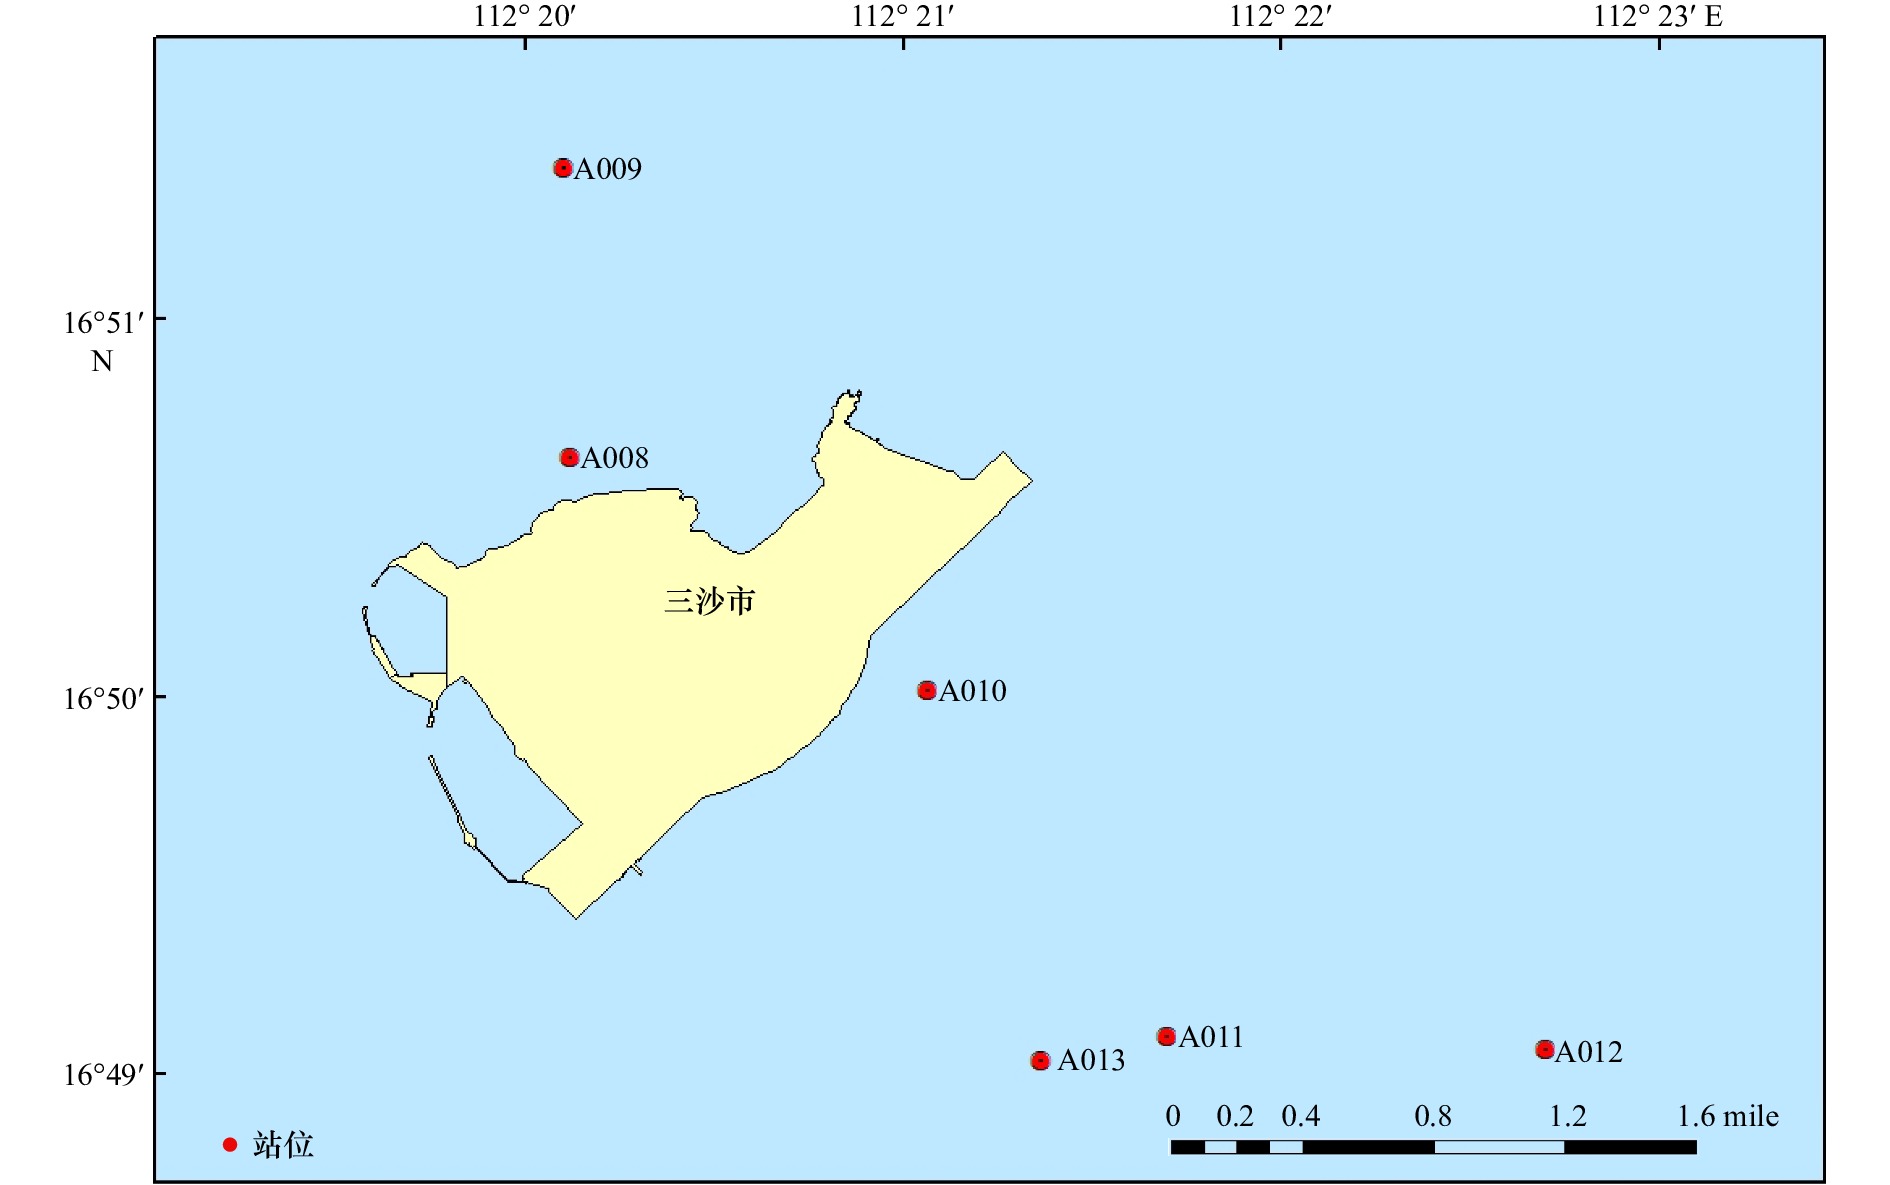
摘要: 根据2009‒2017年9个航次对西沙永兴岛附近海域共6个站位的沉积物重金属监测结果,应用数理统计法估算了该区域7种重金属元素的背景值,分析了重金属的含量及年际变化,采用单因子标准指数法和潜在生态危害指数法对其重金属含量进行了评价。结果表明:研究区域沉积物重金属具有低背景值,均符合海洋沉积物质量第一类标准,沉积物质量为优。7种重金属含量的年际变化显著,变化规律不尽相同,受岛上开发活动影响较大。从2009年到2017年,重金属Zn、Cd、Cu、Cr、As和Hg含量变化的总体趋势先增多后减少,Pb的含量则表现为增多。潜在生态风险评价显示,多年平均潜在生态危害系数由大到小依次为Cd、Hg、As、Cu、Pb、Cr、Zn,Cd和Hg是该研究海域潜在的生态风险因子。Abstract: Based on the investigations of surface sediments at six sampling stations of nine cruises carried out in the sea around the Yongxing Island of Xisha from 2009 to 2017, the background values of seven heavy metals are determined through the process of mathematical statistics, the contents and inter-annual variations of heavy metals are analyzed, and the contents of the heavy metals are evaluated by means of single factor standard index and potential ecological risk index. The results show that the background values of heavy metals in the sediments of the study area are low, the average level of them meet the first class of marine sediment quality, and the quality of sediment is excellent. The inter-annual variations of seven heavy metals in the sediments of the study area are slightly different and generally significant and affected obviously by the development activities on the Yongxing Island. From 2009 to 2017, the contents of Zn, Cd, Cu, Cr, As and Hg are to increase first and then decrease, while the content of Pb is to increase. The assessment by means of potential ecological risk index shows that the multi year average of potential ecological risk indexes are in the order of Cd, Hg, As, Cu, Pb, Cr, Zn, and Cd and Hg are the main potential ecological risk factors of the study area.
-
Key words:
- Yongxing Island /
- sediment /
- heavy metals /
- background values /
- inter-annual variations /
- ecological risk
-
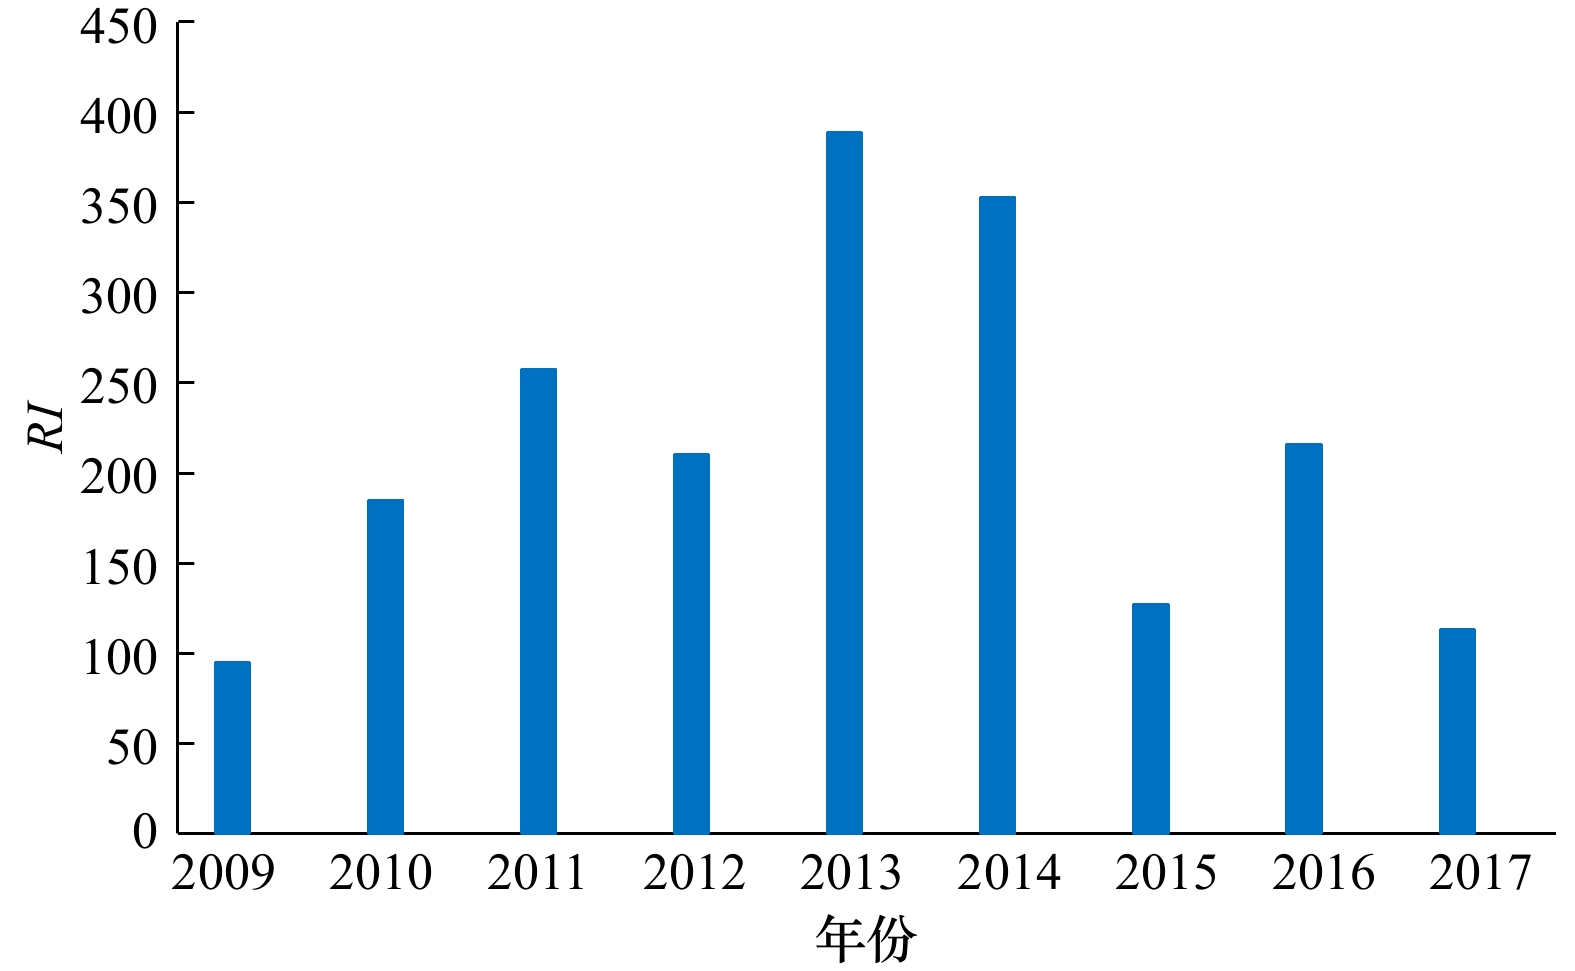
图 5 重金属的综合潜在风险指数RI年际变化
Fig. 5 Inter-annual variation of comprehensive potential risk index RI of heavy metals
表 1 重金属元素含量测试值与标准值对比
Tab. 1 Comparison of test value and standard value of heavy metal contents
Cu Pb Zn Cd Cr As Hg 测定值/
(μg·g−1)相对
偏差/%测定值/
(μg·g−1)相对
偏差/%测定值/
(μg·g−1)相对
偏差/%测定值/
(μg·g−1)相对
偏差/%测定值/
(μg·g−1)相对
偏差/%测定值/
(μg·g−1)相对
偏差/%测定值/
(μg·g−1)相对
偏差/%GBW07314
标准值(31.0±4.0) μg/g (25.0±4.0) μg/g (87.0±2.0) μg/g (0.20±0.04) μg/g (86.0±4.0) μg/g (10.3±1.4) μg/g (0.048±0.012) μg/g 2009年 30.8 0.6 24.4 2.4 88.4 1.6 0.19 5.0 87.7 2.0 10.20 1.0 0.051 6.2 2010年 31.5 1.6 25.2 0.8 87.5 0.6 0.21 5.0 86.4 0.5 10.46 1.6 0.049 2.1 2011年 31.5 1.6 25.1 0.4 86.4 0.7 0.17 15.0 88.1 2.4 10.34 0.4 0.043 10.4 2012年 28.9 6.8 23.3 6.8 86.8 0.2 0.19 5.0 85.5 0.6 10.18 1.2 0.050 4.2 2013年 31.4 1.3 24 4.0 88.6 1.8 0.19 5.0 87.7 2.0 10.57 2.6 0.043 10.4 2014年 31.3 1.0 25.6 2.4 88.5 1.7 0.22 10.0 87.7 2.0 10.67 3.6 0.054 12.5 2015年 29.9 3.5 24.8 0.8 87.4 0.5 0.17 15.0 83.0 3.5 10.15 1.5 0.042 12.5 2016年 29.9 3.5 24.7 1.2 90.1 3.6 0.20 0 85.6 0.5 10.76 4.5 0.051 6.2 2017年 29.8 3.9 24.9 0.4 86.7 0.3 0.19 5.0 86.5 0.6 11.08 7.6 0.054 12.5 检出限 0.5 1.0 6.0 0.04 2.0 0.06 0.002  下载: 导出CSV
Cu Pb Zn Cd Cr As Hg Tri 5 5 1 30 2 10 40
下载: 导出CSV
表 3 潜在生态风险指数法的污染评价等级划分
Tab. 3 Pollution level classification of potential ecological risk index
${E_r}^i $范围 单个重金属污染物
生态风险程度分级RI范围 综合潜在生态
风险程度分级${E_r}^i $<40 低 RI<130 低 40≤${E_r}^i $<80 中 130≤RI<260 中 80≤${E_r}^i $<160 较高 260≤RI<520 较高 160≤${E_r}^i $<320 高 RI≥520 高 ${E_r}^i $≥320 很高
下载: 导出CSV
表 4 永兴岛周边海域表层沉积物中重金属含量的背景值(单位:μg/g)
Tab. 4 Background values of heavy metals contents in the surface sediments of Yongxing Island and its surrounding sea area(unit: μg/g)
项目 Zn Cd Pb Cu Cr As Hg 样品数 6 6 6 6 6 6 6 测值范围 9.1~15.5 未检出~0.04 5.9~9.2 0.7~1.1 4.8~7.3 0.78~1.51 0.006~0.009 算术平均值 11.0 0.03 8.1 0.9 6.5 1.02 0.008 算术标准差 2.4 0.01 1.2 0.1 1.0 0.29 0.001 平均背景值 11.0 0.03 8.1 0.9 6.5 1.02 0.008 背景值范围 8.5~13.4 0.02~0.04 6.9~9.3 0.7~1.0 5.4~7.5 0.73~1.32 0.006~0.009 南海陆架区沉积物背景值[21] 54.4 0.18 15.6 7.43 39.3 9.71 0.020 中国浅海沉积物背景值[22] 65 0.065 20 15 60 7.7 0.025 南海北部陆架区沉积物背景值[23] 16.9 0.79 23.0 9.0 25.5 − − 南海深海区沉积物背景值[24] 149.0 0.21 22.4 54.1 69.3 7.24 0.089 注:−代表无此结果。
下载: 导出CSV
表 5 2009−2017年永兴岛附近海域表层沉积物重金属含量(单位:μg/g)
Tab. 5 Contents of heavy metals in the surface sediments of Yongxing Island and its surrounding sea area from 2009 to 2017(unit: μg/g)
项目 Zn Cd Pb Cu Cr As Hg 2009年 范围 9.1~15.5 未检出~0.04 5.9~9.2 0.7~1.1 4.8~7.3 0.78~1.51 0.006~0.009 平均值 11.0 0.03 8.1 0.9 6.5 1.02 0.008 变异系数 0.2 0.3 0.1 0.2 0.5 0.3 0.2 2010年 范围 9.5~ 14.2 未检出~ 0.11 10.4~ 32.9 0.6~ 2.5 未检出~ 9.3 1.64~ 3.33 0.010~ 0.020 平均值 11.7 0.06 21.0 1.6 5.8 2.45 0.015 变异系数 0.2 0.6 0.5 0.4 0.5 0.3 0.3 2011年 范围 未检出~14.4 未检出~ 0.28 4.6~ 29.3 1.5~ 4.5 2.4~ 6.7 2.59~ 3.58 0.002~ 0.033 平均值 10.6 0.16 15.7 2.5 4.3 3.06 0.008 变异系数 0.4 0.7 0.7 0.4 0.4 0.1 1.5 2012年 范围 未检出~ 128.3 0.05~0.32 3.1~ 27.6 1.4~ 8.8 3.1~ 12.9 1.11~ 2.57 0.004~ 0.016 平均值 33.7 0.12 12.1 4.1 6.5 1.87 0.007 变异系数 1.4 0.8 0.7 0.7 0.6 0.4 0.7 2013年 范围 16.6~ 25.5 0.12~ 0.44 3.5~ 8.0 1.0~ 5.8 3.6~ 40.0 2.06~ 10.32 0.008~ 0.015 平均值 19.5 0.25 5.8 3.3 22.6 5.42 0.011 变异系数 0.2 0.6 0.3 0.5 0.7 0.6 0.3 2014年 范围 未检出~ 6.1 0.12~ 0.20 5.4~ 13.9 未检出~ 2.6 4.2~ 10.1 2.70~ 4.27 0.024~ 0.035 平均值 2.3 0.15 8.9 1.6 6.7 3.62 0.030 变异系数 0.8 0.2 0.4 0.5 0.3 0.2 0.1 2015年 范围 22.9~ 29.3 未检出~ 0.15 3.2~ 24.8 1.6~ 3.5 未检出~ 4.1 0.20~ 0.78 0.002~ 0.009 平均值 26.1 0.08 13.8 2.3 1.5 0.42 0.004 变异系数 0.1 0.7 0.7 0.3 1.1 0.5 0.6 2016年 范围 10.1~ 35.6 0.04~ 0.07 23.7~ 52.4 0.8~ 3.6 未检出 2.88~ 4.55 0.015~ 0.020 平均值 22.9 0.06 42.8 1.5 0.5 3.60 0.018 变异系数 0.6 0.2 0.3 0.8 0.0 0.2 0.1 2017年 范围 6.2~ 10.9 未检出~ 0.06 14.9~ 38.6 0.5~ 1.2 未检出~ 2.2 1.27~ 2.90 0.004~ 0.011 平均值 8.5 0.03 26.1 0.9 0.8 1.89 0.008 变异系数 0.2 0.5 0.3 0.3 0.9 0.3 0.3 多年变化范围 未检出~ 128.3 未检出~0.44 3.1~52.4 未检出~8.8 未检出 ~40.0 0.20~10.32 0.002~0.035 多年平均值 16.2 0.11 17.1 2.1 6.1 2.59 0.012 《海洋沉积物质量》第一类标准值[25] 150.0 0.50 60.0 35.0 80.0 20.0 0.20 中国浅海沉积物
元素丰度[21−22]65 0.065 15 20 60 7.7 0.025
下载: 导出CSV
表 6 2009−2017年永兴岛附近海域表层沉积物重金属潜在生态危害风险指标
Tab. 6 The risk index of potential ecological risk of heavy metals in the surface sediments of Yongxing Island and its surrounding sea area from 2009 to 2017
年份 Eri RI Zn Cd Pb Cu Cr As Hg 2009 最小值 0.83 20.00 3.64 3.89 1.48 7.65 30.00 71.36 最大值 1.41 40.00 5.68 6.11 2.25 14.80 45.00 106.85 平均值 1.00 33.33 5.01 4.91 1.99 10.02 38.33 94.59 2010 最小值 0.86 20.00 6.42 3.33 0.31 16.05 50.00 130.10 最大值 1.29 110.00 20.31 13.89 2.86 32.65 100.00 266.41 平均值 1.06 61.67 12.97 8.98 1.78 24.04 74.17 184.67 2011 最小值 0.27 20.00 2.84 8.33 0.74 25.39 10.00 86.12 最大值 1.31 280.00 18.09 25.00 2.06 35.10 165.00 353.65 平均值 0.96 160.00 9.67 13.98 1.33 29.97 41.25 257.17 2012 最小值 0.27 50.00 1.91 7.78 0.95 10.88 17.50 107.24 最大值 11.66 320.00 17.04 48.89 3.97 25.20 80.00 441.13 平均值 3.07 123.33 7.48 22.59 2.01 18.33 33.33 210.15 2013 最小值 1.51 120.00 2.16 5.56 1.11 20.20 40.00 264.70 最大值 2.32 440.00 4.94 32.22 12.31 101.18 75.00 549.72 平均值 1.77 251.67 3.60 18.33 6.96 53.12 53.33 388.78 2014 最小值 0.14 120.00 3.33 1.39 1.29 26.47 120.00 315.24 最大值 0.55 200.00 8.58 14.44 3.11 41.86 175.00 396.07 平均值 0.21 151.67 5.50 9.12 2.05 35.47 148.33 352.36 2015 最小值 2.08 20.00 1.98 8.89 0.15 1.96 10.00 51.56 最大值 2.66 150.00 15.31 19.44 1.26 7.65 45.00 230.70 平均值 2.37 78.33 8.52 12.87 0.45 4.10 20.00 126.64 2016 最小值 0.92 42.68 14.61 4.36 0.15 28.24 75.00 201.20 最大值 3.24 72.49 32.35 20.14 0.15 44.61 97.50 232.85 平均值 2.08 55.42 26.39 8.11 0.15 35.32 87.92 215.40 2017年 最小值 0.57 20.00 9.17 2.63 0.15 12.45 20.00 81.43 最大值 0.99 55.91 23.84 6.41 0.69 28.43 55.00 130.12 平均值 0.78 33.92 16.12 4.90 0.24 18.55 38.33 112.84 多年变化 最小值 0.14 20.00 1.91 1.39 0.15 1.96 10.00 51.56 最大值 2.08 120.00 14.61 8.89 1.48 28.24 120.00 315.24 平均值 1.48 105.48 10.59 11.53 1.89 25.44 59.44 215.84
下载: 导出CSV
-
[1] 樊邦棠. 环境化学[M]. 杭州: 浙江大学出版社, 1991.Fan Bangtang. Environmental Chemistry[M]. Hangzhou: Zhejiang University Press, 1991. [2] Díaz-de Alba M, Galindo-Riaño M D, Casanueva-Marenco M J, et al. Assessment of the metal pollution, potential toxicity and speciation of sediment from Algeciras Bay (South of Spain) using chemometric tools[J]. Journal of Hazardous Materials, 2011, 190(1/3): 177−187. [3] 周静, 杨东, 彭子成, 等. 西沙海域海水中溶解态重金属的含量及其影响因子[J]. 中国科学技术大学学报, 2007, 37(8): 1036−1042. doi: 10.3969/j.issn.0253-2778.2007.08.032Zhou Jing, Yang Dong, Peng Zicheng, et al. The concentrations of dissolved heavy metals in Xisha waters and their influential factors[J]. Journal of University of Science and Technology of China, 2007, 37(8): 1036−1042. doi: 10.3969/j.issn.0253-2778.2007.08.032 [4] 彭加喜, 刘金铃, 徐向荣, 等. 西沙永兴岛珊瑚重金属水平及其富集效应[J]. 海洋环境科学, 2014, 33(6): 848−853.Peng Jiaxi, Liu Jinling, Xu Xiangrong, et al. Heavy metal levels in coral skeletons from Yongxing Island and their enrichment effects[J]. Marine Environmental Science, 2014, 33(6): 848−853. [5] 王璐. 南海中、西沙群岛珊瑚礁区的重金属分布特征及其生态影响评估[D]. 南宁: 广西大学, 2018.Wang Lu. Spatial distribution and ecological risk assessment of heavy metals in coral reefs of Zhongsha and Xisha Island, South China Sea[D]. Nanning: Guangxi University, 2018. [6] 孙万龙, 田兆雪, 刘雪华. 西沙永兴岛不同功能区环境质量状况研究[J]. 环境科学与技术, 2019, 42(S2): 280−285.Sun Wanlong, Tian Zhaoxue, Liu Xuehua. Study on environmental quality in different functional areas of Yongxing Island, Xisha[J]. Environmental Science and Technology, 2019, 42(S2): 280−285. [7] 国家海洋局. HY/T 132−2010, 海洋沉积物与海洋生物体中重金属分析前处理 微波消解法[S]. 北京: 中国标准出版社, 2010.State Oceanic Administration. HY/T 132−2010, Pretreatment guideline of heavy metals analysis in the marine sediments and organisms-microwave assisted acid digestion[S]. Beijing: Standards Press of China, 2010. [8] 中华人民共和国国家质量监督检验检疫总局, 中国国家标准化管理委员会. GB 17378.5−2007, 海洋监测规范 第5部分: 沉积物分析[S]. 北京: 中国标准出版社, 2008.General Administration of Quality Supervision, Inspection and Quarantine of the People’s Republic of China, Standardization Administration of the People’s Republic of China. GB 17378.5−2007, The specification for marine monitoring—Part 5: Sediment analysis[S]. Beijing: Standards Press of China, 2008. [9] 中华人民共和国国家质量监督检验检疫总局, 中国国家标准化管理委员会. GB/T 12763.1−2007, 海洋调查规范 第1部分: 总则[S]. 北京: 中国标准出版社, 2008.General Administration of Quality Supervision, Inspection and Quarantine of the People’s Republic of China, Standardization Administration of the People’s Republic of China. GB/T 12763.1−2007, Specifications for oceanographic survey—Part 1: General[S]. Beijing: Standards Press of China, 2008. [10] 鲍永恩, 刘娟. 葫芦山湾沉积物中重金属集散特征及环境背景值[J]. 海洋环境科学, 1995, 14(1): 1−8.Bao Yongen, Liu Juan. The feature of concentration and dispersion of the heavy metals and the environmental background values in the sediments of Liaoning Hulushan bay[J]. Marine Environmental Science, 1995, 14(1): 1−8. [11] Hakanson L. An ecological risk index for aquatic pollution control: A sedimentological approach[J]. Water Research, 1980, 14(8): 975−1001. doi: 10.1016/0043-1354(80)90143-8 [12] 唐银健. Hakanson指数法评价水体沉积物重金属生态风险的应用进展[J]. 环境科学导刊, 2008, 27(3): 66−68, 72. doi: 10.3969/j.issn.1673-9655.2008.03.021Tang Yinjian. Application of Hakanson index method assessing ecological risk of heavy metal from sediments in the water[J]. Environmental Science Survey, 2008, 27(3): 66−68, 72. doi: 10.3969/j.issn.1673-9655.2008.03.021 [13] 徐争启, 倪师军, 庹先国, 等. 潜在生态危害指数法评价中重金属毒性系数计算[J]. 环境科学与技术, 2008, 31(2): 112−115. doi: 10.3969/j.issn.1003-6504.2008.02.030Xu Zhengqi, Ni Shijun, Tuo Xianguo, et al. Calculation of heavy metals’ toxicity coefficient in the evaluation of potential ecological risk index[J]. Environmental Science and Technology, 2008, 31(2): 112−115. doi: 10.3969/j.issn.1003-6504.2008.02.030 [14] 阳杰, 曹玲珑, 姜万钧, 等. 洋浦港近岸海域沉积物中重金属含量分布特征及污染评价[J]. 海洋湖沼通报, 2012(4): 121−128.Yang Jie, Cao Linglong, Jiang Wanjun, et al. Distribution and evaluation of heavy metal pollutions for surface sediments near Yangpu port[J]. Transactions of Oceanology and Limnology, 2012(4): 121−128. [15] 马德毅, 王菊英. 中国主要河口沉积物污染及潜在生态风险评价[J]. 中国环境科学, 2003, 23(5): 521−525. doi: 10.3321/j.issn:1000-6923.2003.05.016Ma Deyi, Wang Juying. Evaluation on potential ecological risk of sediment pollution in main estuaries of China[J]. China Environmental Science, 2003, 23(5): 521−525. doi: 10.3321/j.issn:1000-6923.2003.05.016 [16] 陈亮, 李团结, 杨文丰, 等. 南海北部近海沉积物重金属分布及来源[J]. 生态环境学报, 2016, 25(3): 464−470.Chen Liang, Li Tuanjie, Yang Wenfeng, et al. Distribution and sources of heavy metals in surface sediments, northern South China Sea[J]. Ecology and Environment Sciences, 2016, 25(3): 464−470. [17] 刘成, 王兆印, 何耘, 等. 环渤海湾诸河口潜在生态风险评价[J]. 环境科学研究, 2002, 15(5): 33−37. doi: 10.3321/j.issn:1001-6929.2002.05.009Liu Cheng, Wang Zhaoyin, He Yun, et al. Evaluation on the potential ecological risk for the river mouths around Bohai Bay[J]. Research of Environmental Sciences, 2002, 15(5): 33−37. doi: 10.3321/j.issn:1001-6929.2002.05.009 [18] 陈泓君, 蔡观强, 崔兆国, 等. 南海西北部表层沉积物重金属分布特征与污染评价[J]. 海洋地质前沿, 2013, 29(1): 43−50.Chen Hongjun, Cai Guanqiang, Cui Zhaoguo, et al. Distribution of heavy metals in surface sediments of northwestern South China Sea and pollution assessment[J]. Marine Geology Frontiers, 2013, 29(1): 43−50. [19] 余克服, 宋朝景, 赵焕庭. 西沙群岛永兴岛地貌与现代沉积特征[J]. 热带海洋, 1995, 14(2): 24−31.Yu Kefu, Song Chaojing, Zhao Huanting. The characters of geomorphology and modern sediments of Yongxing Island, Xisha Islands[J]. Tropic Oceanology, 1995, 14(2): 24−31. [20] 沈建伟, 杨红强, 王月, 等. 西沙永兴岛珊瑚礁坪的群落动态和浅水碳酸盐沉积特征[J]. 中国科学: 地球科学, 2013, 56(9): 1471−1486. doi: 10.1007/s11430-013-4677-3Shen Jianwei, Yang Hongqiang, Wang Yue, et al. Coral community dynamics and shallow-water carbonate deposition of the reef-flat around Yongxing Island, the Xisha Islands[J]. Science China Earth Sciences, 2013, 56(9): 1471−1486. doi: 10.1007/s11430-013-4677-3 [21] 张远辉, 杜俊民. 南海表层沉积物中主要污染物的环境背景值[J]. 海洋学报, 2005, 27(4): 161−166.Zhang Yuanhui, Du Junmin. Background values of pollutants in sediments of the South China Sea[J]. Haiyang Xuebao, 2005, 27(4): 161−166. [22] 赵一阳, 鄢明才. 中国浅海沉积物地球化学[M]. 北京: 科学出版社, 1994.Zhao Yiyang, Yan Mingcai. Geochemistry of Sediments of the China Shelf Sea[M]. Beijing: Science Press, 1994. [23] 甘居利, 贾晓平, 李纯厚, 等. 南海北部陆架区表层沉积物中重金属分布和污染状况[J]. 热带海洋学报, 2003, 22(1): 36−42. doi: 10.3969/j.issn.1009-5470.2003.01.006Gan Juli, Jia Xiaoping, Li Chunhou, et al. Characteristics of distribution and pollution of heavy metals in surfacial sediments from continental shelf of northern South China Sea[J]. Journal of Tropical Oceanography, 2003, 22(1): 36−42. doi: 10.3969/j.issn.1009-5470.2003.01.006 [24] 李粹中. 南海深海沉积物微量元素的地球化学特征[J]. 中国科学(B辑), 1985(6): 571−578.Li Cuizhong. Geochemical characteristics of trace elements in deep-sea sediments of the South China Sea[J]. Science China (Part B), 1985(6): 571−578. [25] 中华人民共和国国家质量监督检验检疫总局. GB 18668−2002, 海洋沉积物质量[S]. 北京: 中国标准出版社, 2004.General Administration of Quality Supervision, Inspection and Quarantine of the People’s Republic of China. GB18668−2002, Marine sediment quality[S]. Beijing: Standards Press of China, 2004. [26] 李雪瑞, 王娜, 田松. 永兴岛及周边海域1989−2014年生态环境质量评价[J]. 海洋通报, 2019, 38(4): 470−480.Li Xuerui, Wang Na, Tian Song. Eco-environmental quality evaluation of the Yongxing Island and its surrounding sea area from 1989 to 2014[J]. Marine Science Bulletin, 2019, 38(4): 470−480. [27] Li Xiangdong, Wai O W H, Li Y S, et al. Heavy metal distribution in sediment profiles of the Pearl River estuary, South China[J]. Applied Geochemistry, 2000, 15(5): 567−581. doi: 10.1016/S0883-2927(99)00072-4 [28] 刘明, 范德江, 郑世雯, 等. 渤海中部沉积物铅来源的同位素示踪[J]. 海洋学报, 2016, 38(2): 36−47.Liu Ming, Fan Dejiang, Zheng Shiwen, et al. Tracking lead origins in the central Bohai Sea based on stable lead isotope composition[J]. Haiyang Xuebao, 2016, 38(2): 36−47. -


计量
- 文章访问数: 596
- HTML全文浏览量: 219
- PDF下载量: 81
- 被引次数: 0
