

Experimental study on vertical distribution of rip current
-
摘要: 通过物理模型实验给出了沙坝海岸丁坝附近交叉波浪场形成的裂流沿裂流槽水深平均速度剖面中心线的垂向分布,研究了各个测量断面上横向速度、纵向速度以及速度矢量沿水深的分布特征。研究分析了沿岸方向驻波节腹点和裂流槽相对位置的影响以及规则波和不规则波结果的差异,得到了裂流速度时均值和时变值的结果。结果表明,纵向速度在不同的时间段上的平均值基本是相同的,但横向速度不是这样,其在不同时间段上的平均值在大小和正负号上都可能存在较大差别,这导致整个速度矢量在不同时间段上也表现出不同的三维分布特征。但这些不同的分布也存在着共同点,即沿水深速度矢量大部分存在着向丁坝方向偏转,这反映了丁坝存在的影响。特别是,纵向速度沿水深分布都可以采用统一的幂函数表达。Abstract: The vertical distribution of rip current formed by the cross wave field near a groin is studied through the physical model experiment with regular and irregular waves and the characteristics of the distribution for transverse, longitudinal velocities and velocity vector at each measurement section are examined. The measurement is along the center line of the depth-average velocity profile in the rip channel. The influence of the position of the node and antinode point relative to the channel centerline is considered. The results of time-average and time-dependent values of rip curent velocity are analysed, and it is found that the longitudinal velocity has stable mean values for different lengths of time spans considered, but this is not the case for the transverse velocity. Due to the effect of rip current instablity, the latter has different mean values for different lengths time spans. This leads to different three-dimensional distribution characteristics of velocity vector over different time spans. However, there are some common points among the results of the different time spans, this includes, most of the velocity vectors at measurement sections deflect towards the groin, which reflects the influence of the groin; the vertical distribution of longitudinal velocity at different measurement sections all follow the power law.
-
Key words:
- rip current /
- vertical distribution /
- sandbar coast /
- rip channel
-
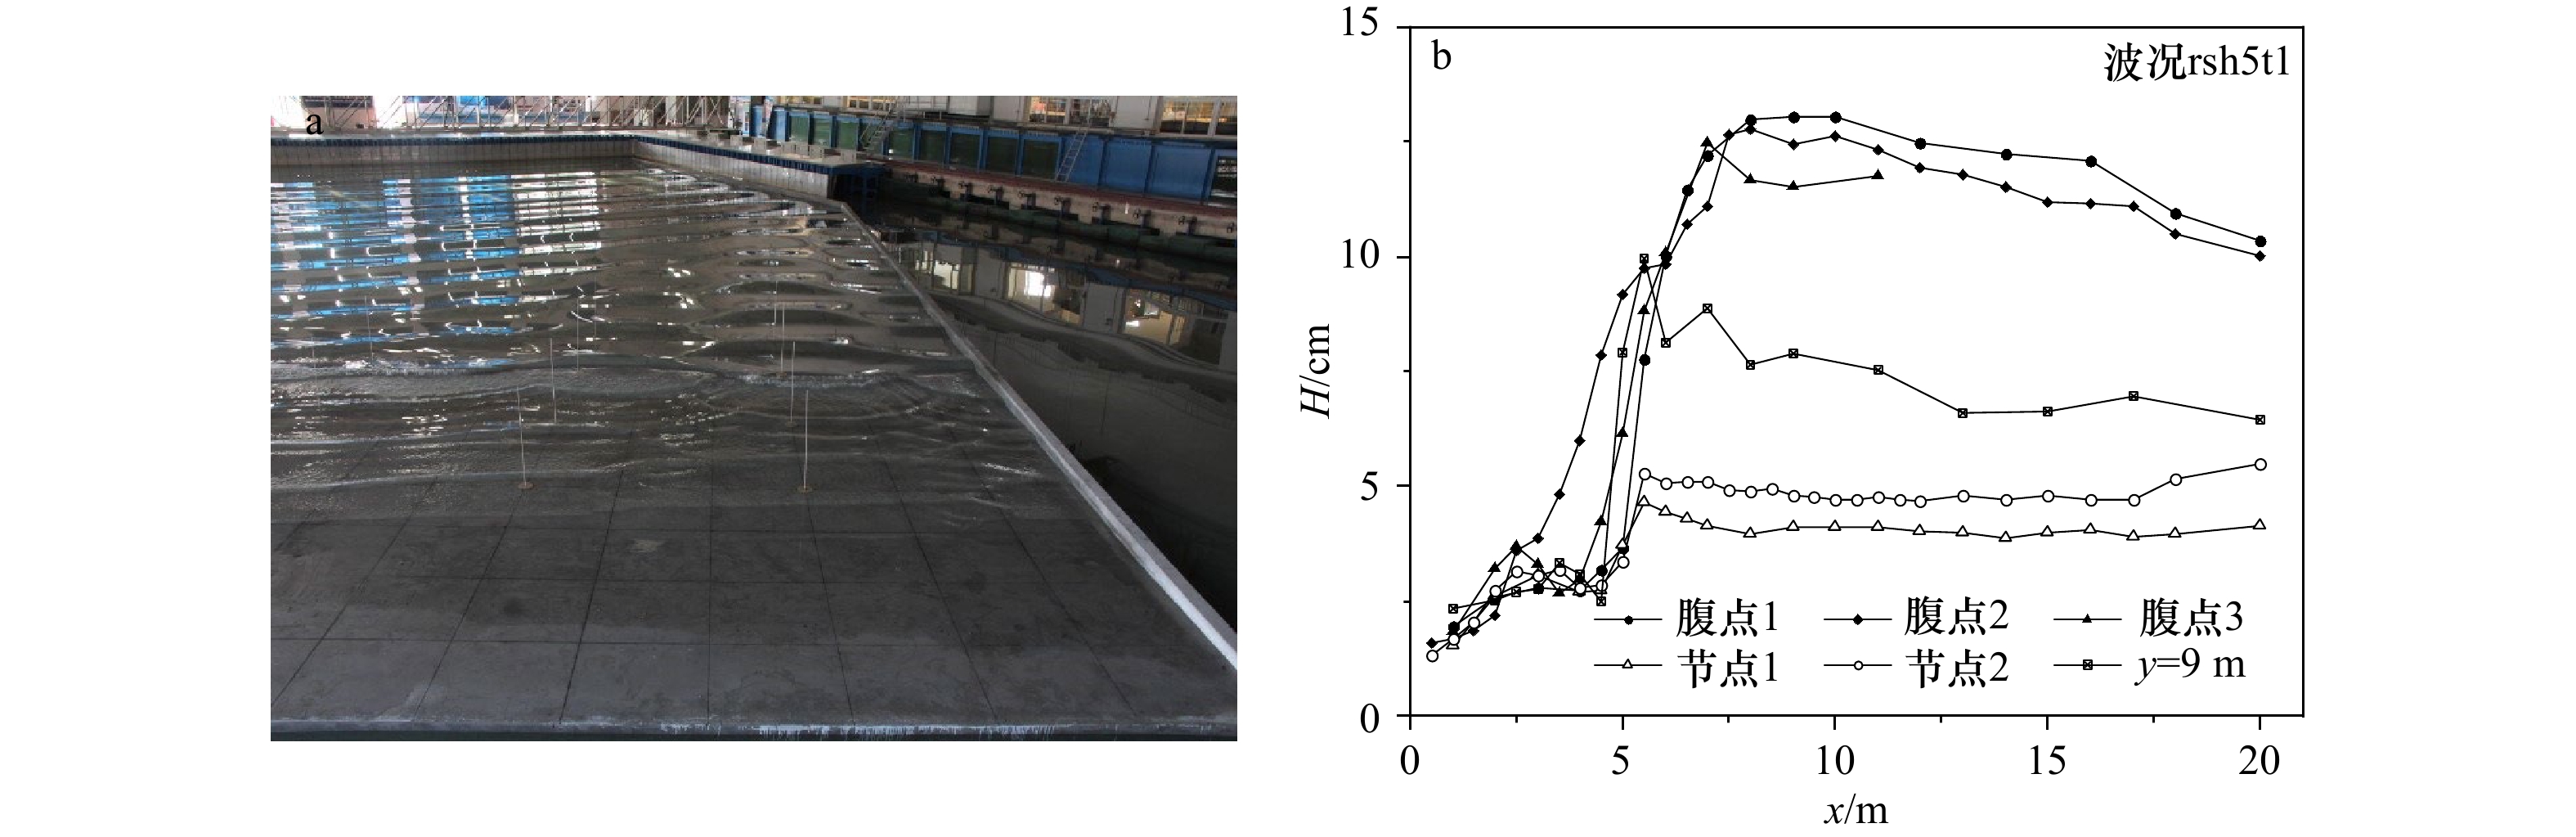
图 2 实验波浪场照片(a)和沿节腹点波高测量结果(b)
Fig. 2 Photo of experimental wave field (a) and the cross-shore wave height variation along node and anti-node lines (b)
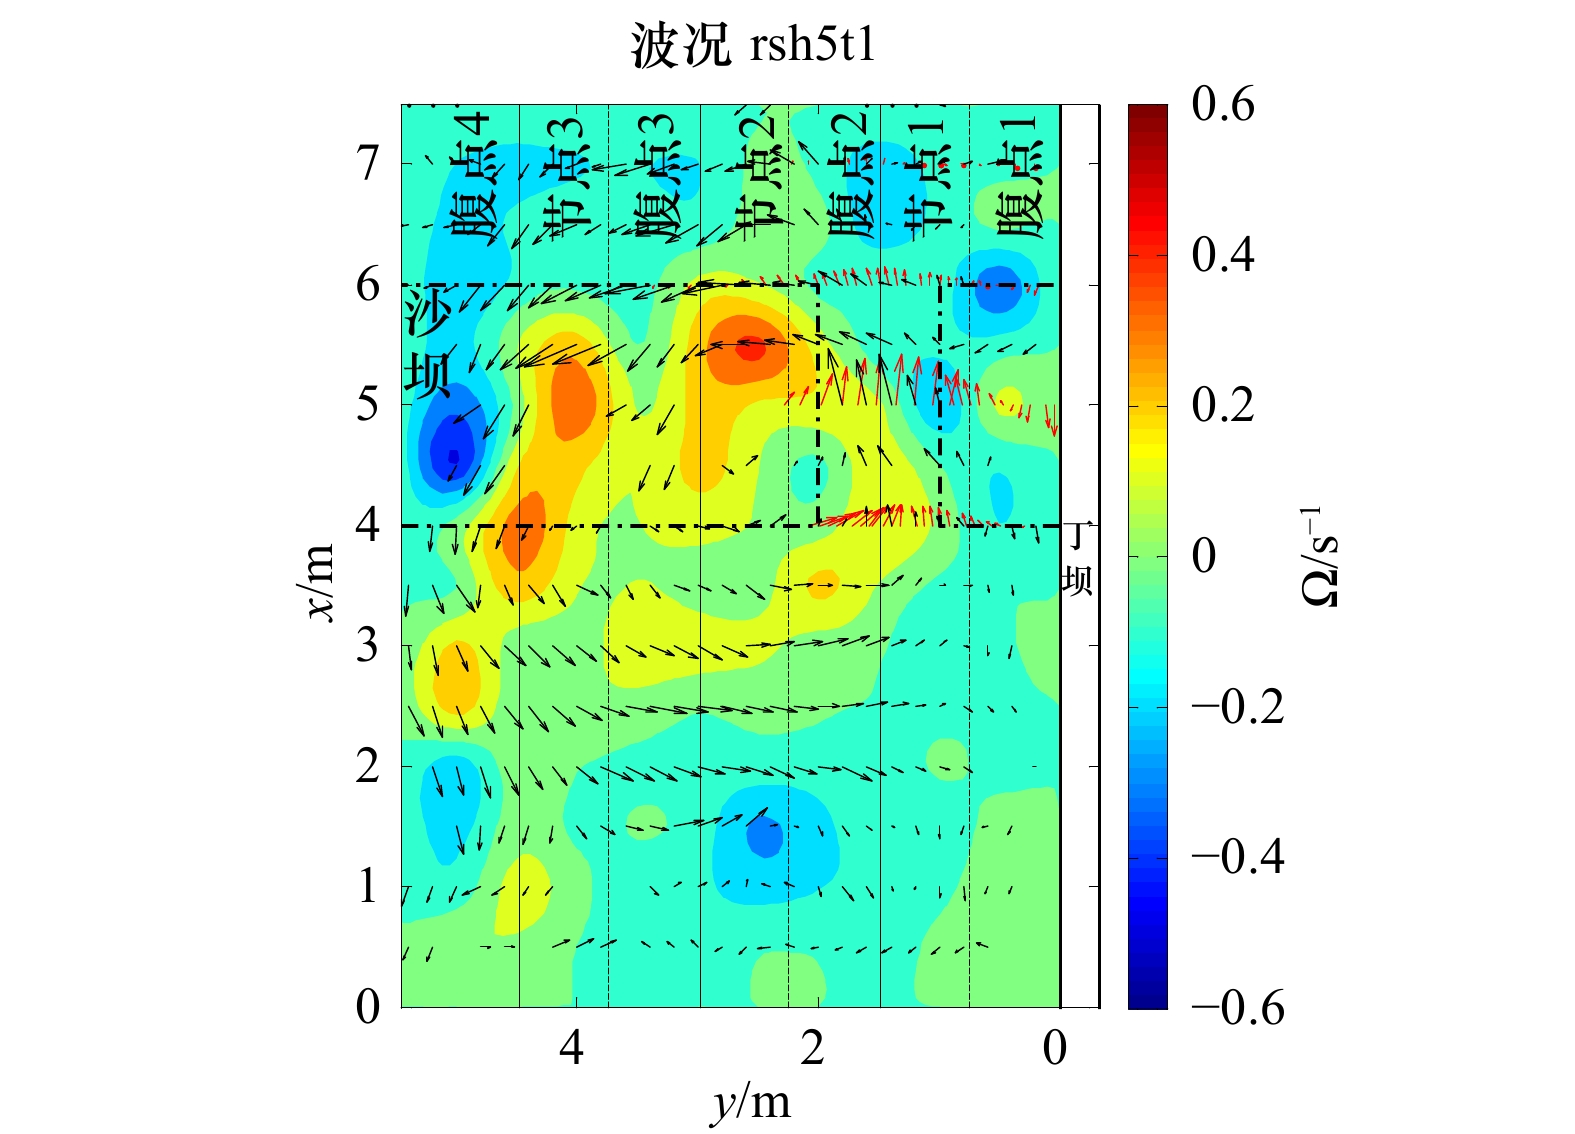
图 4 浮子示踪得到的流场矢量与对应的涡量分布
黑色矢量为浮子测量的水面处速度;红色矢量为流速仪测量的水深平均速度;彩色色差为涡量强度
Fig. 4 The flow field vector and corresponding vorticity distribution obtained by float tracing
Black vectors represent the water surface velocity measured by the float; red vectors represent the depth-average velocity measured by the acoustic droppler velocimeters; color differences represent vorticity intensity
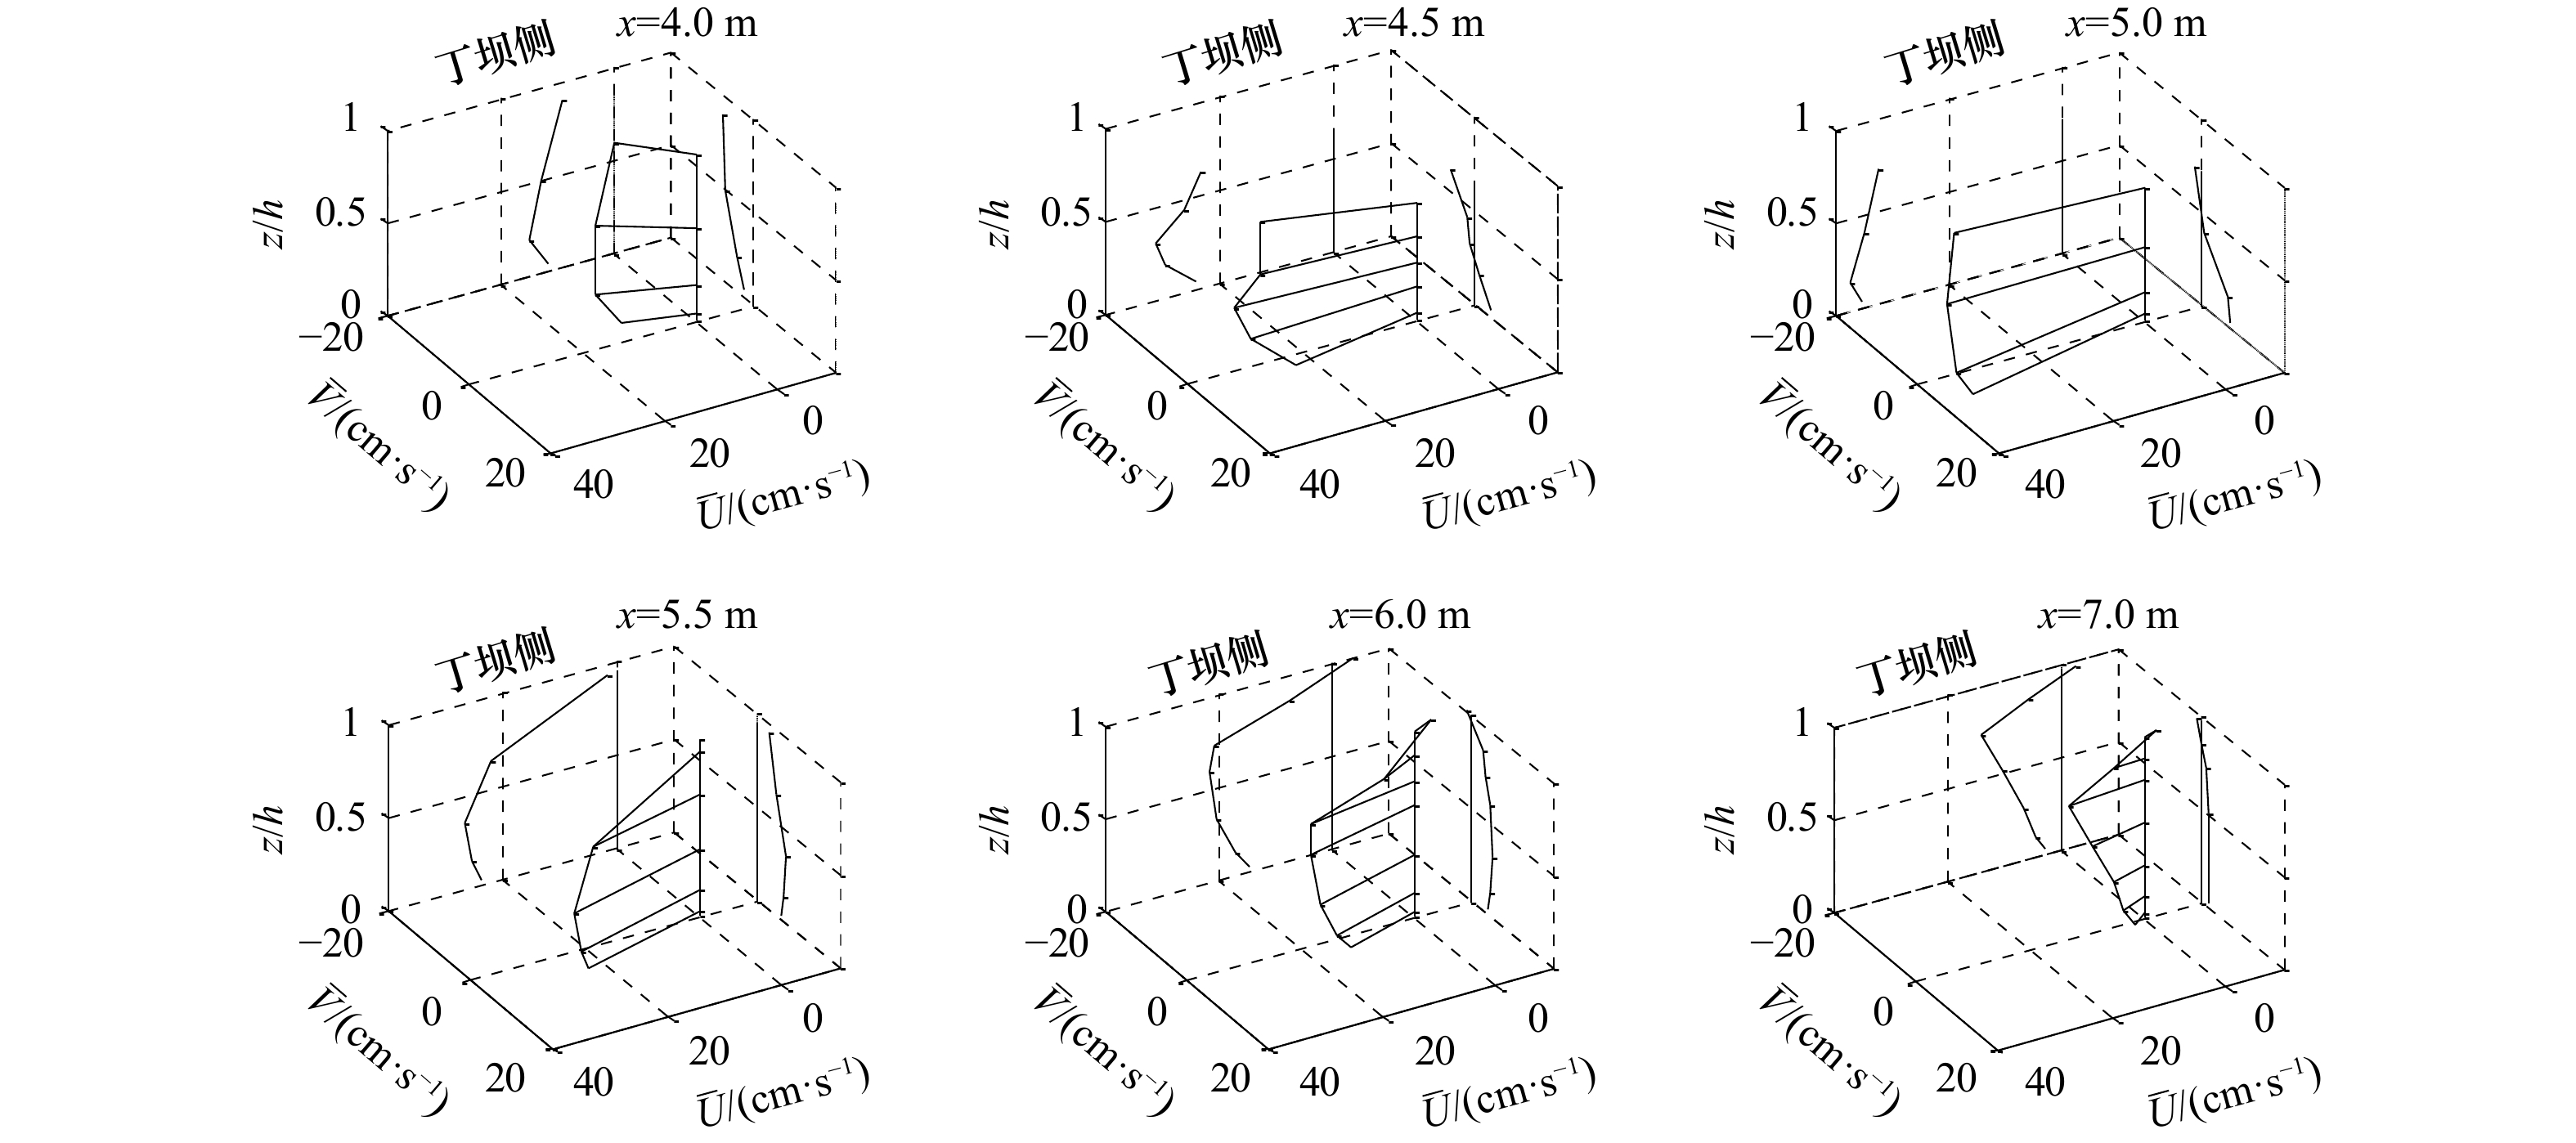
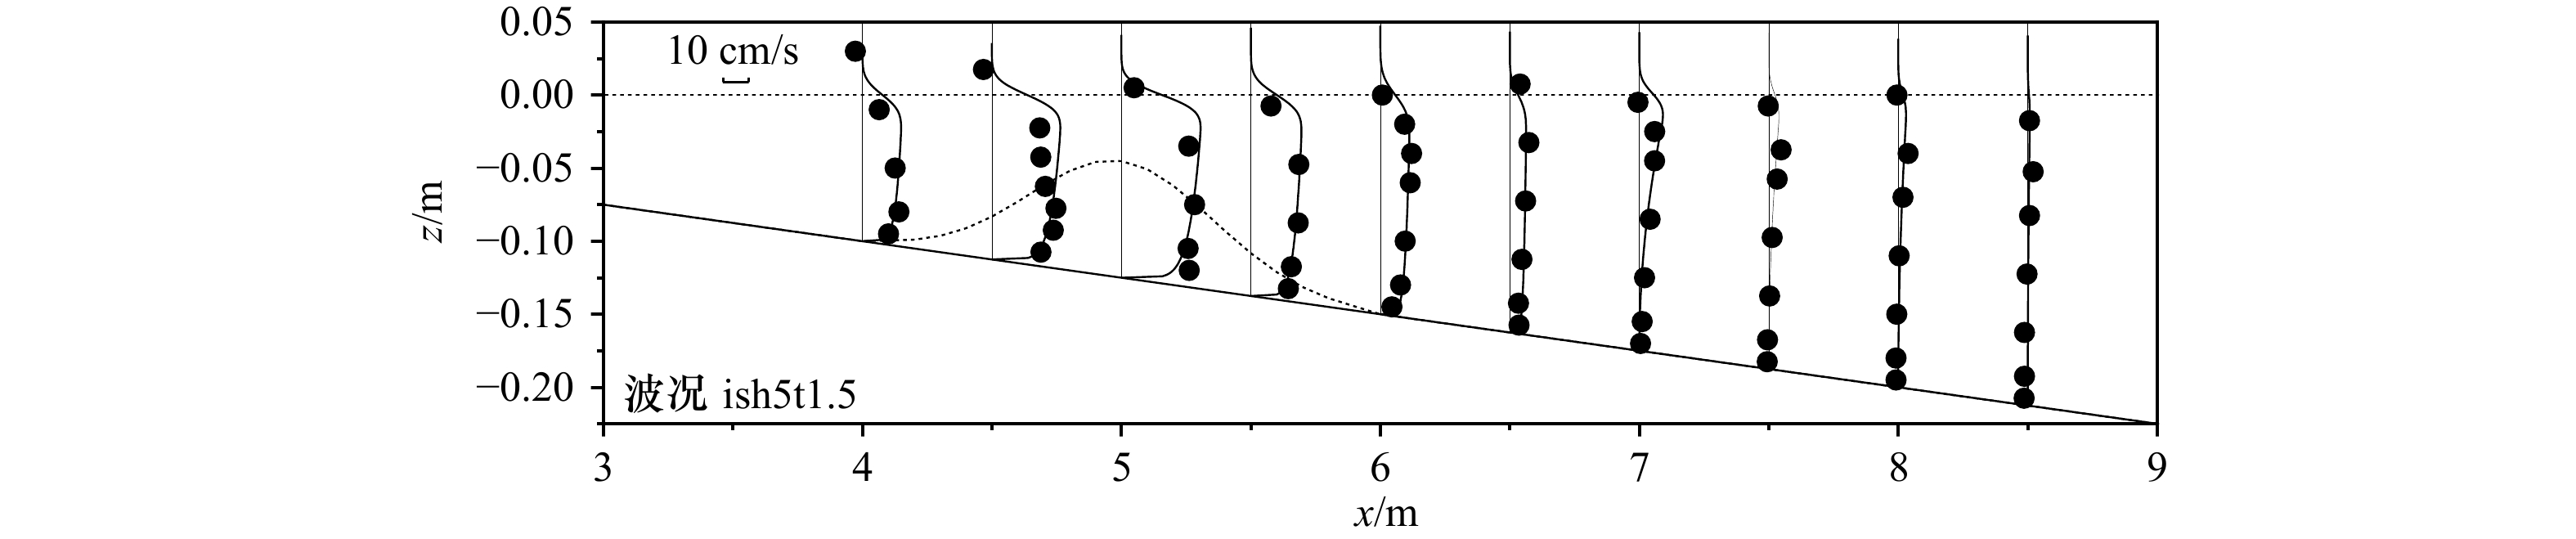
图 5 裂流速度垂向分布矢量(波况rsh5t1,t=100~900 s)
Fig. 5 Vertical distribution of rip current vertical vector (case rsh5t1, t=100−900 s)
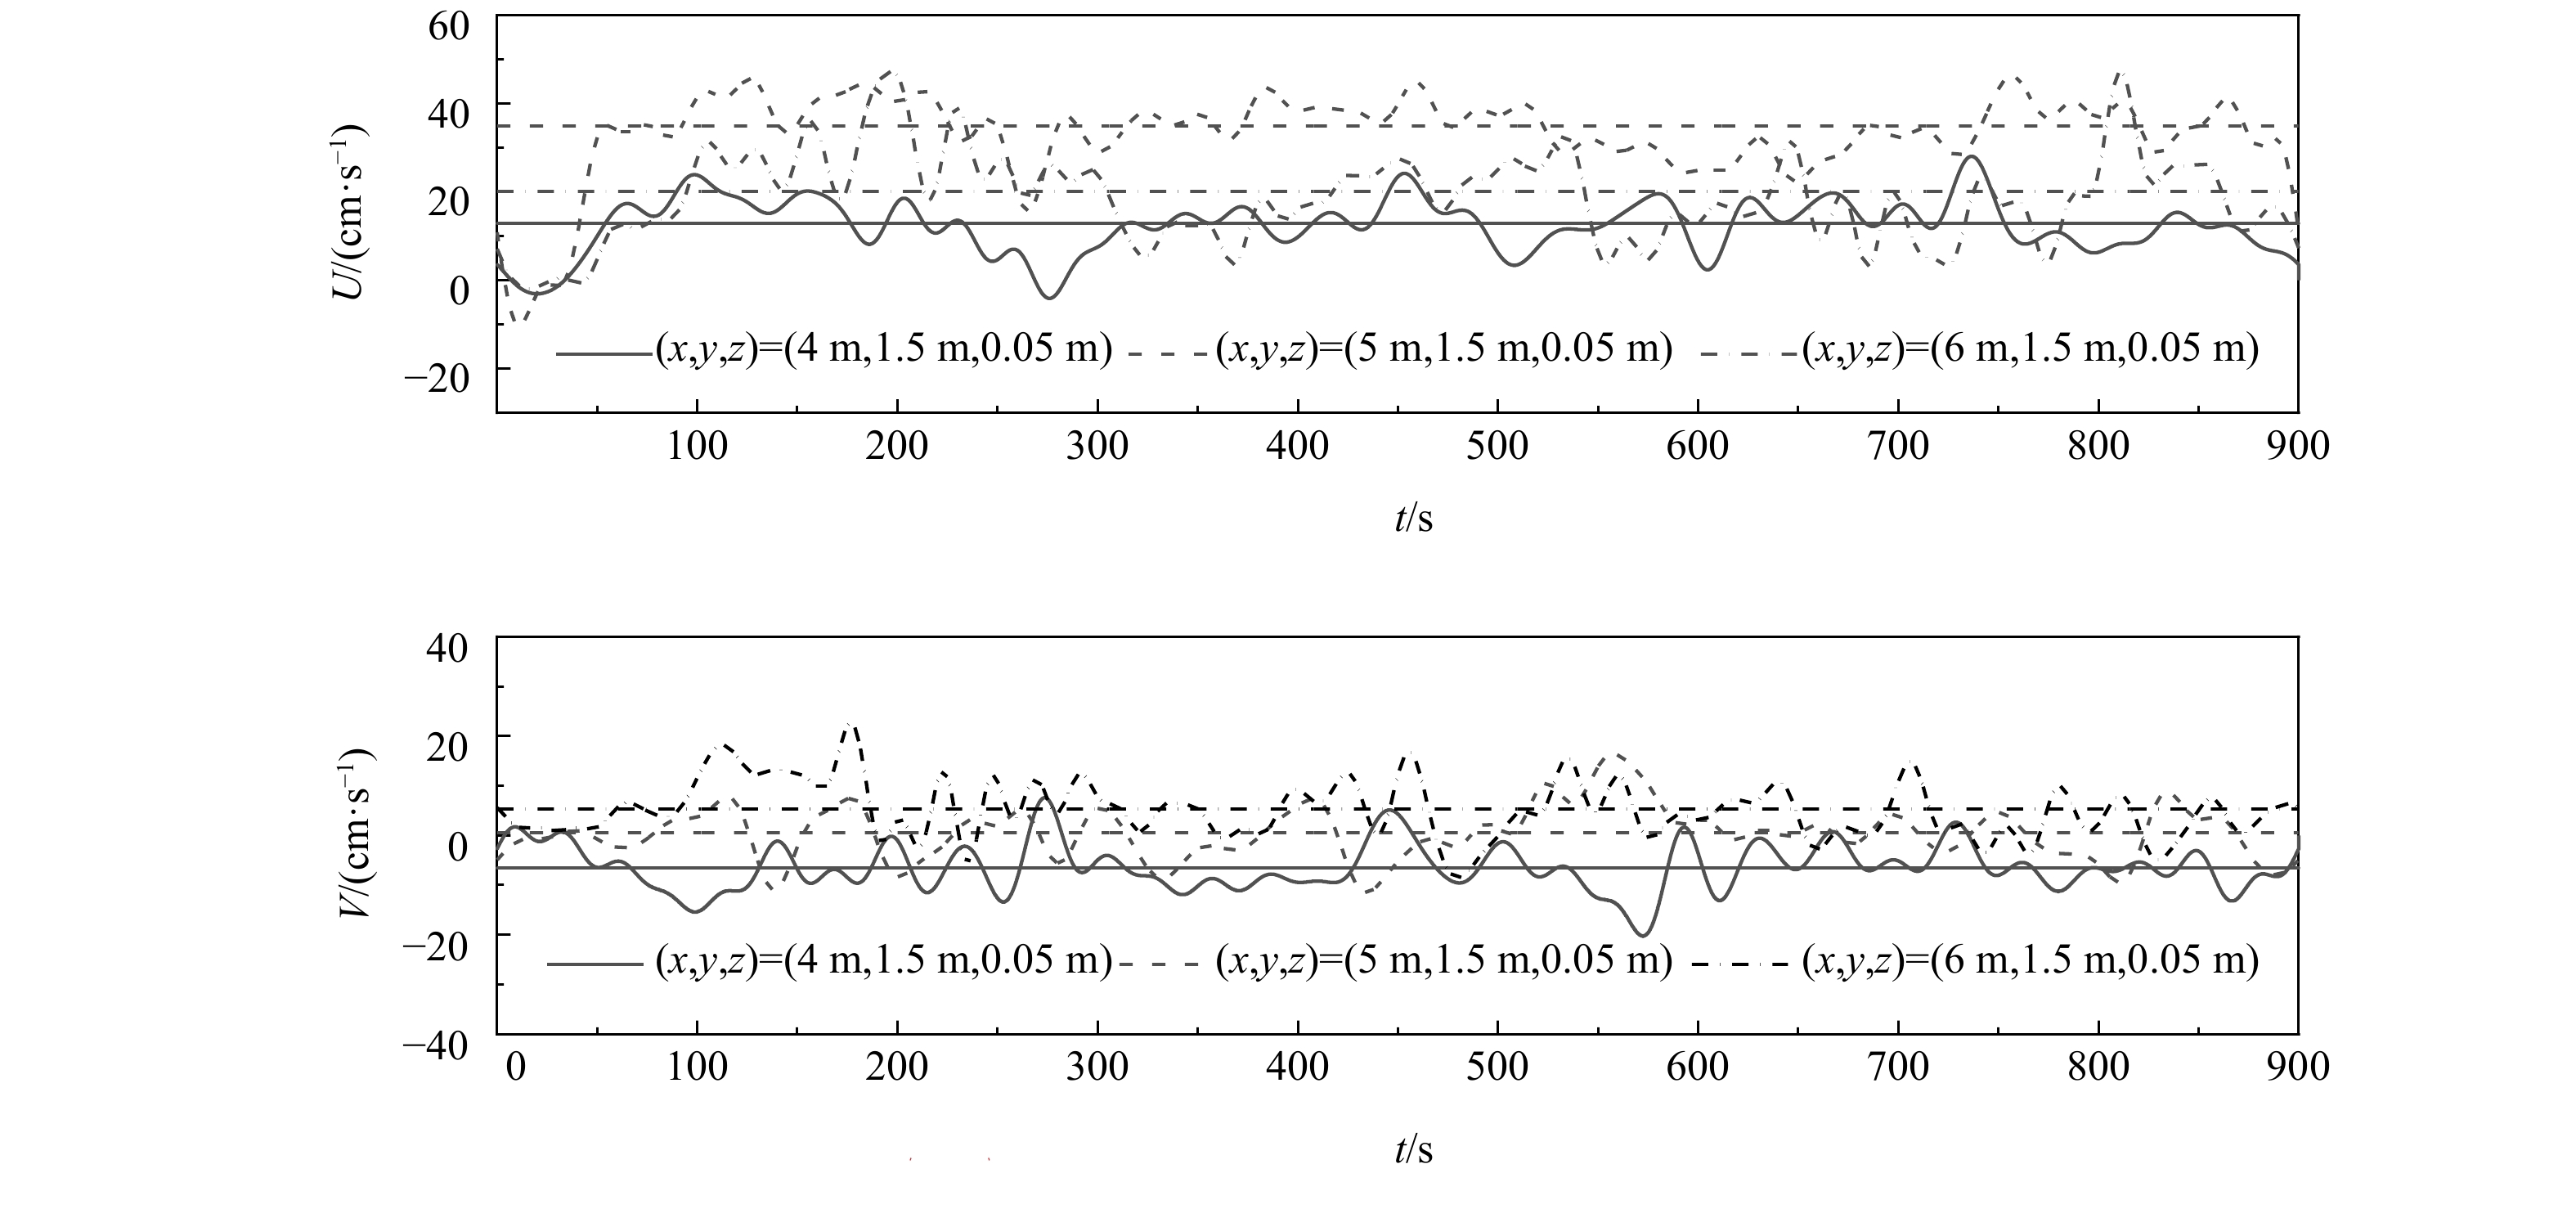
图 6 测量流速时间历程和时均值(波况rsh5t1)
横水平线为对应时间历程的时均值
Fig. 6 Time series and time-average value of measured velocity (case rsh5t1)
Horizontal line is the time-average value of corresponding time series
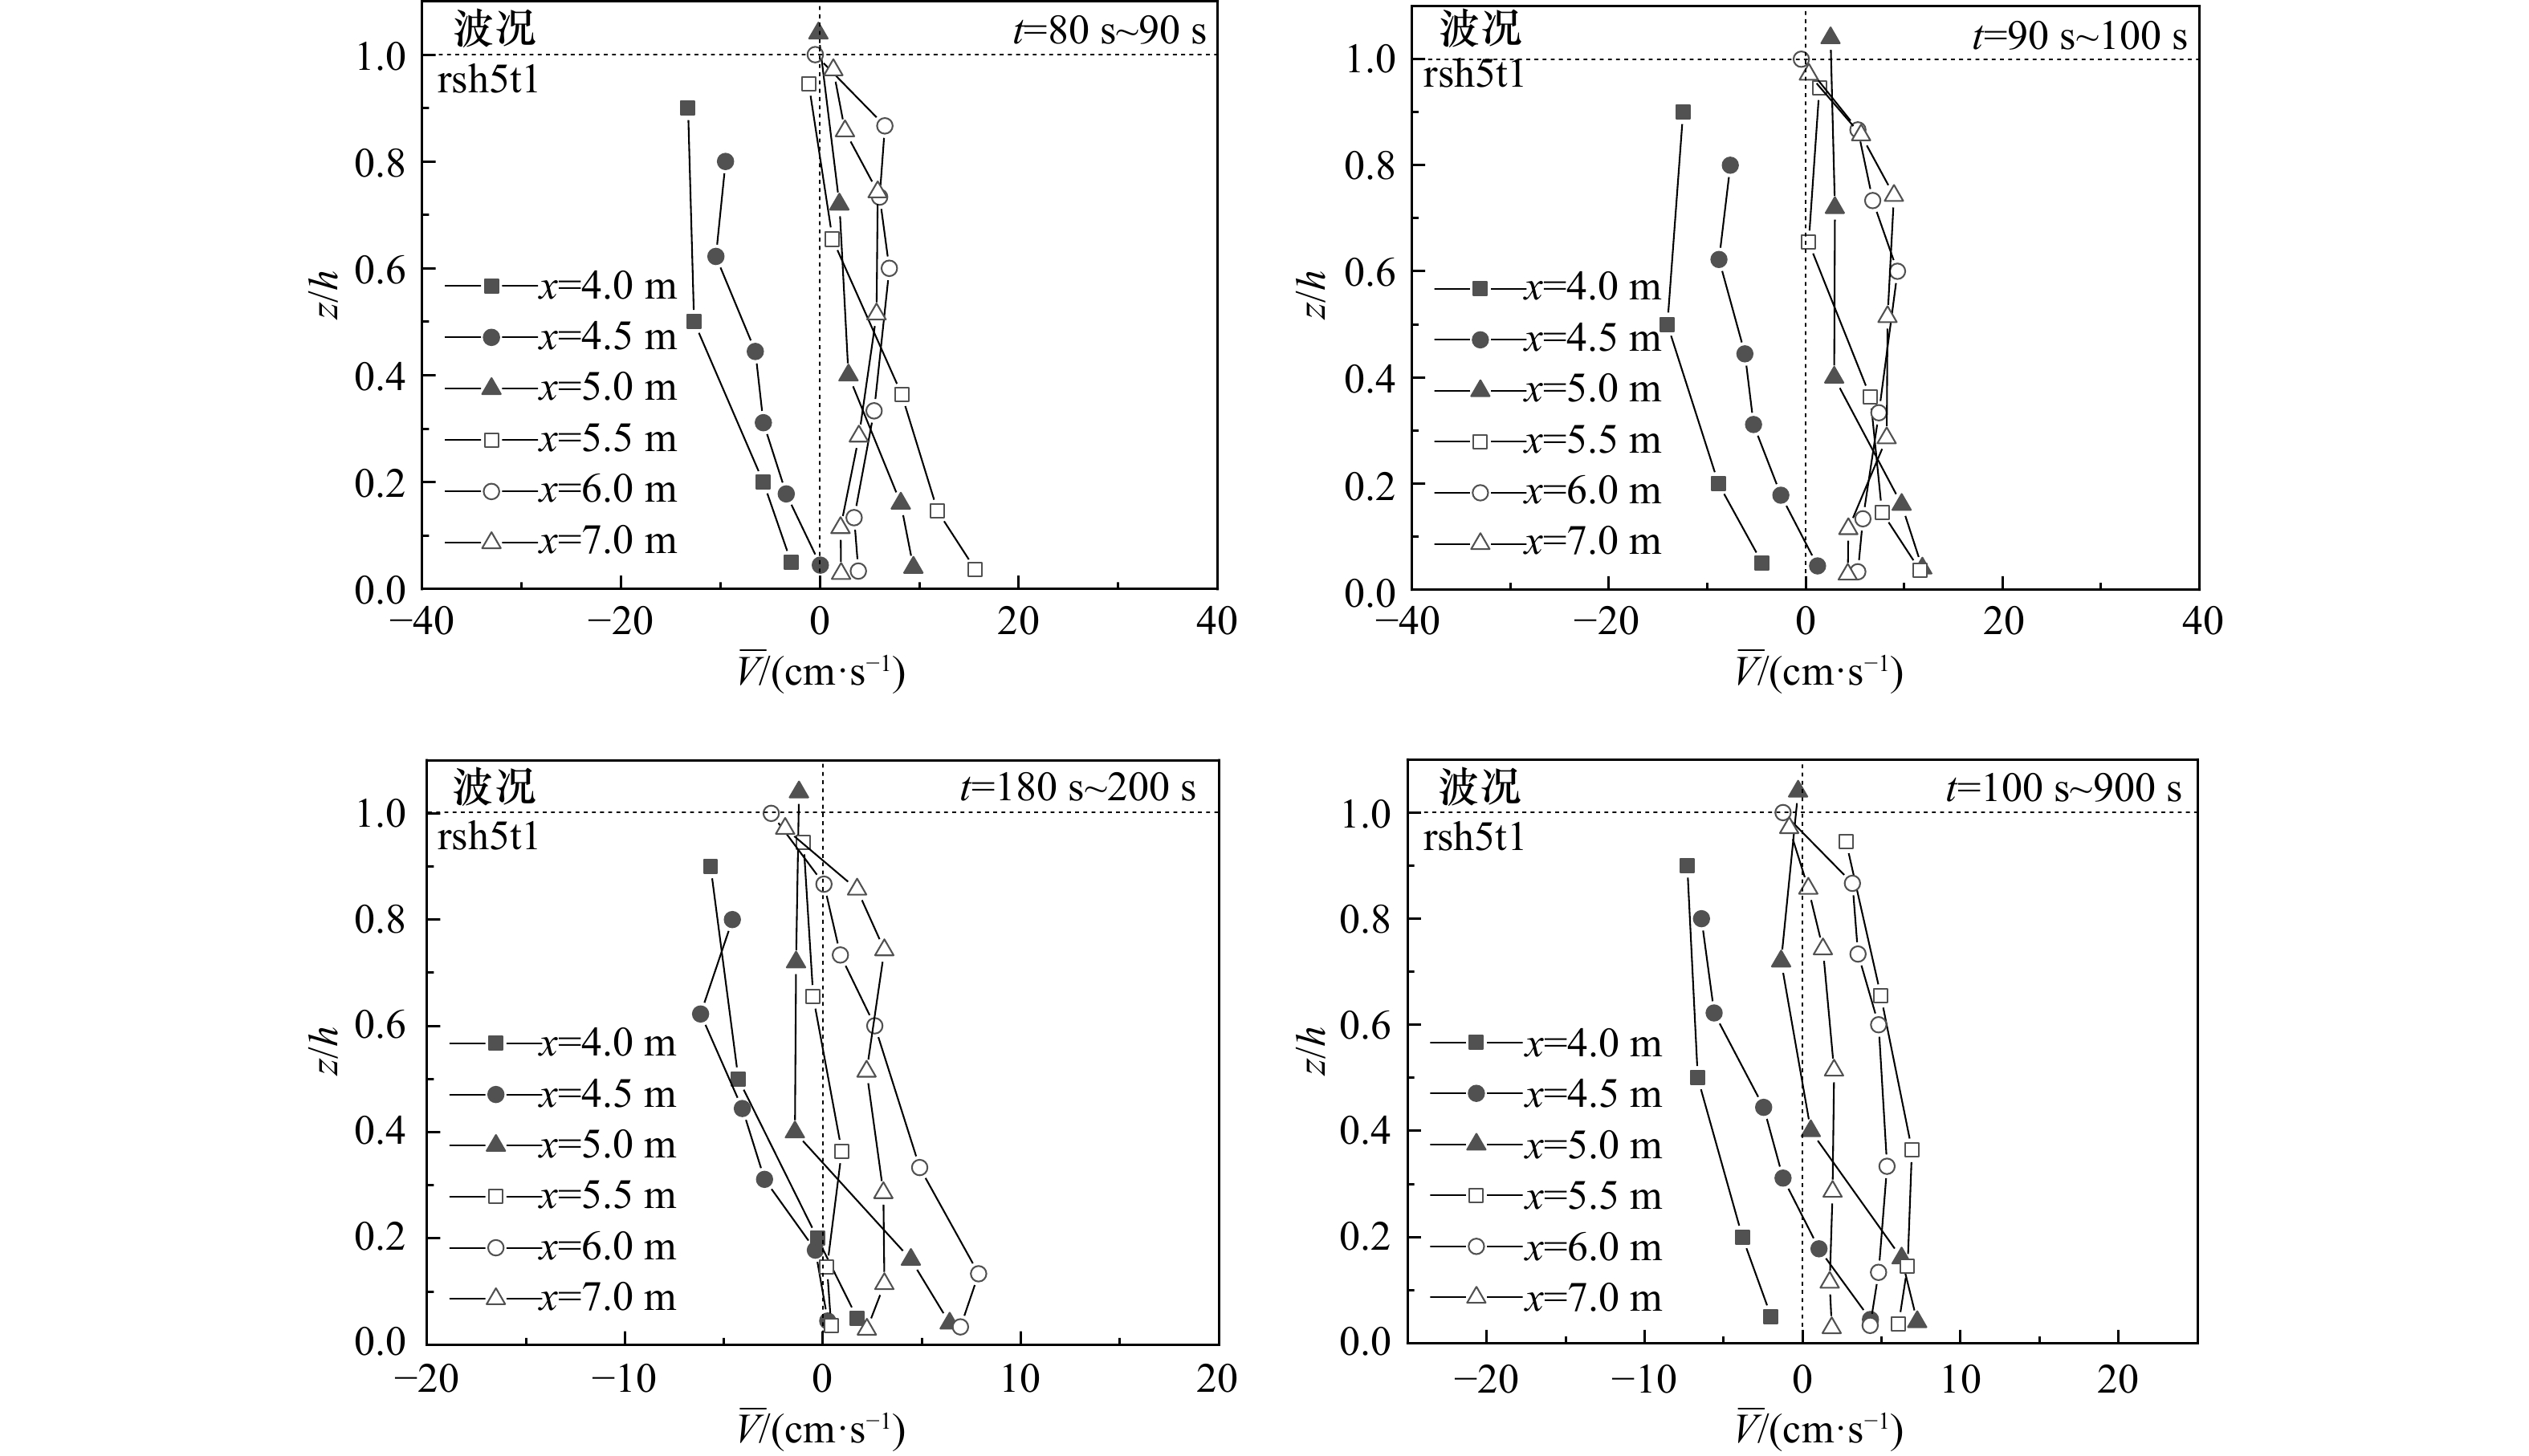
图 7 不同时间段裂流横向速度垂向分布
Fig. 7 Vertical distribution of transverse velocity in different time periods
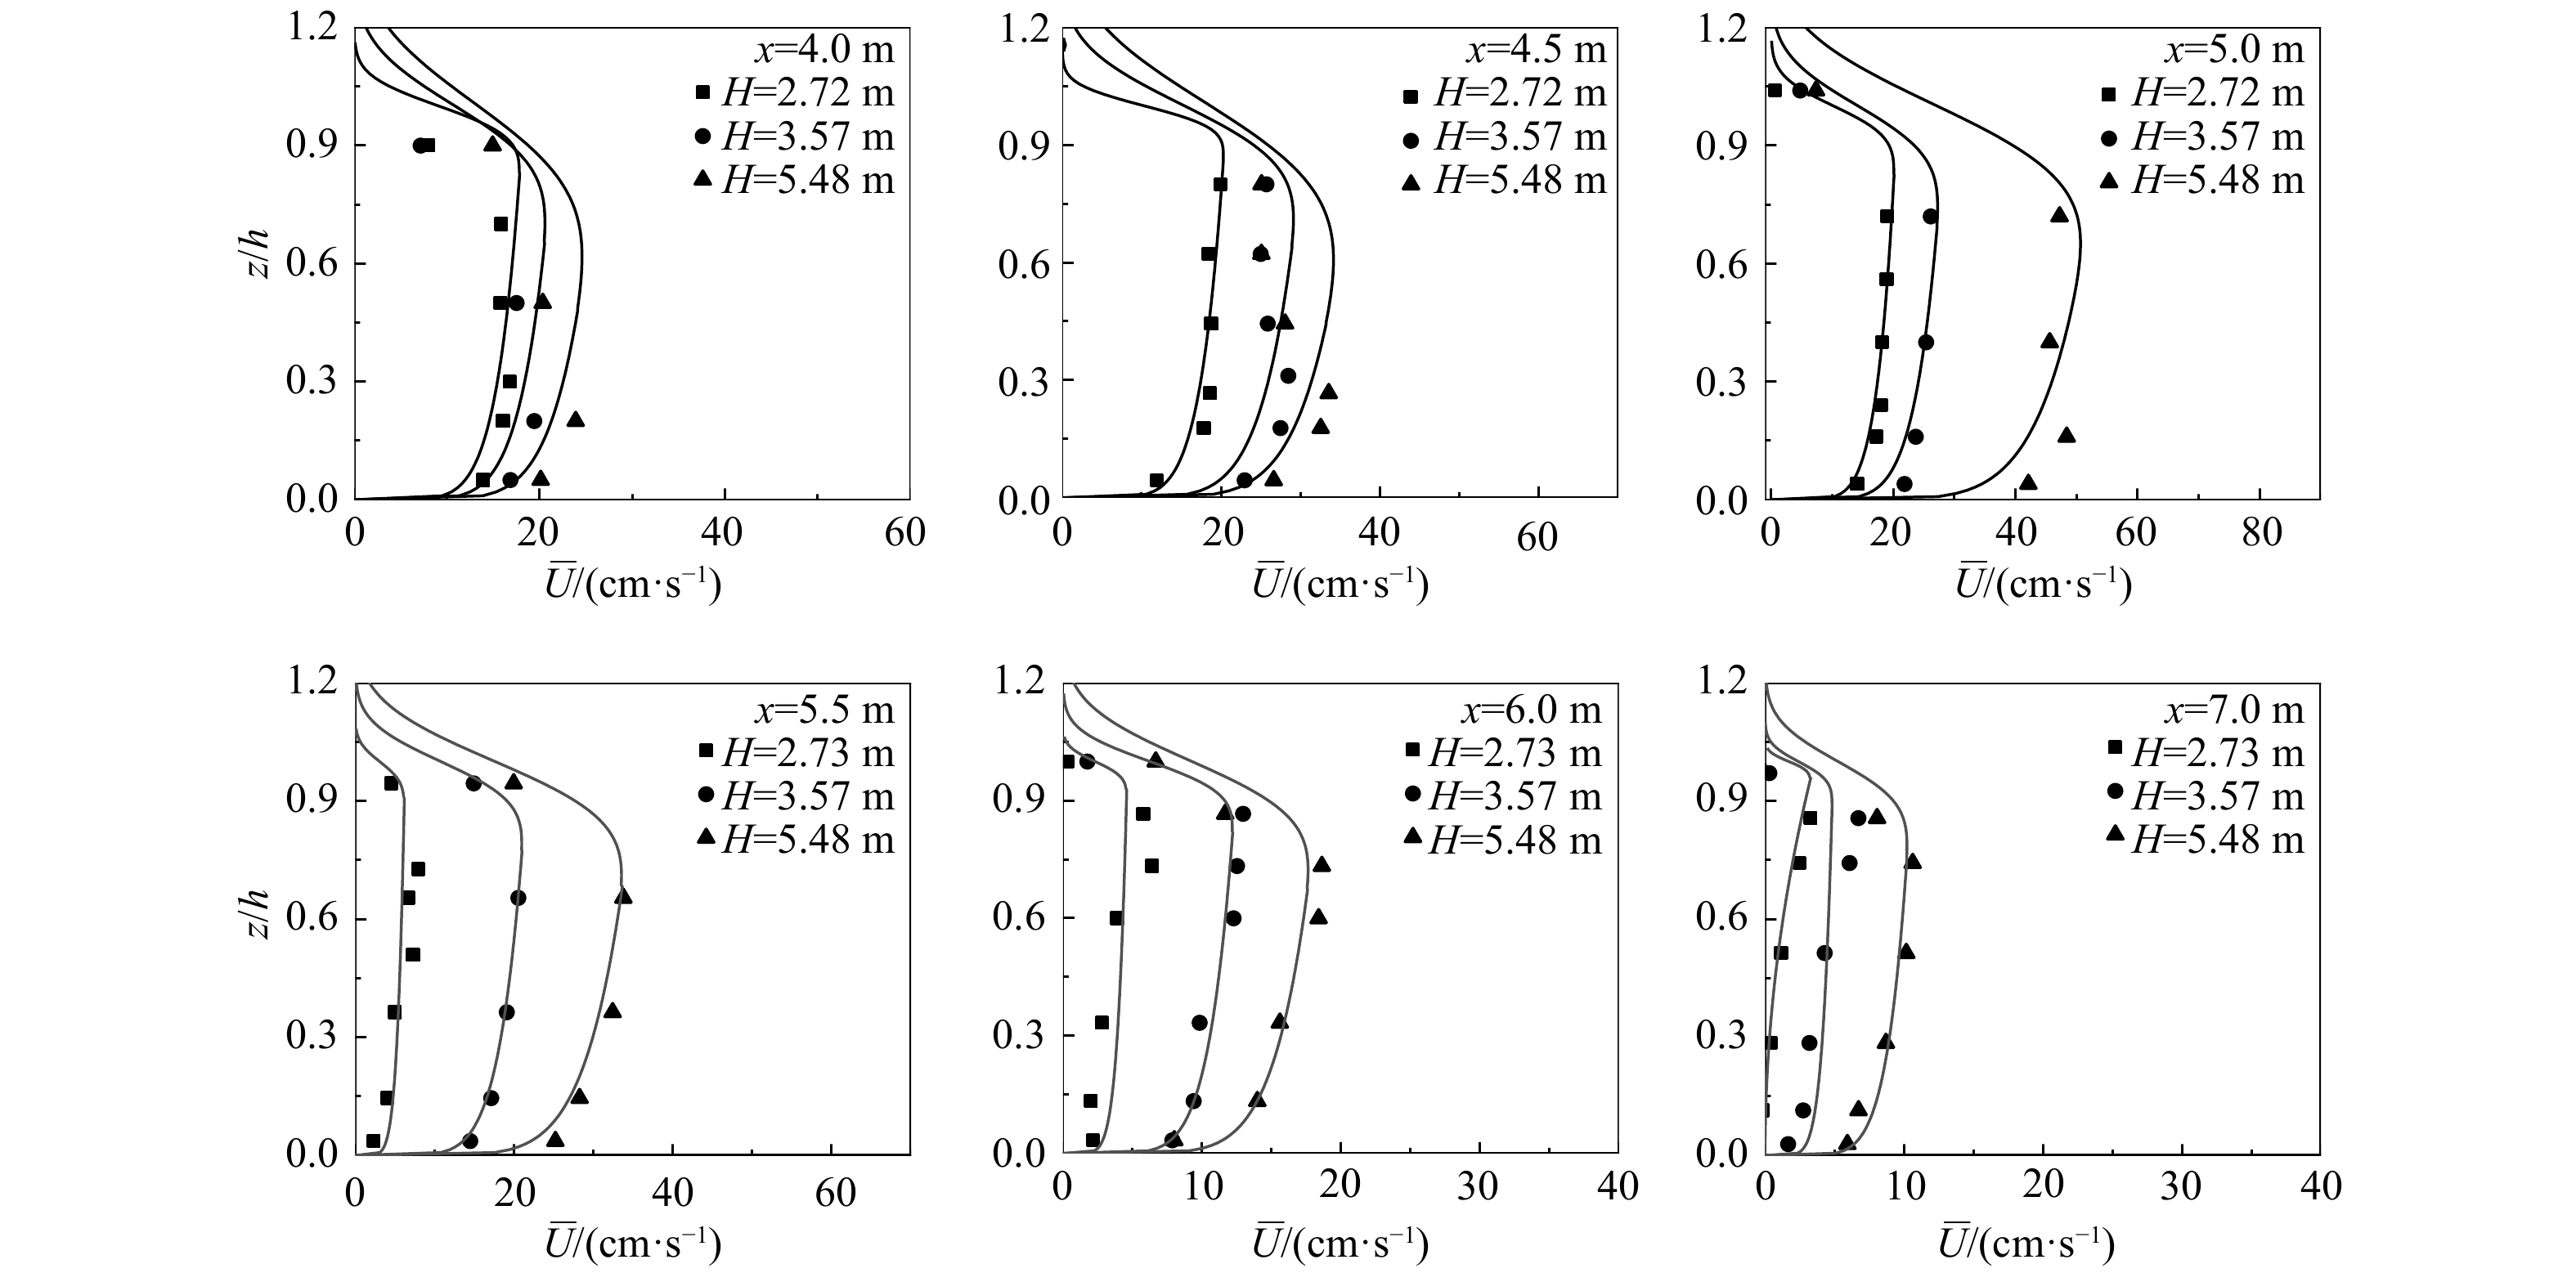
图 8 同周期(T=2.0 s)不同入射波高纵向流速垂向分布
Fig. 8 Vertical distribution of longitudinal velocity in the same period (T=2.0 s) with different incident heights
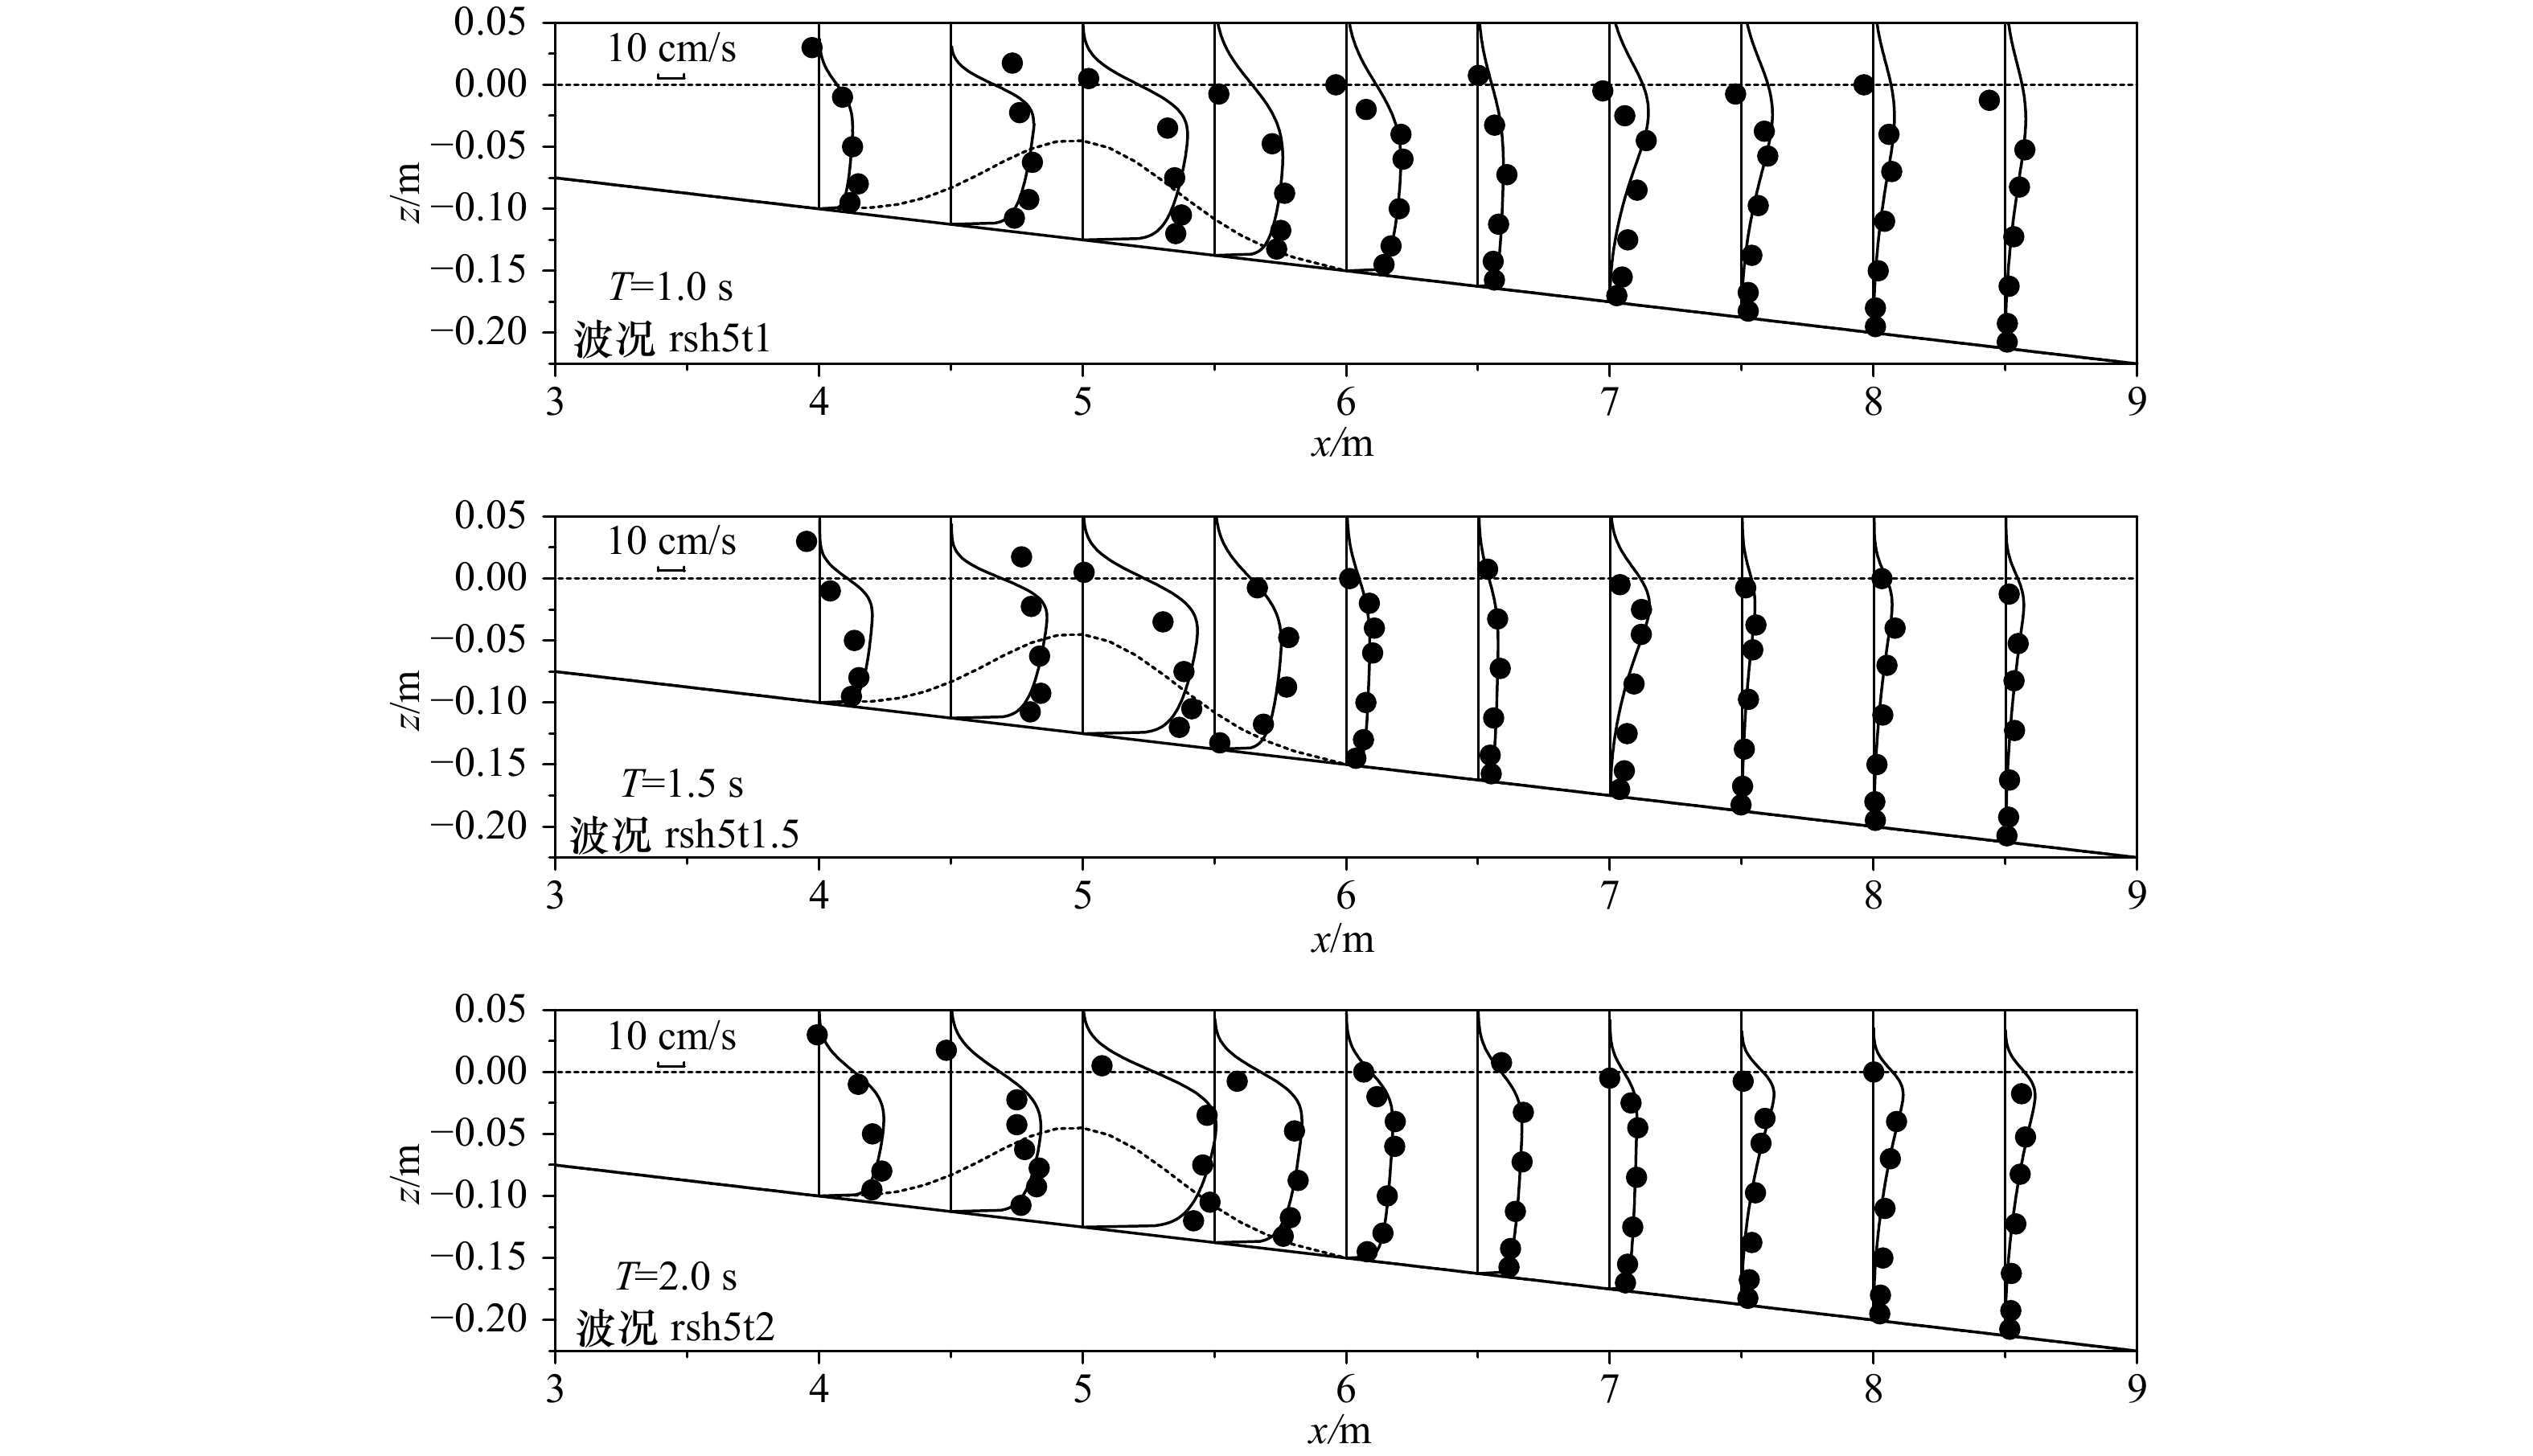
图 9 不同周期波况的裂流纵向速度垂向分布
Fig. 9 Vertical distribution of longitudinal velocity in conditions with different periods
表 1 实验波况
Tab. 1 Test conditions
波况 波浪类型 H /cm T/s 破碎点${x_{\rm{b}}}$/m (槽外腹点) (槽内) rsh5t1 规则波 5.80 1.0 7.0 8.0 rsh5t1.5 规则波 5.91 1.5 7.0 5.5 rsh2t2 规则波 2.73 2.0 7.0 (未测) rsh3t2 规则波 3.57 2.0 7.5 5.0 rsh5t2 规则波 5.48 2.0 7.5 5.5 ish5t1 不规则波 4.03 1.0 7.0 7.0 ish5t1.5 不规则波 4.36 1.5 7.0 5.5 ish5t2 不规则波 4.17 2.0 7.5 5.5 注: H对不规则波为均方根波高。  下载: 导出CSV
表 2 叠加波浪的驻波波长、节腹点y坐标及相对裂流槽位置
Tab. 2 The standing wavelength and y coordinates of node and anti-node points of superimposed wave and relative position of the channel
周期/s ${L_y}$/m 节点y坐标 腹点y坐标 裂流槽
中心线/m裂流槽中心线相对
节腹点位置1 2 3 1 2 3 1.0 1.50 0.75 2.25 3.74 0 1.50 3.00 1.5 与腹点2重合 1.5 2.71 1.36 4.07 6.78 0 2.71 5.46 1.5 与节点1接近 2.0 3.88 1.94 5.82 9.70 0 3.88 7.76 1.5 在节点1与腹点1之间
下载: 导出CSV
-
[1] Shepard F P, Inman D L. Nearshore water circulation related to bottom topography and wave refraction[J]. Eos, Transactions, American Geophysical Union, 1950, 31(2): 196−212. doi: 10.1029/TR031i002p00196 [2] Fowler R E, Dalrymple R A. Wave group forced nearshore circulation[C]//22nd International Conference on Coastal Engineering. Delft: ICCE, 1990: 729−742. [3] Vagle S, Farmer D M, Deane G B. Bubble transport in rip currents[J]. Journal of Geophysical Research: Oceans, 2001, 106(C6): 11677−11689. doi: 10.1029/2000JC000276 [4] Turner I L, Whyte D, Ruessink B G, et al. Observations of rip spacing, persistence and mobility at a long, straight coastline[J]. Marine Geology, 2007, 236(3/4): 209−221. [5] Haller M C, Dalrymple R A, Svendsen I A. Experimental study of nearshore dynamics on a barred beach with rip channels[J]. Journal of Geophysical Research: Oceans, 2002, 107(C6): 14-1−14-21. [6] Drønen N, Karunarathna H, Fredsøe J, et al. An experimental study of rip channel flow[J]. Coastal Engineering, 2002, 45(3/4): 223−238. [7] 房克照, 尹继伟, 邹志利. 单沟槽沙坝海岸的裂流实验研究[J]. 水动力学研究与进展, 2013, 28(3): 363−369.Fang Kezhao, Yin Jiwei, Zou Zhili. Experiment study on rip current of barred beach with a single channel[J]. Chinese Journal of Hydrodynamics, 2013, 28(3): 363−369. [8] Zheng Jinhai, Yao Yu, Chen Songgui, et al. Laboratory study on wave-induced setup and wave-driven current in a 2DH reef-lagoon-channel system[J]. Coastal Engineering, 2020, 162: 103772. doi: 10.1016/j.coastaleng.2020.103772 [9] Kennedy A B, Thomas D. Drifter measurements in a laboratory rip current[J]. Journal of Geophysical Research: Oceans, 2004, 109(C8): C08005. [10] MacMahan J, Brown J, et al. Mean Lagrangian flow behavior on an open coast rip-channeled beach: A new perspective[J]. Marine Geology, 2010, 268(1/4): 1−15. [11] Castelle B, Michallet H, Marieu V, et al. Laboratory experiment on rip current circulations over a moveable bed: Drifter measurements[J]. Journal of Geophysical Research: Oceans, 2010, 115(C12): C12008. doi: 10.1029/2010JC006343 [12] 彭石, 邹志利. 海岸裂流的浮子示踪法实验测量[J]. 水动力学研究与进展, 2011, 26(6): 645−651.Peng Shi, Zou Zhili. Experimental measurement of rip currents with video-tracked drifters[J]. Chinese Journal of Hydrodynamics, 2011, 26(6): 645−651. [13] Gallop S L, Bryan K R, Pitman S J, et al. Rip current circulation and surf zone retention on a double barred beach[J]. Marine Geology, 2018, 405: 12−22. doi: 10.1016/j.margeo.2018.07.015 [14] Wind H G, Vreugdenhil C B. Rip-current generation near structures[J]. Journal of Fluid Mechanics, 1986, 171: 459−476. doi: 10.1017/S0022112086001520 [15] Haas K A, Svendsen I A. Laboratory measurements of the vertical structure of rip currents[J]. Journal of Geophysical Research: Oceans, 2002, 107(C5): 15-1−15-19. [16] Pattiaratchi C, Olsson D, Hetzel Y, et al. Wave-driven circulation patterns in the lee of groynes[J]. Continental Shelf Research, 2009, 29(16): 1961−1974. doi: 10.1016/j.csr.2009.04.011 [17] Scott T, Austin M, Masselink G, et al. Dynamics of rip currents associated with groynes—field measurements, modelling and implications for beach safety[J]. Coastal Engineering, 2016, 107: 53−69. doi: 10.1016/j.coastaleng.2015.09.013 [18] 王彦. 沙坝海岸沿岸流和裂流特征研究[D]. 大连: 大连理工大学, 2018.Wang Yan. Study on the longshore currents and rip currents on barred beaches[D]. Dalian: Dalian University of Technology, 2018. [19] Haller M C, Dalrymple R A. Rip current instabilities[J]. Journal of Fluid Mechanics, 2001, 433: 161−192. doi: 10.1017/S0022112000003414 [20] Svendsen I A. Introduction to Nearshore Hydrodynamics[M]. Hackensack: World Scientific Publishing Company, 2006. [21] Barenblatt G I. Scaling laws for fully developed turbulent shear flows. Part 1. Basic hypotheses and analysis[J]. Journal of Fluid Mechanics, 1993, 248: 513−520. doi: 10.1017/S0022112093000874 [22] Faria A F G, Thornton E B, Stanton T P, et al. Vertical profiles of longshore currents and related bed shear stress and bottom roughness[J]. Journal of Geophysical Research: Oceans, 1998, 103(C2): 3217−3232. doi: 10.1029/97JC02265 -


计量
- 文章访问数: 245
- HTML全文浏览量: 70
- PDF下载量: 22
- 被引次数: 0
