

Temporal and spatial characteristics of marine heat waves in the Bohai Sea and Yellow Sea during 1982–2019
-
摘要: 基于1982–2019年美国国家海洋和大气管理局最优插值海表温度资料,运用多种统计方法分析了渤、黄海海洋热浪(频次、持续时间、强度)的时空分布特征及与之相关的环流背景。结果表明:(1)海洋热浪具有一定的区域性差异,更强、更持久和更多的海洋热浪多集中在渤海和北黄海海区;(2)近38年来,渤、黄海海洋热浪变化趋势也具有明显的区域性差异,频次、年平均持续时间、年平均平均强度和最大强度总体呈增多、增强趋势,但朝鲜半岛沿岸海域没有显著变化,这与该地区的平均海温变化密切相关;(3)根据日平均海表面温度将海洋热浪分为中等、强、严重和极端4种等级,结果表明,除极端海洋热浪外,其他3种不同等级海洋热浪发生频次和增长趋势均存在显著的地理差异,中等强度海洋热浪在渤、黄海所有区域均频次偏多且有显著的增加趋势,而强和严重海洋热浪主要集中在我国的渤海海域,但渤、黄海区域极端海洋热浪几乎没有发生;(4)就渤、黄海区域平均而言,38年间,共发生83次海洋热浪,平均每年2.2次;海洋热浪具有明显的季节差异,不同等级强度的海洋热浪的多发季节均在夏季;(5)合成分析结果表明,夏季渤、黄海海洋热浪与大气环流密切相关,当从高层到低层贝加尔湖区域上空表现为大范围的相当正压结构的暖性高压异常时,盛行的下沉运动和高空西北气流,带来了晴朗的天气和更多的地面净太阳短波辐射,有利于渤、黄海海洋热浪的形成和维持。Abstract: Based on National Oceanic and Atmospheric Administration daily optimum interpolation sea surface temperature (SST) data set from 1982 to 2019, spatial-temporal changes in marine heat wave (MHW) (frequency, duration, intensity) in the Bohai Sea and Yellow Sea and associated circulations were analyzed using various statistical methods. Results show that: (1) there are obvious regional differences in MHW. More frequency, longer duration, more intensity MHWs are all located at the most part of the Bohai Sea and northern Yellow Sea. (2) In recent 38 years, the annual frequency, annual average duration, annual average intensity and maximum intensity of the marine heat waves in the Bohai Sea and Yellow Sea have generally increased and strengthened, together with spatial heterogeneity. The trends at the coast of the Korean Peninsula coastal show insignificant trend. (3) MHWs were classified into four levels by daily SST: moderate, strong, severe and extreme. Result shows that except extreme MHWs, there are significant geographic differences in the frequency and trend of the other three MHW levels. Moderate MHWs are more frequent and have a significant increasing trend in most part of the Bohai Sea and Yellow Sea, while strong and severe marine heat waves are mainly concentrated in the Bohai Sea. However, extreme MHW in this region was hardly occurred. (4) Regional, there were 83 MHWs occurred in the Bohai Sea and Yellow Sea during 1982 to 2019, with an average of 2.2 times per year. The frequencies of MHWs appeared seasonal variation obviously. More MHWs with different levels of intensity occurred in summer. (5) Composite analysis shows that, summer MHWs in the Bohai Sea and Yellow Sea have significant relationship with atmospheric circulation. Barotropic positive geopotential height anomalies centered on Lake Baikal were favorable for anomalous descending air motion in the lower troposphere and west-northerly winds in high troposphere, there should be more clear days and hence more MHWs during the high-solar-radiation summer period.
-
Key words:
- marine heat wave /
- frequency /
- duration /
- intensity /
- atmospheric circulation
-
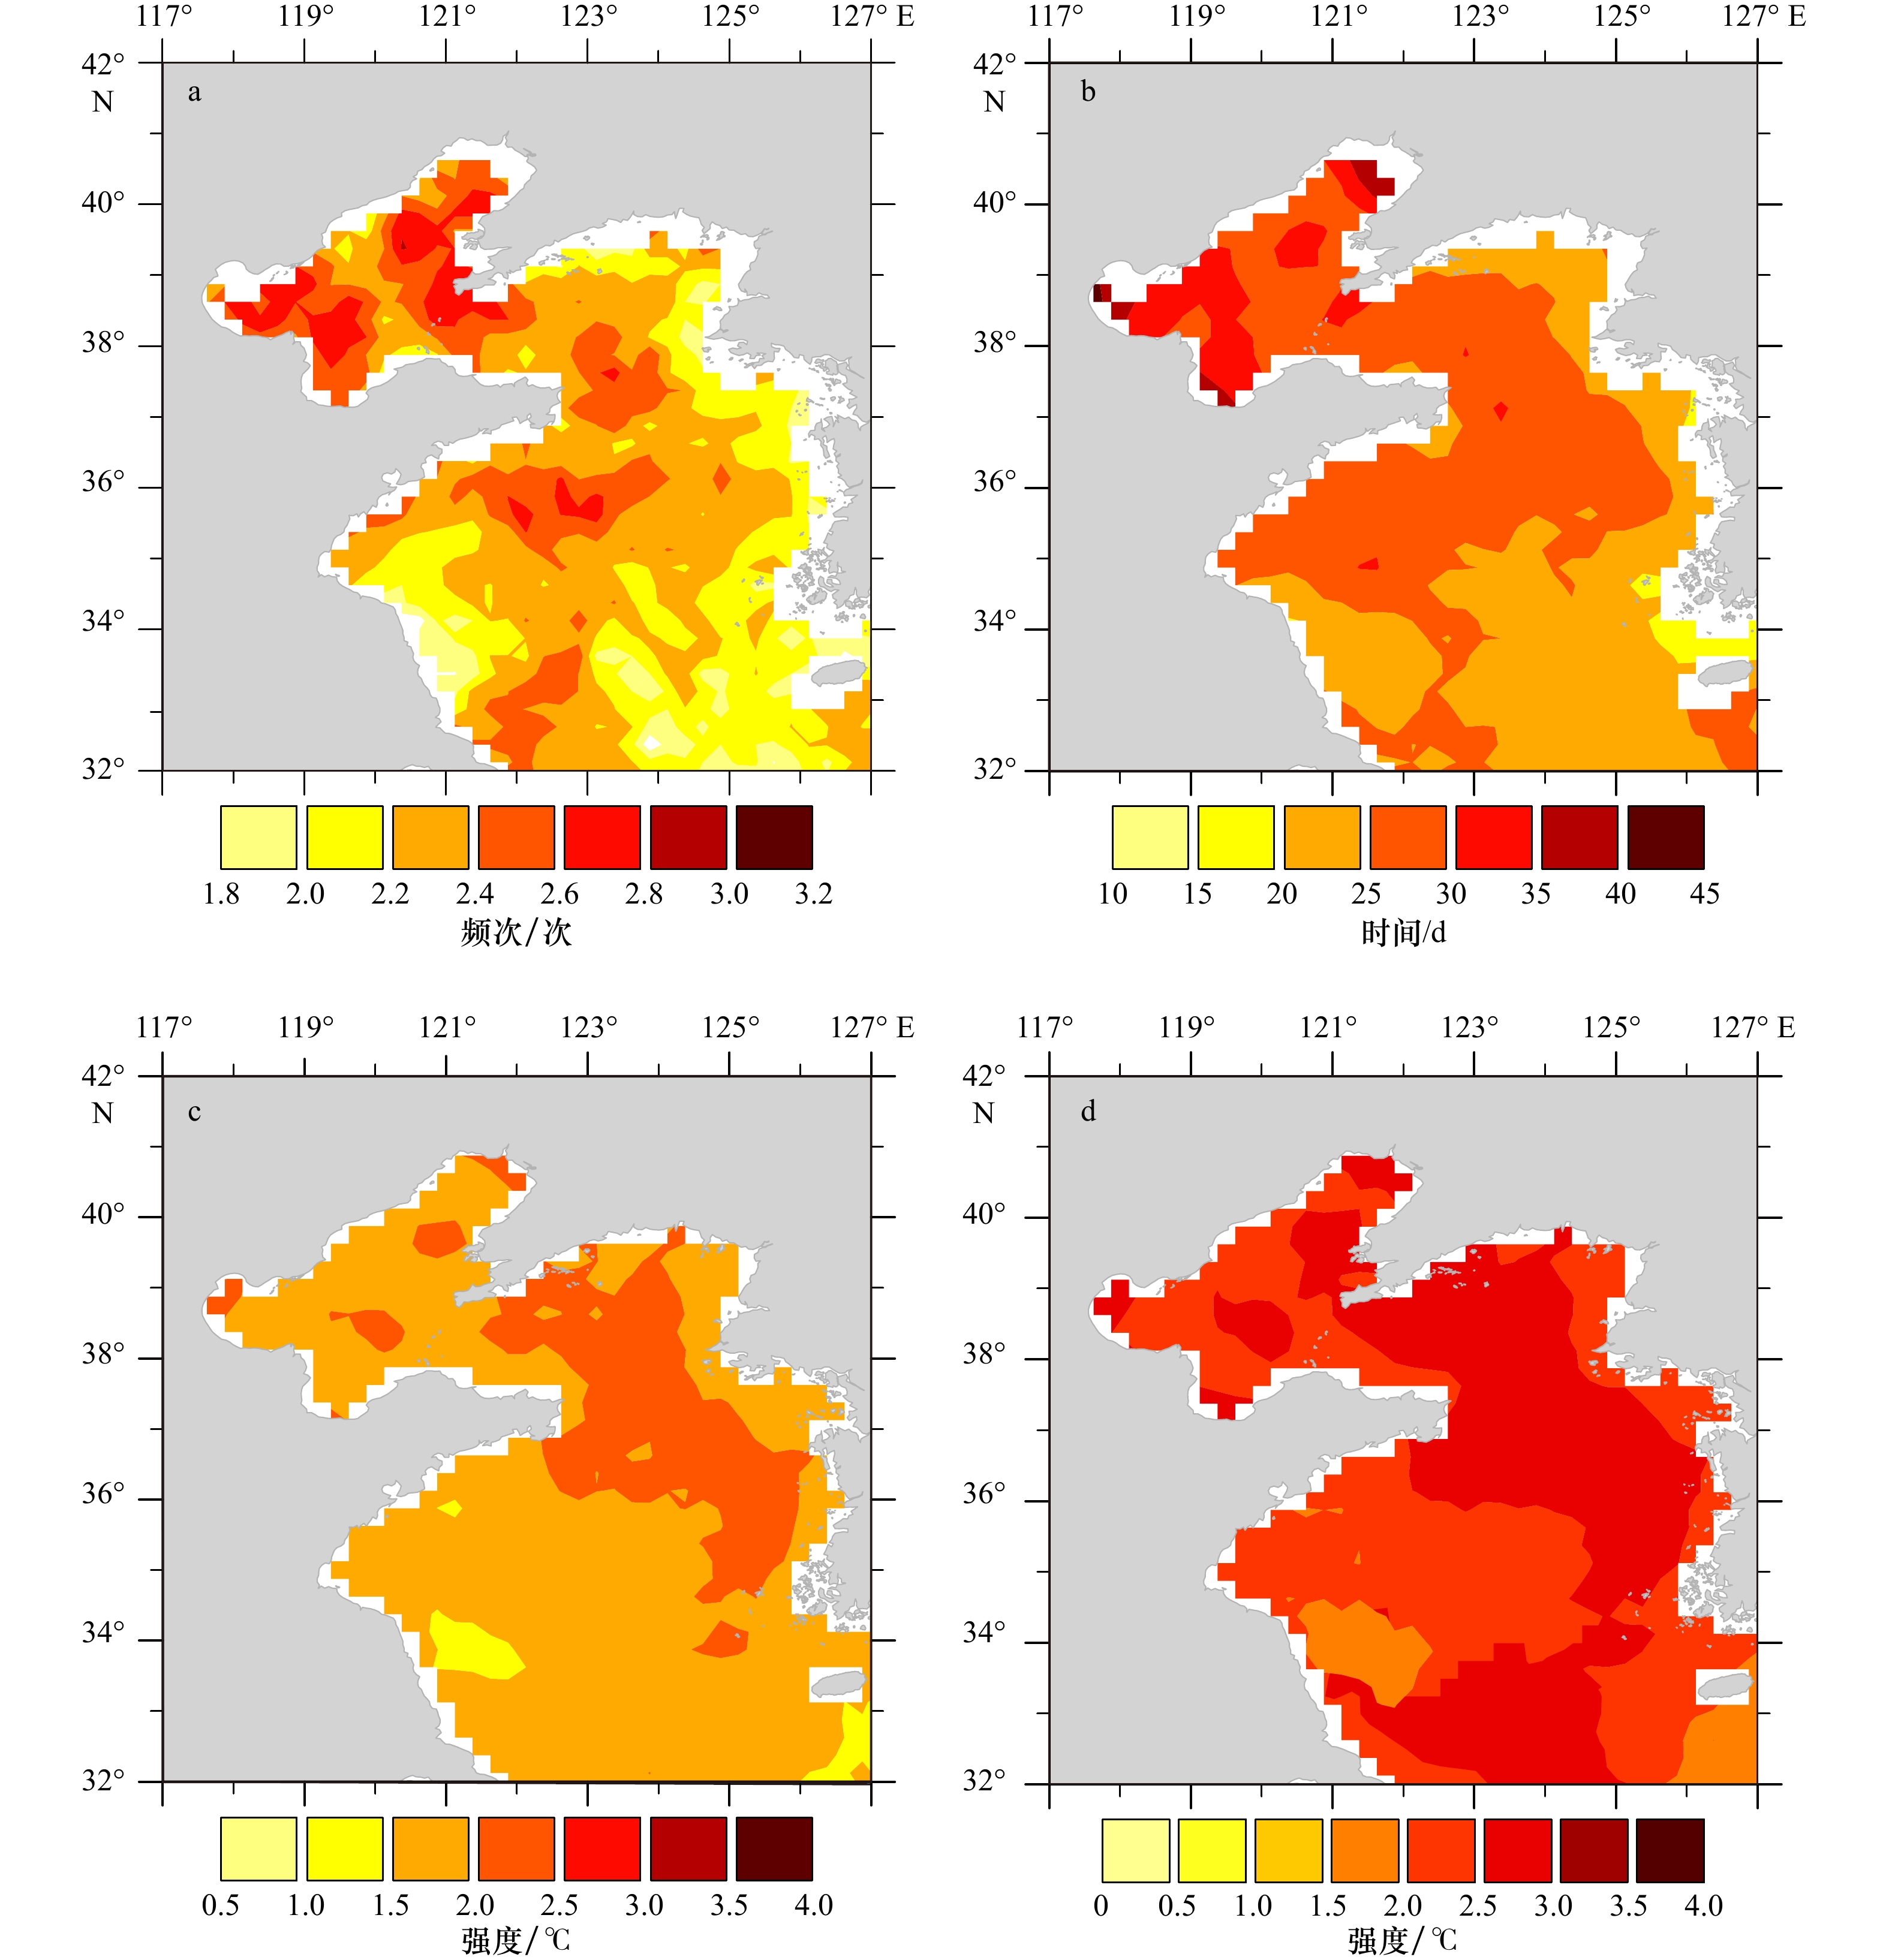
图 2 1982−2019年渤海和黄海平均海洋热浪频次(a)、持续时间(b)、平均强度(c)和最大强度(d)的空间分布
Fig. 2 Spatial distributions of mean annual frequency (a), duration (b), mean intensity (c) and the maximumintensity (d) of marine heatwaves in the Bohai Sea and Yellow Sea from 1982 to 2019
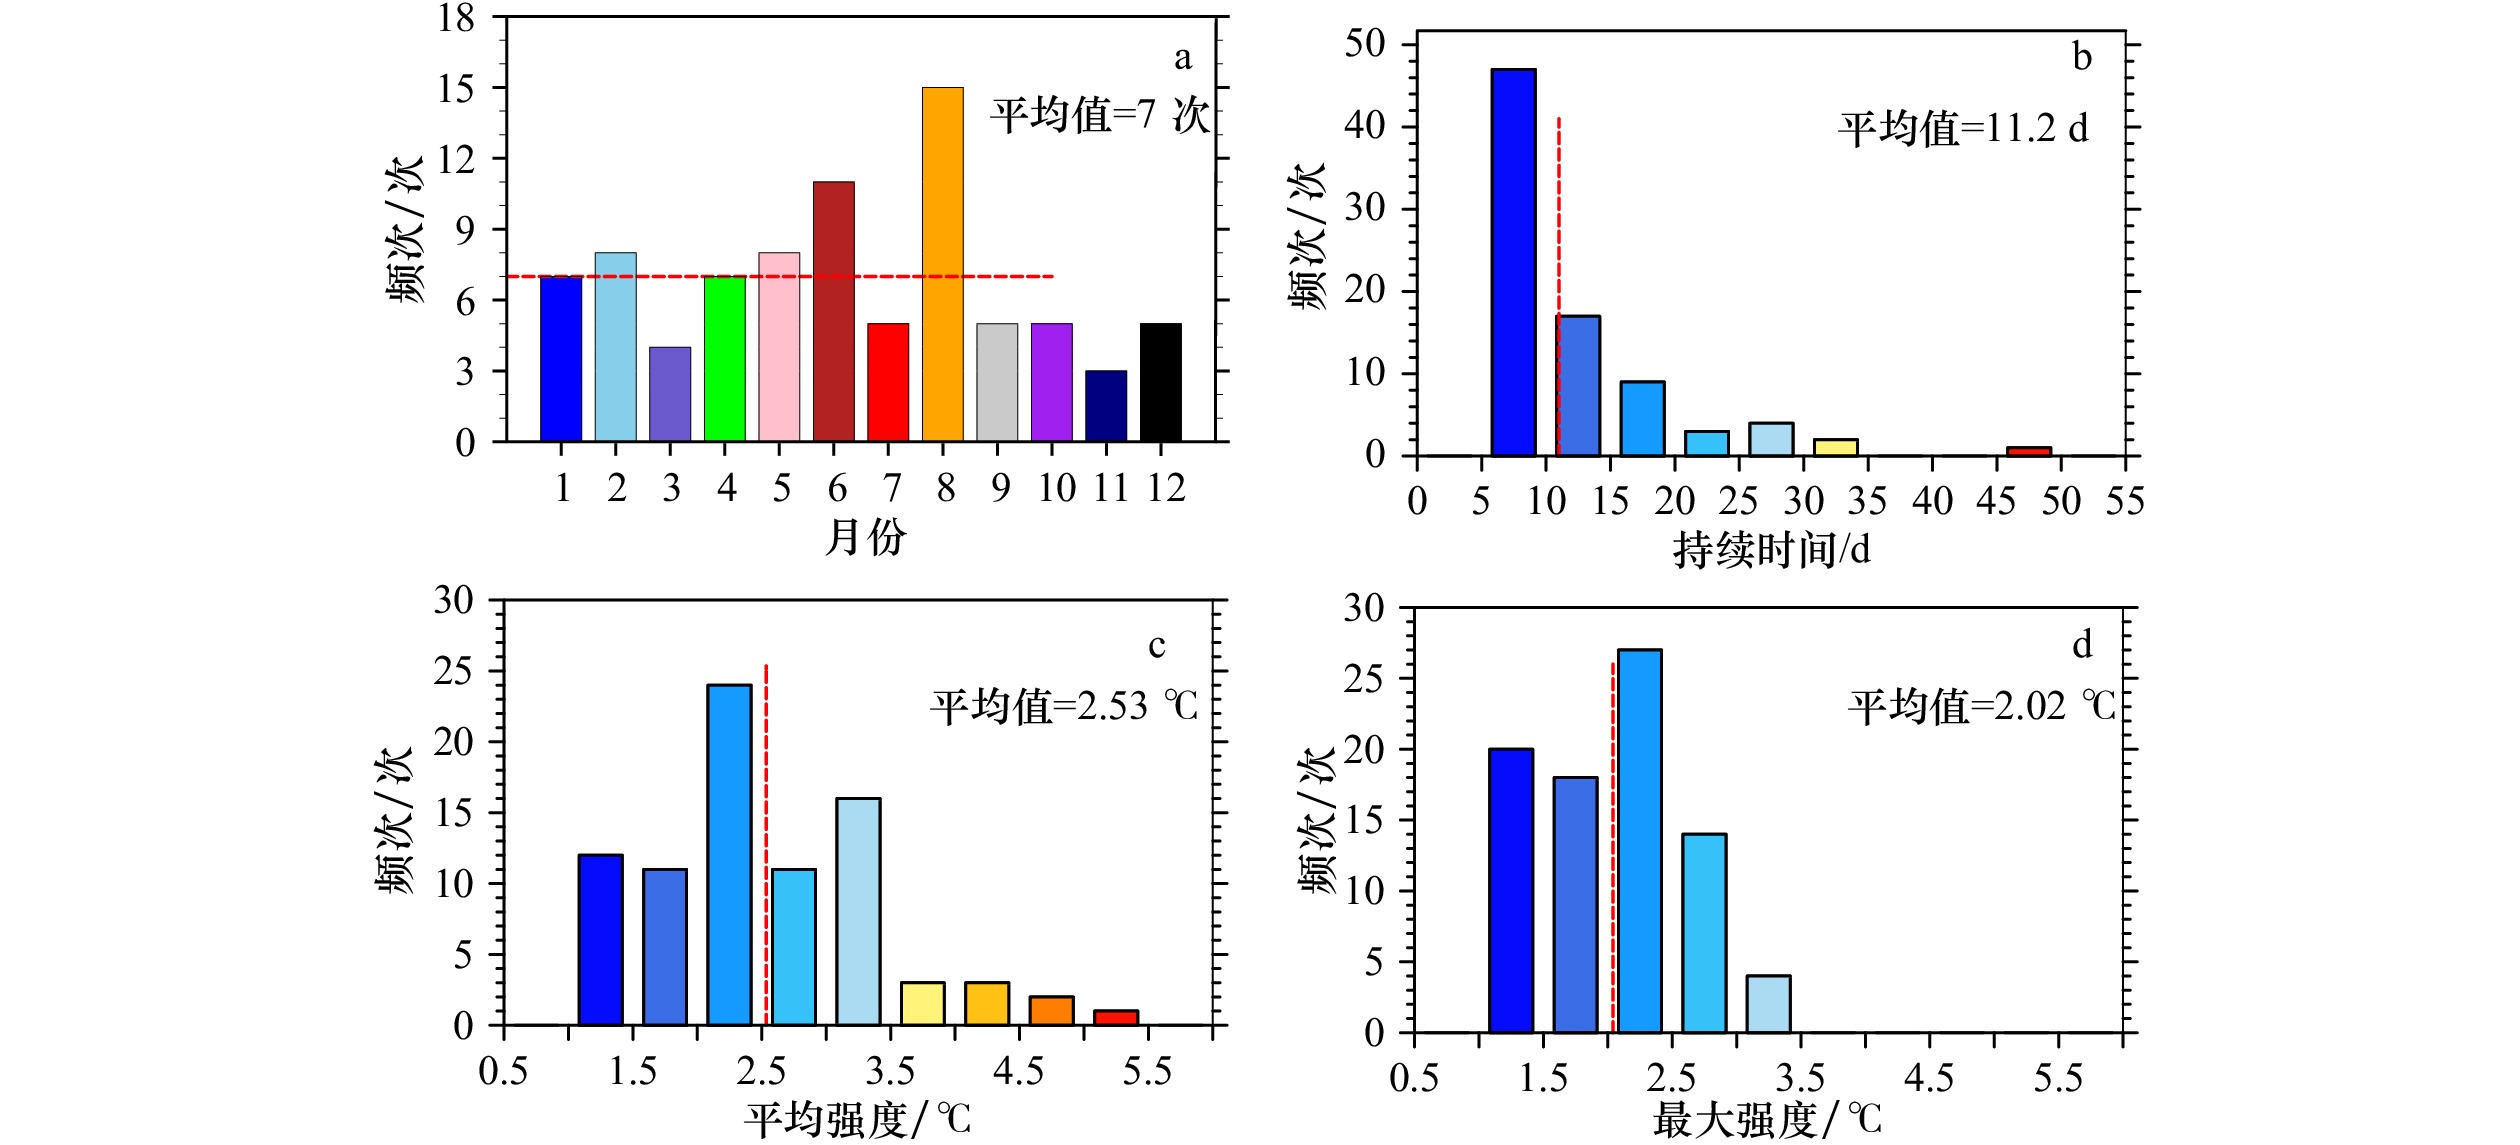
图 3 1982−2019年渤、黄海区域平均海洋热浪关键指标分布直方图
Fig. 3 Histograms of the four key indicators of marine heat waves in the Bohai Sea and Yellow Sea from 1982 to 2019

图 4 1982−2019年渤、黄海区域4种等级海洋热浪年平均发生频次分布
Fig. 4 Spatial distributions of mean annual frequency of 4 marine heat wave categories in the Bohai Sea and Yellow Sea from 1982 to 2019
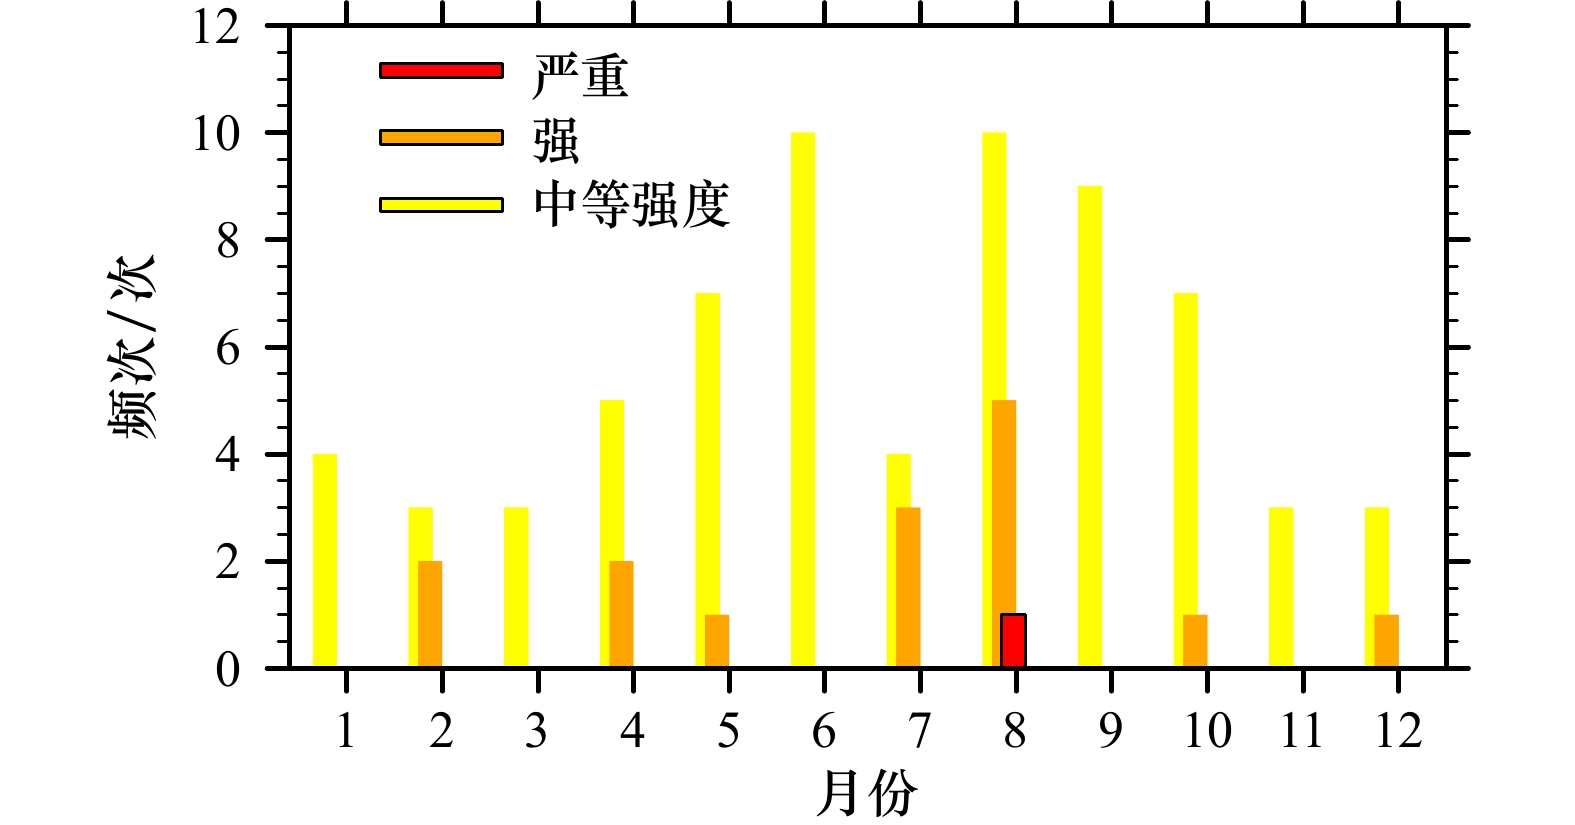
图 5 1982–2019年渤、黄海区域3种等级海洋热浪各月发生频次分布
Fig. 5 Monthly occurrence frequency of the three level marine heat waves in the Bohai Sea and Yellow Sea from 1982 to 2019

图 6 1982–2019年渤、黄海海洋热浪发生频次(a)、持续时间(b)、平均强度(c)和最大强度(d)的变化趋势
Fig. 6 Trends of the marine heat wave frequency (a), duration (b), mean intensity (c) and maximumintensity (d) in the Bohai Sea and Yellow Sea from 1982 to 2019
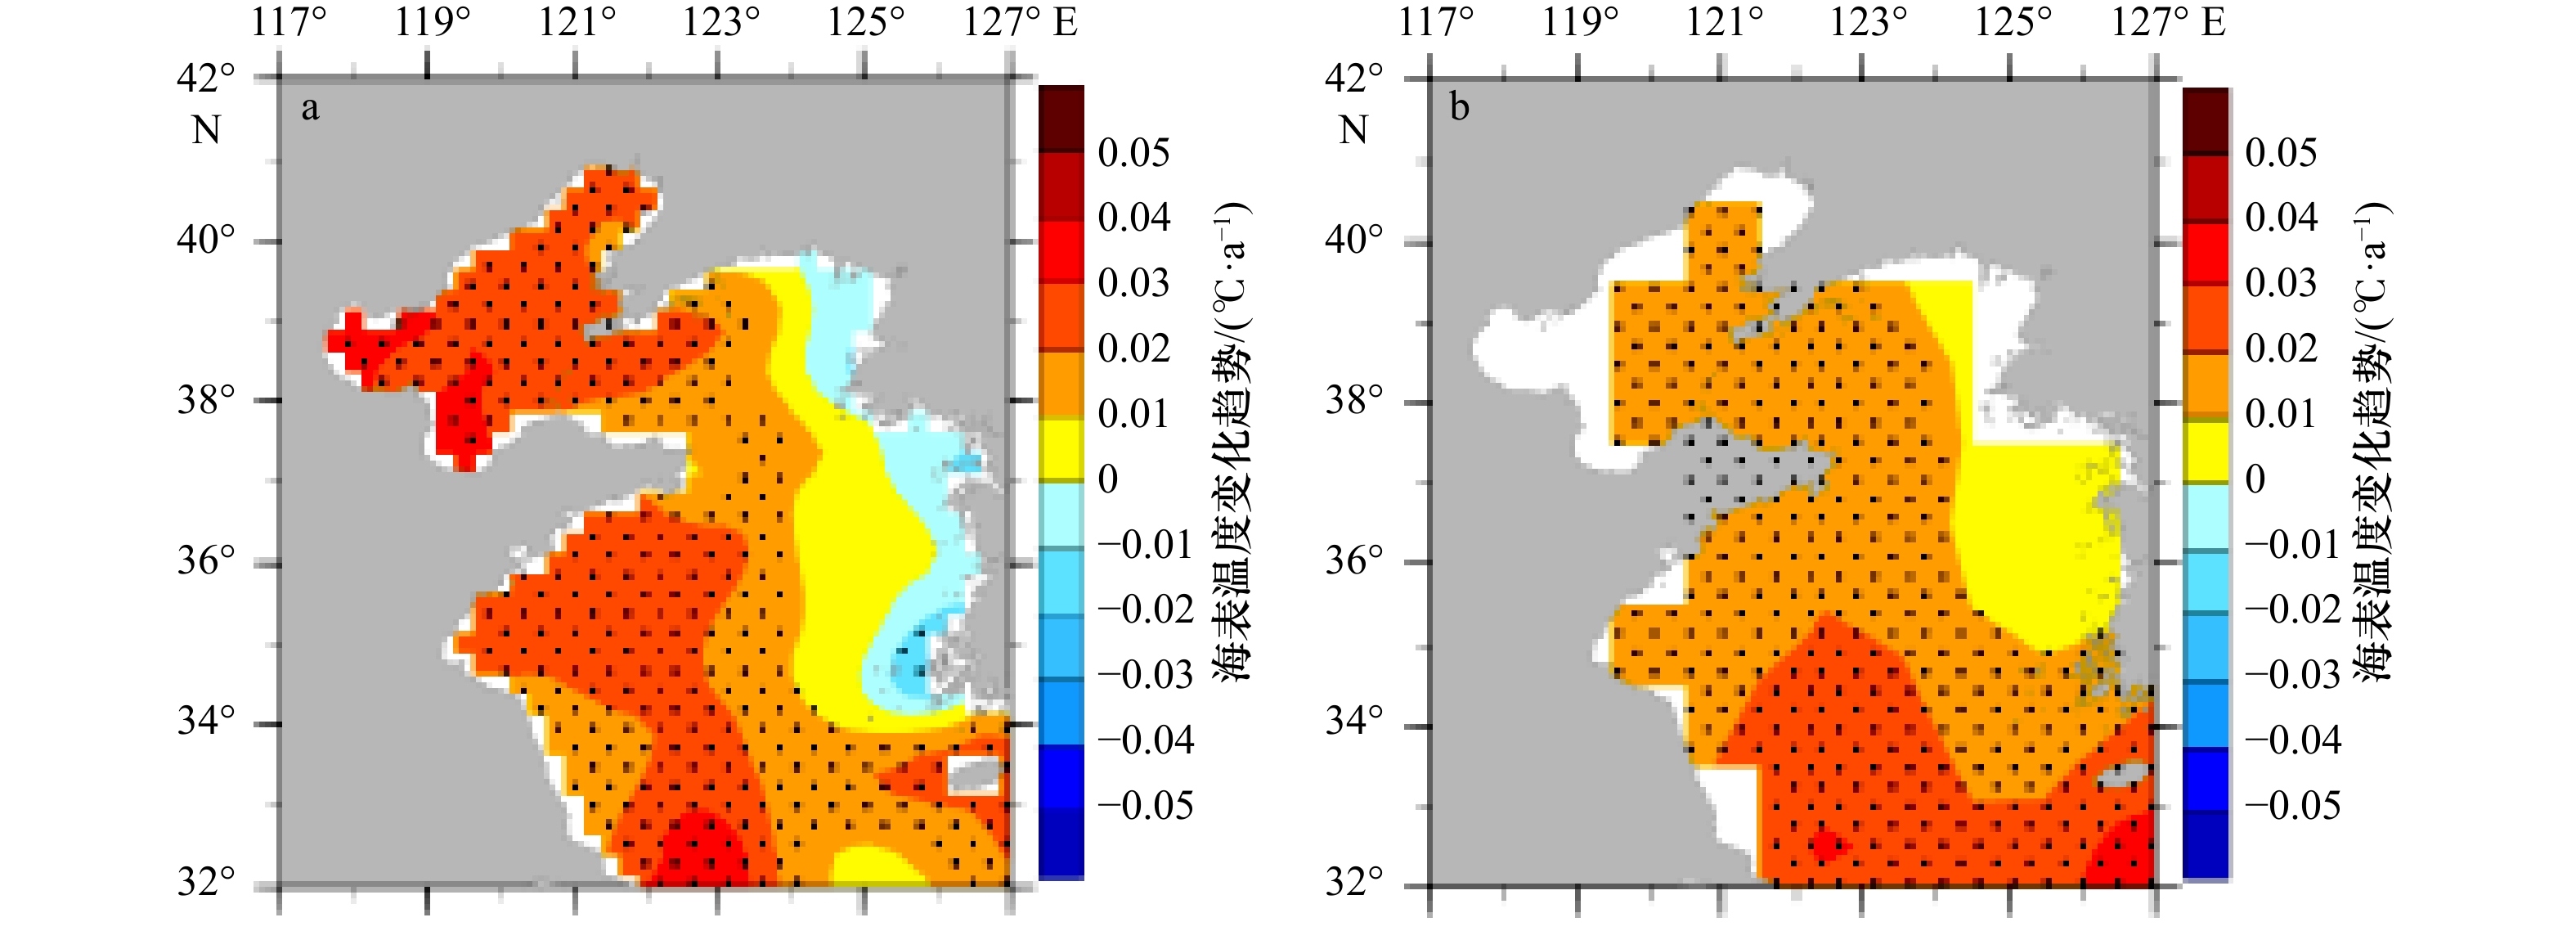
图 7 1982–2019年渤、黄海年平均海表温度的变化趋势
a. OISST海表温度资料;b. Hadley中心海表温度资料。黑点代表变化趋势通过95%信度检验
Fig. 7 Trends of the annual mean sea surface temperature in the Bohai Sea and Yellow Sea from 1982 to 2019
a. Sea surface temperature data from OISST; b. sea surface temperature data from Hadley Center in England. The black dots indicate the area where the trends of SST are significant with a 95% confidence level

图 8 1982–2019年渤、黄海区域3种等级海洋热浪年平均发生频次变化趋势
Fig. 8 Trends of 3 marine heat wave categories frequence in the Bohai Sea and Yellow Sea from 1982 to 2019

图 9 海洋热浪低频时期(1984–1993年)(a,c,e)和海洋热浪高频时期(2001−2010年)(b,d,f)合成得到的高层(500 hPa)−中层(850 hPa)−低层(1 000 hPa)位势高度(等值线,单位:gpm)和位势高度距平场(阴影,单位:gpm)及低频时期(g)和高频时期(h)的地面太阳短波辐射通量距平(蓝色阴影为小于−2 W/(m2·s)的区域;黄色阴影为大于2 W/(m2·s)的区域;等值线间隔为2 W/(m2·s))
Fig. 9 Composite circulation of 500 hPa, 850 hPa, 1 000 hPa geopotential height and anomalies for summer of the years of low-frequency (1984–1993) (a, c, e) and for summer of the years of high-frequency (2001–2010) (b, d, f) (unit: gpm); ground solar shortwave radiation flux anomalies for summer of the years of low-frequency (g) (blue shaded area: lower than –2 W/(m2·s)) and high-frequency (h) (yellow shaded area: higher than 2 W/(m2·s))
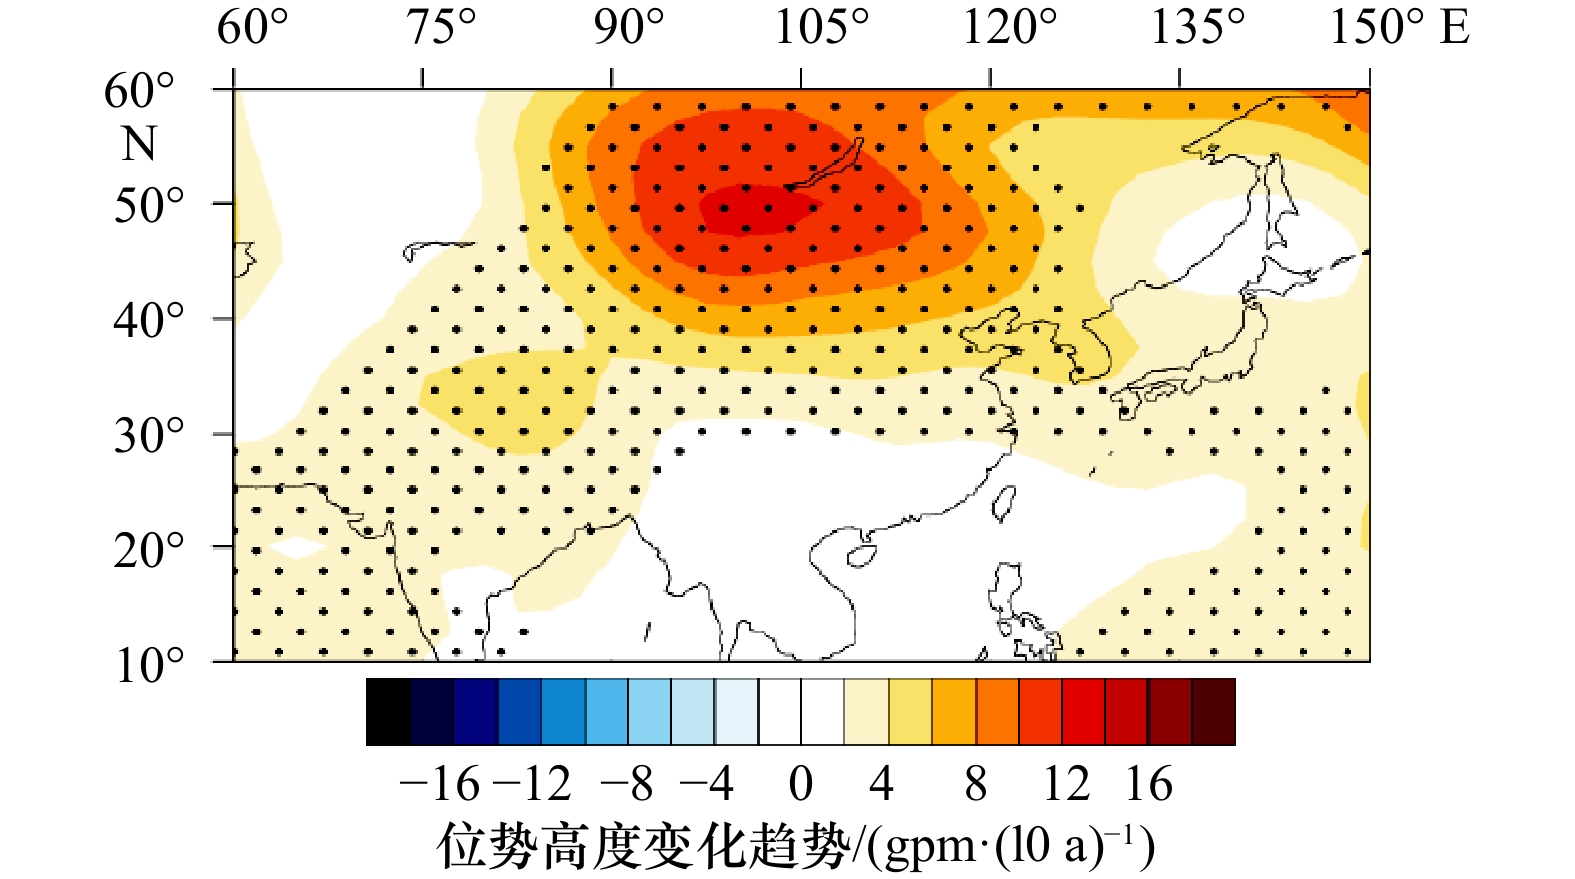
图 10 1982–2019年夏季500 hPa位势高度场的变化趋势
黑点代表变化趋势通过95%信度检验
Fig. 10 Spatial Trends of 500 hPa geopotential height insummer from 1982 to 2019
The black dots indicate the area where the trends are significant witha 95% confidence level
表 1 海洋热浪指标定义
Tab. 1 Definitions of marine heat wave indices
极端指标 英文名称 定义 单位 频次 frequency 每年发生的热浪次数 次数 持续时间 duration 某次热浪过程中日海温距平超
过极端高温阈值的总天数d 平均强度 mean intensity 某次热浪持续期间平均海温距平值 ℃ 最大强度 max intensity 某次热浪持续期间最大海温距平值 ℃  下载: 导出CSV
-
[1] Abram N, Adler C, Bindoff N L, et al. Summary for policymakers. In: IPCC special report on the ocean and cryosphere in a changing climate[R]. Geneva: IPCC, 2019. [2] Oliver E C J, Lago V, Hobday A J, et al. Marine heatwaves off eastern Tasmania: Trends, inter-annual variability, and predictability[J]. Progress in Oceanography, 2018, 161(2): 116−130. [3] Hobday A J, Alexander, L V, Perkins S E, et al. A hierarchical approach to defining marine heatwaves[J]. Progress in Oceanography, 2016, 141: 227−238. doi: 10.1016/j.pocean.2015.12.014 [4] Frölicher T L, Laufkötter C. Emerging risks from marine heat waves[J]. Nature Communications, 2018, 9(1): 1−4. doi: 10.1038/s41467-018-03163-6 [5] Hughes T P, Kerry J, Álvarez-Noriega M, et al. Global warming and recurrent mass bleaching of corals[J]. Nature, 2017, 543(7645): 373−377. doi: 10.1038/nature21707 [6] Wernberg T, Bennett S, Babcock R C, et al. Climate-driven regime shift of a temperate marine ecosystem[J]. Science, 2016, 353(6295): 169. doi: 10.1126/science.aad8745 [7] Wernberg T, Smale D A, Tuya F, et al. An extreme climatic event alters marine ecosystem structure in a global biodiversity hotspot[J]. Nature Climate Change, 2013, 3(1): 78−82. doi: 10.1038/nclimate1627 [8] Mills K E, Pershing A J, Brown C J, et al. Fisheries management in a changing climate: Lessons from the 2012 ocean heat wave in the Northwest Atlantic[J]. Oceanography, 2013, 26(2): 191−195. [9] Kim J Y, Han I S. Sea surface temperature time lag due to the extreme heat wave of August 2016[J]. Journal of the Korean Society of Marine Environment and Safety, 2017, 23 (6): 677–683. [10] Li Yan, Ren Guoyu, Wang Qingyuan, et al. More extreme marine heatwaves in the China seas during the global warming hiatus[J]. Environmental Research Letters, 2019, 14(10): 1−10. [11] Scannell H A, Pershing A J, Alexander M A, et al. Frequency of marine heatwaves in the North Atlantic and North Pacific since 1950[J]. Geophysical Research Letters, 2016, 43(5): 2069−2076. [12] Darmaraki S, Somot S, Sevault F, et al. Future evolution of marine heatwaves in the Mediterranean Sea[J]. Climate Dynamics, 2019, 53(3/4): 1371−1392. doi: 10.1007/s00382-019-04661-z [13] Wu Lixin, Cai Wenju, Zhang Liping, et al. Enhanced warming over the global subtropical western boundary currents[J]. Nature Climate Change, 2012, 2: 161–166. [14] Lee S, Park M S, Kwon M, et al. Two major modes of East Asian marine heatwaves[J]. Environmental Research Letters, 2020, 15(7): 074008. doi: 10.1088/1748-9326/ab8527 [15] Yao Yulong, Wang Junjie, Yin Jianjun, et al. Marine heatwaves in China’s marginal seas and adjacent offshore waters: Past, present, and future[J]. Journal of Geophysical Research: Oceans, 2020, 125: e2019JC015801. [16] 缪予晴, 徐海明, 刘佳伟. 西北太平洋夏季海洋热浪的变化特征及海气关系[J]. 热带海洋学报, 2021, 40(1): 31−43.Miao Yuqing, Xu Haiming, Liu Jiawei. Variations of summer marine heat waves in the Northwest Pacific and associated air-sea interaction[J]. Journal of Tropical Oceanography, 2021, 40(1): 31−43. [17] Hobday A J, Oliver E C J, Sen Gupta A, et al. Categorizing and naming marine heatwaves[J]. Oceanography, 2018, 31(2): 1−13. [18] Belkin I M. Rapid warming of large marine ecosystems[J]. Progress in Oceanography, 2009, 81(1/4): 207−213. doi: 10.1016/j.pocean.2009.04.011 [19] Pei Yuhua, Liu Xiaohui, He Hailun. Interpreting the sea surface temperature warming trend in the Yellow Sea and East China Sea[J]. Science China Earth Sciences, 2017, 8: 1558−1568. [20] 孙中之, 高文斌, 孟维东, 等. 黄渤海区张网渔业[J]. 渔业科学进展, 2012, 33(3): 94−101.Sun Zhongzhi, Gao Wenbin, Meng Weidong, et al. Stow net fishery in the Yellow Sea and Bohai Sea area[J]. Progress in Fishery Sciences, 2012, 33(3): 94−101. [21] Banzon V, Smith T M, Chin T M, et al. A long-term record of blended satellite and in situ sea-surface temperature for climate monitoring, modeling and environmental studies[J]. Earth System Science Data, 2016, 8(1): 165−176. doi: 10.5194/essd-8-165-2016 [22] Reynolds R W, Smith T M, Liu C, et al. Daily high-resolution-blended analyses for sea surface temperature[J]. Journal of Climate, 2007, 20(22): 5473−5496. doi: 10.1175/2007JCLI1824.1 [23] Knapp K R, Ansari S, Bain C L, et al. Globally gridded satellite observations for climate studies[J]. Bulletin of the American Meteorological Society, 2011, 92: 893−907. doi: 10.1175/2011BAMS3039.1 [24] Rayner N A, Parker D E, Horton E B, et al. Global analyses of sea surface temperature, sea ice, and night marine air temperature since the late nineteenth century[J]. Journal of Geophysical Research, 2003, 108(D14): 1063−1082. [25] Kalnay E, Kanamitsu R, Kistler W, et al. The NCEP/NCAR 40-year reanalysis project[J]. Bulletin of the American Meteorological Society, 1996, 77(3): 437−471. doi: 10.1175/1520-0477(1996)077<0437:TNYRP>2.0.CO;2 [26] Frolicher T L, Fischer E M, Gruber N. Marine heatwaves under global warming[J]. Nature, 2018, 560(7718): 360−364. doi: 10.1038/s41586-018-0383-9 [27] Benthuysen J A, Oliver E C J, Feng M, et al. Extreme marine warming across tropical Australia during austral summer 2015–2016[J]. Journal of Geophysical Research, 2018, 123(2): 1301−1326. [28] Oliver Eric C J. Mean warming not variability drives marine heatwaves trends[J]. Climate Dynamics, 2019, 53(3/4): 1653−1659. doi: 10.1007/s00382-019-04707-2 [29] Kim S J, Woo S H, Kim B M, et al. Trends in sea surface temperature (SST) change near the Korean peninsula for the past 130 years[J]. Ocean and Polar Research, 2016, 33(3): 281−290. [30] Benthuysen J A, Feng M , Zhong L, et al. Spatial patterns of warming off Western Australia during the 2011 Ningaloo Niño: Quantifying impacts of remote and local forcing[J]. Continental Shelf Research, 2014, 91 (S C): 232–246. [31] Bond N A, Cronin M F, Freeland H ,et al . Causes and impacts of the 2014 warm anomaly in the NE Pacific[J]. Geophysical Research Letters, 2015, 42 (9): 3414–3420. [32] Di Lorenzo E, Mantua N. Multi-year persistence of the 2014/15 North Pacific marine heatwave[J]. Nature Climate Change, 2016, 6 (11): 1042–1047. [33] Cai Rongshuo, Tan Hongjian, Kontoyiannis H. Robust surface warming in offshore China seas and its relationship to the East Asia monsoon wind field and ocean forcing on interdecadal time scales[J]. Journal of Climate, 2017, 30(22): 8987–9005. [34] Wang Shanshan, Yuan Xing, Wu Renguang. Attribution of the persistent spring-summer hot and dry extremes over Northeast China in 2017[J]. Bulletin of the American Meteorological Society, 2019, 100(1): S85–S89. -

计量
- 文章访问数: 751
- HTML全文浏览量: 162
- PDF下载量: 138
- 被引次数: 0
