

Studies of wave-induced stresses under swell-dominated low wind speed condition
-
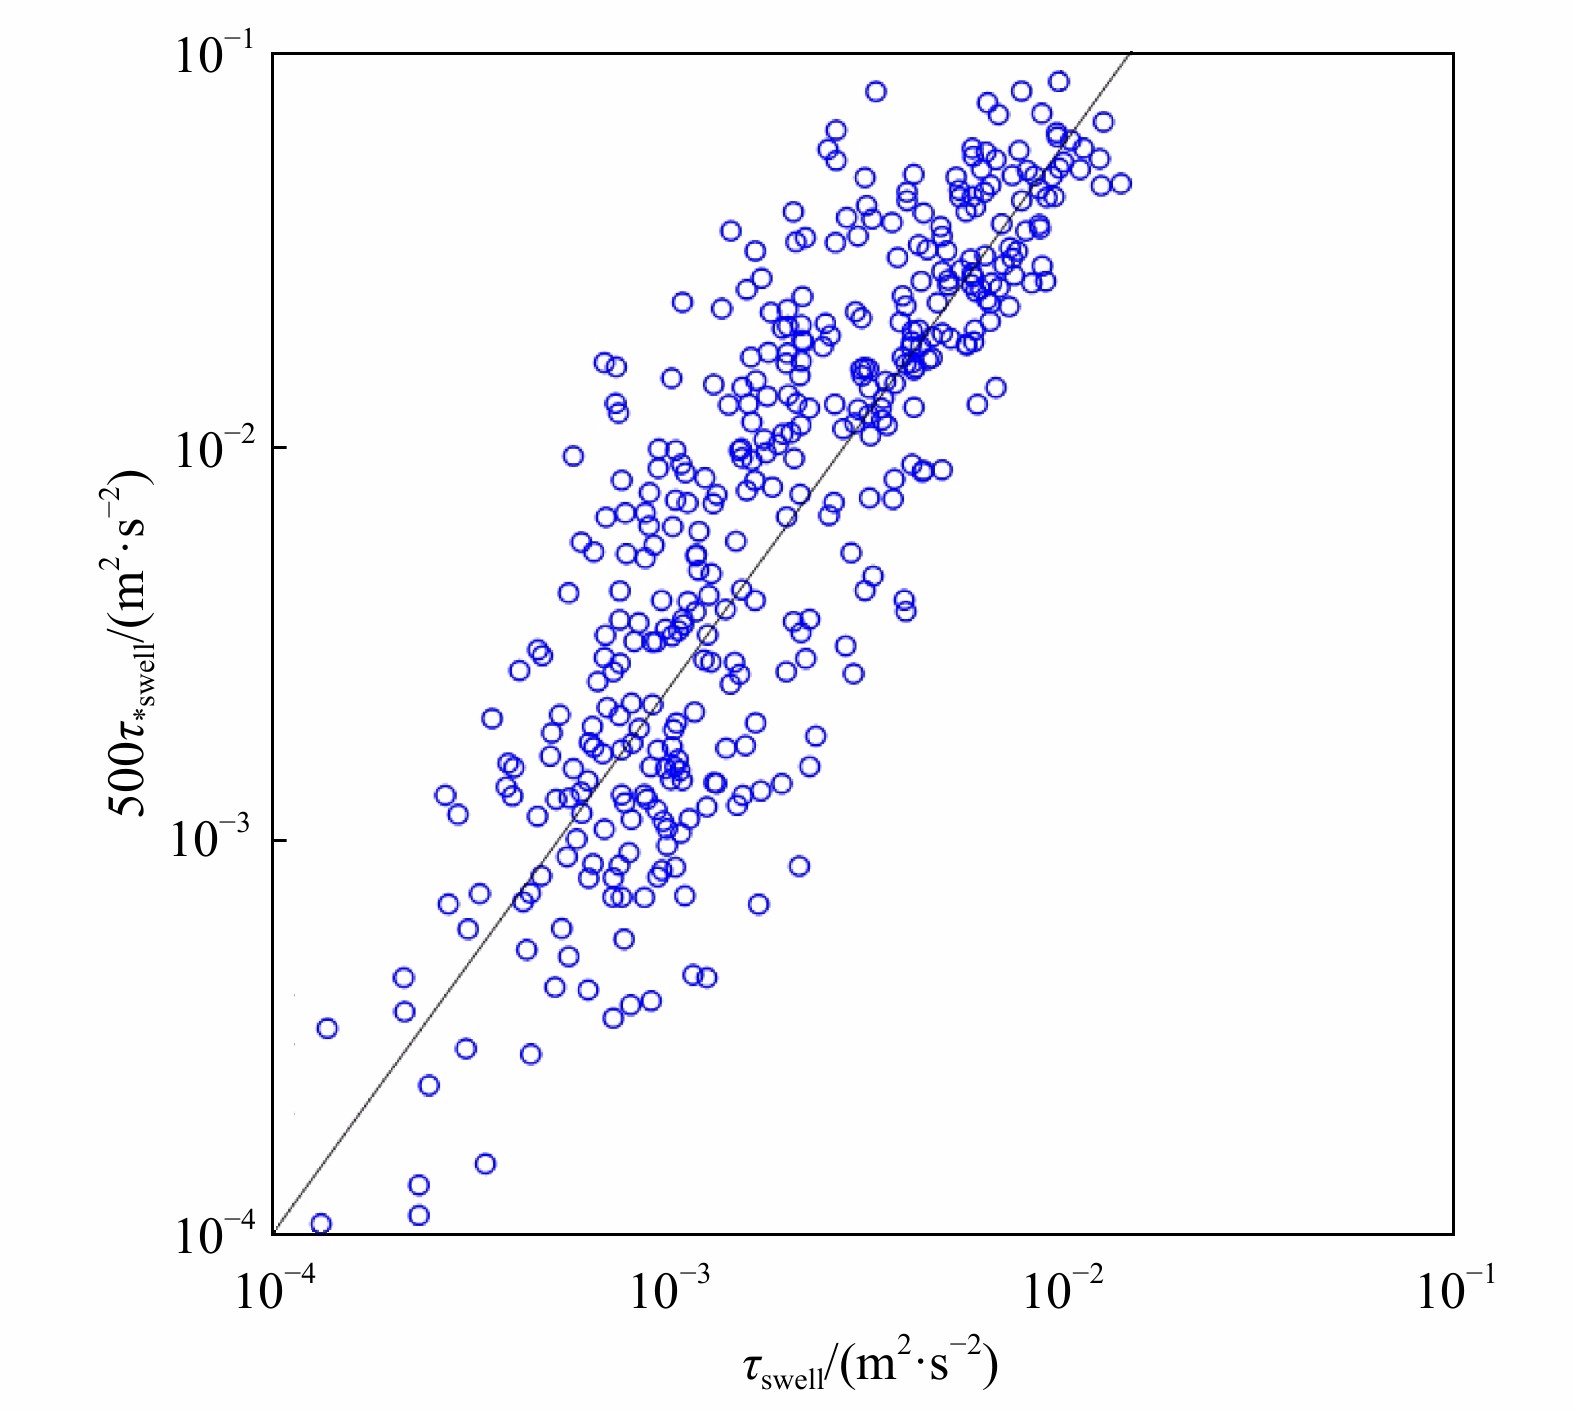
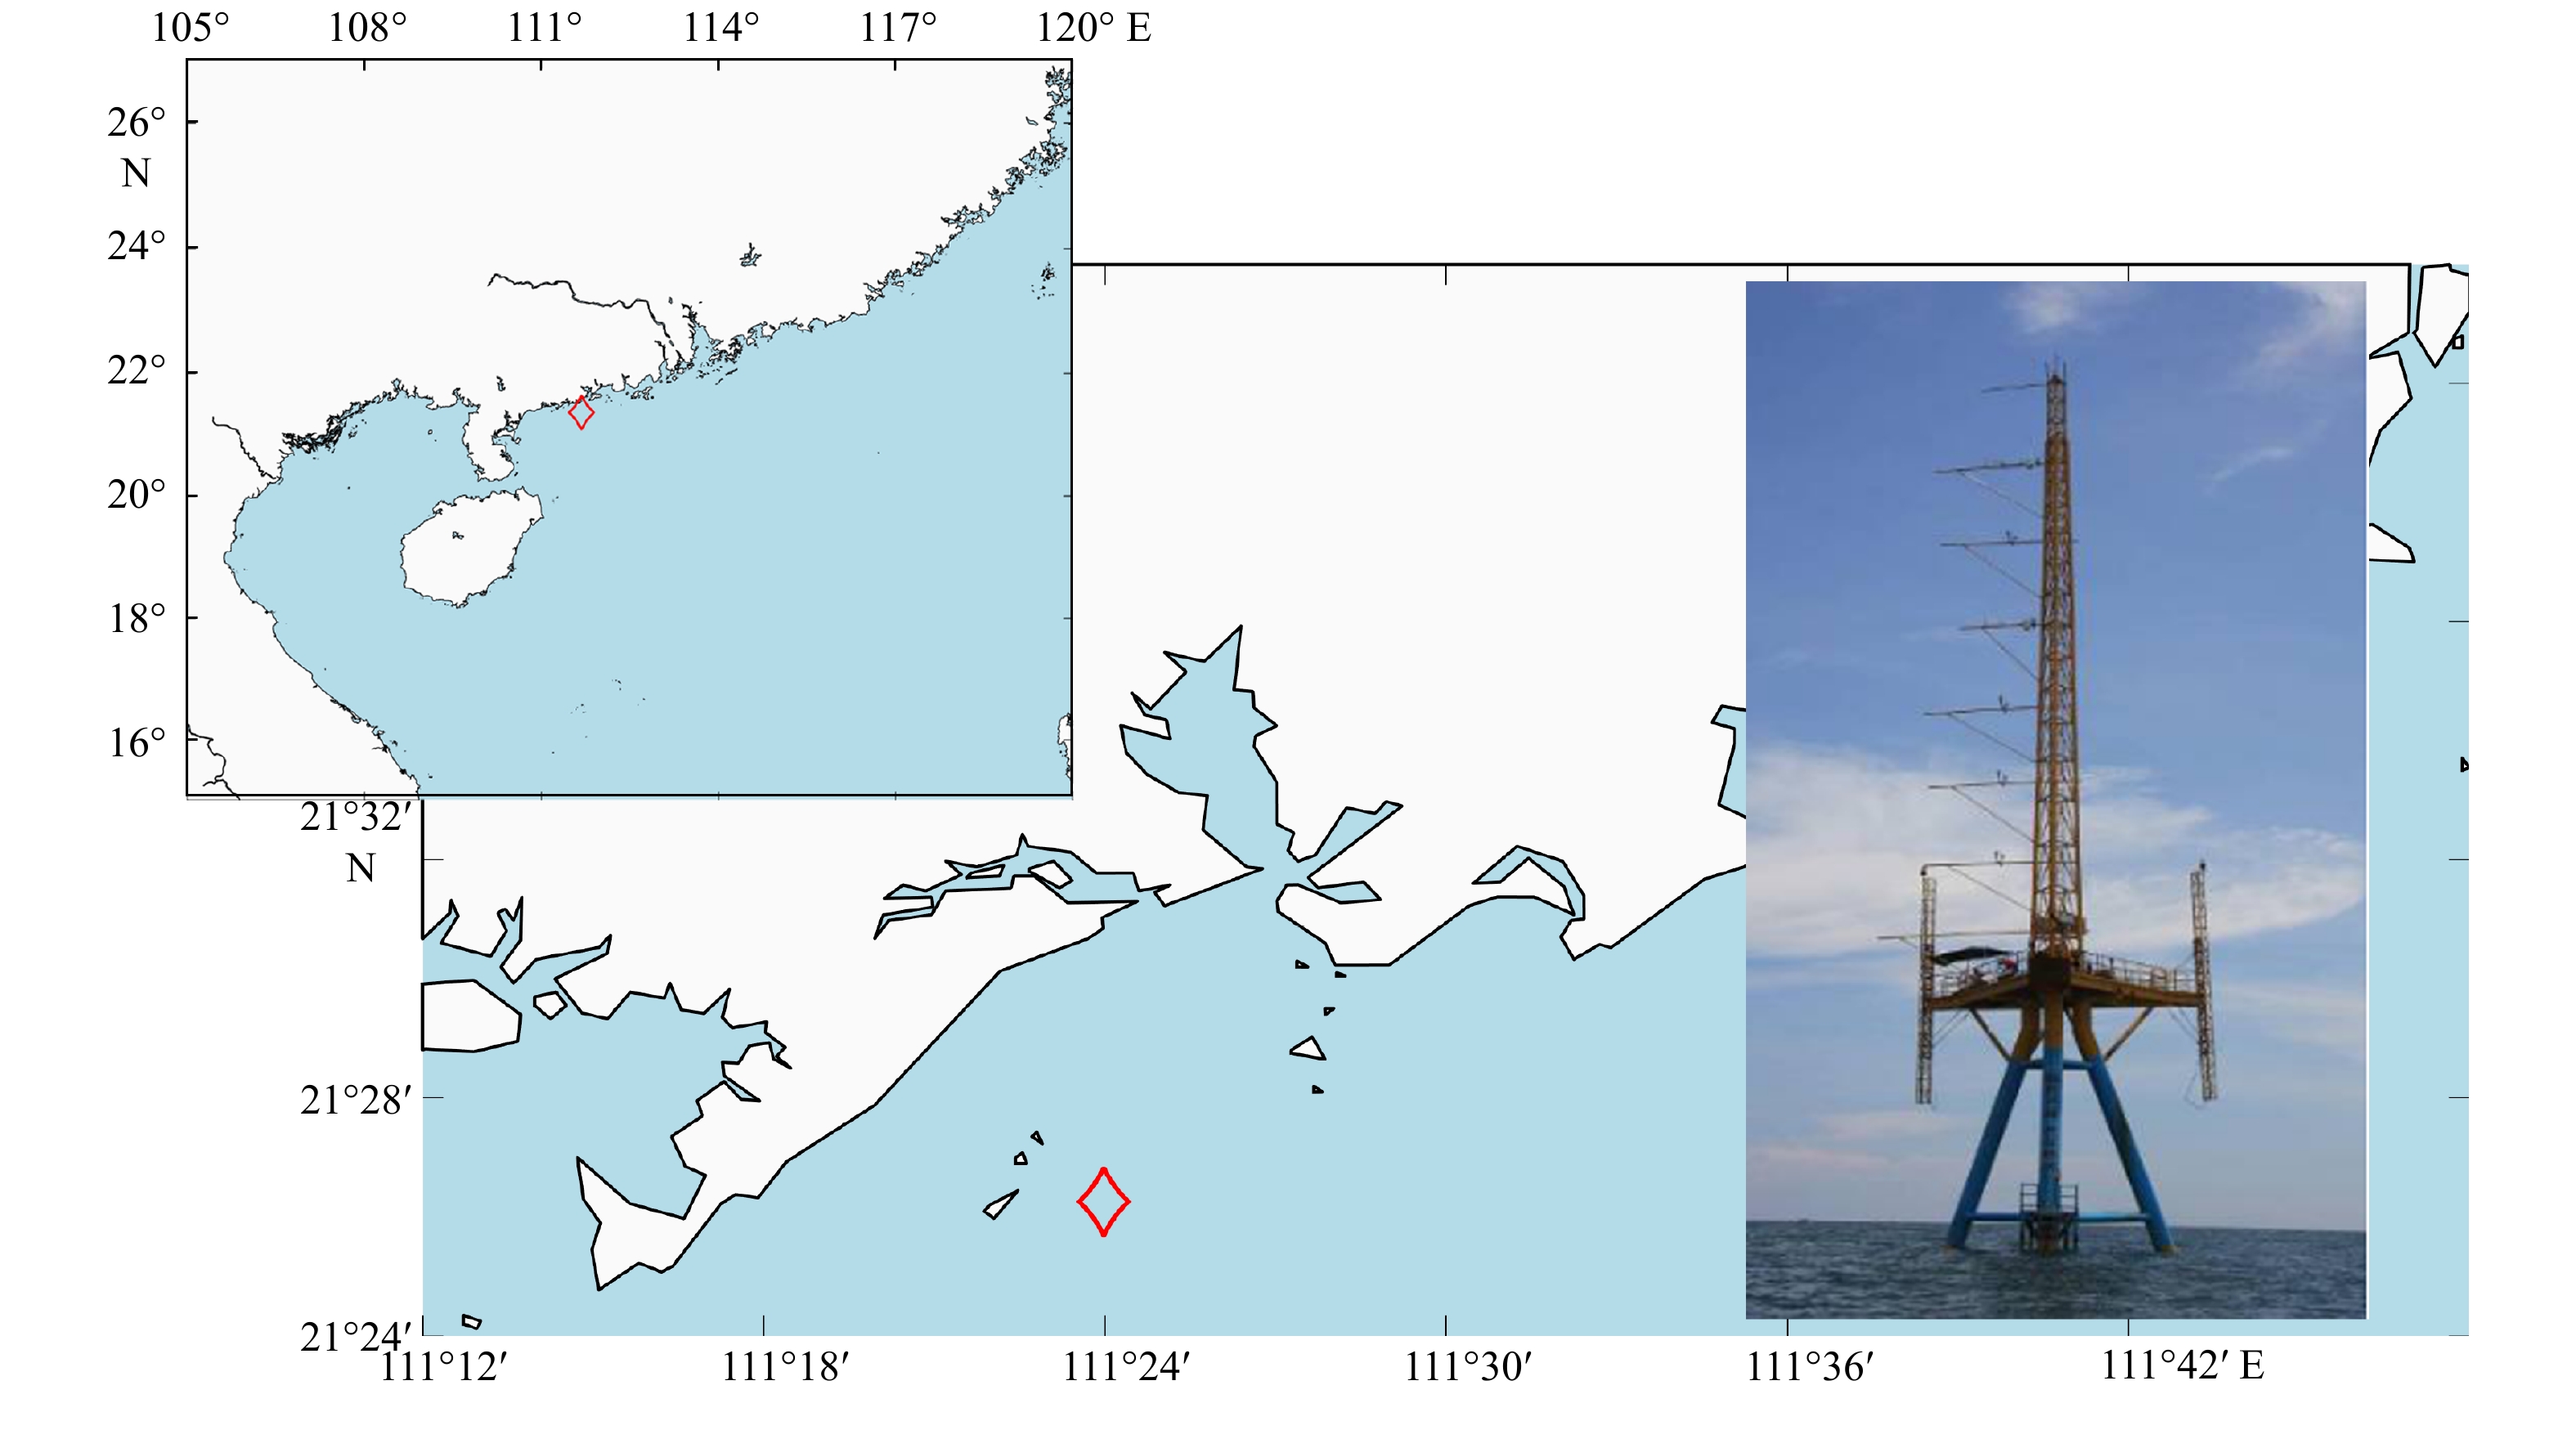
摘要: 本文基于2012年2月15日至5月8日的广东省茂名市附近海上铁塔实测数据,分析了海气边界层的湍流运动。结果证实,在涌浪条件下,协谱和Ogive曲线存在明显受涌浪影响的区域。本文进一步研究,发现浪致雷诺应力的正负符号变化与波龄相关,并给出了顺风向和侧风向浪致雷诺应力正负符号反转时波龄的统计分布。此外,本文基于协谱法提取了浪致雷诺应力τswell,并与传统方法得到的浪致雷诺应力τ*swell做比较。结果表明,整体上τswell比τ*swell大2~3个量级,这意味着传统方法显著低估了涌浪的浪致雷诺应力,传统的浪致雷诺应力计算方法还有待改进。Abstract: Data measured by ultrasonic anemometer moored at a fixed platform near Maoming City, Guangdong Province from February 15 to May 8, 2012 has been used to analyze turbulence within wave boundary layer. The results confirmed that under swell conditions, there are areas obviously affected by swell in the cospectrum and Ogive curves. Furthermore, the sign change of wave-induced Reynolds stress is related to wave age. This paper presents the statistical distribution of the sign reversal of the Reynolds stress caused by the waves in the along-wind and cross-wind directions with wave age. In addition, this paper extracts the wave-induced Reynolds stress τswell based on cospectrum method, and compares it with the wave-induced Reynolds stress τ*swell calculated by traditional method. The results show that the value of τswell is 2−3 orders of magnitude larger than that of τ*swell, which indicates that the traditional method significantly underestimates the wave-induced Reynolds stress, and the traditional method needs to be improved.
-
Key words:
- swell /
- wave-induced reynolds stress /
- cospectra /
- Ogive curves
-
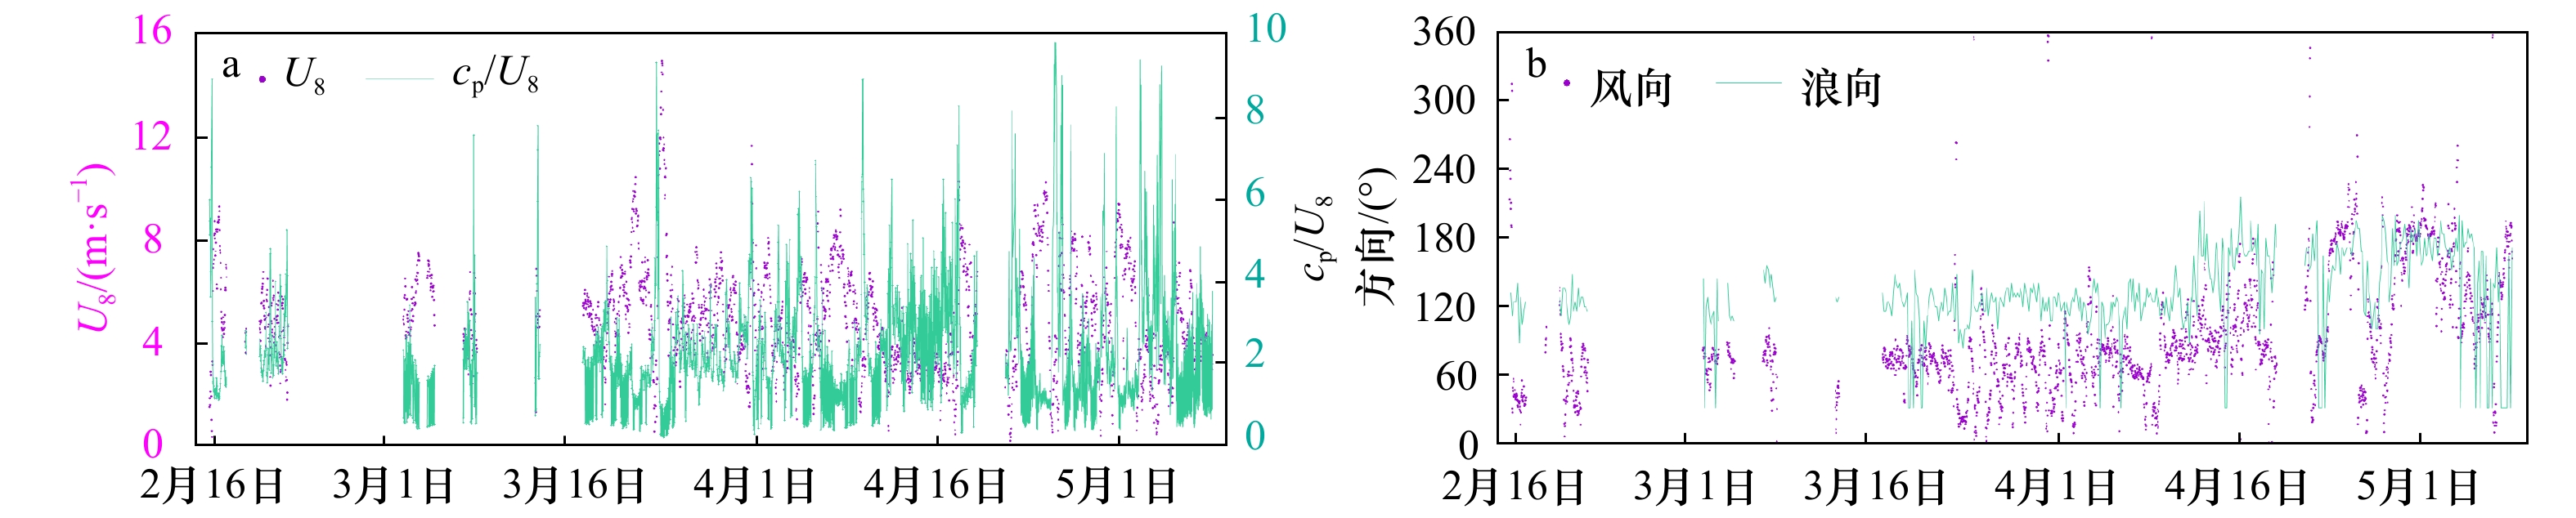
图 2 距平均海平面8 m高度的风速和波龄cp/U8 (a),风向和浪向(b)
Fig. 2 Wind speed at 8 m height above mean sea level and wave age (a), wind direction and wave direction (b)
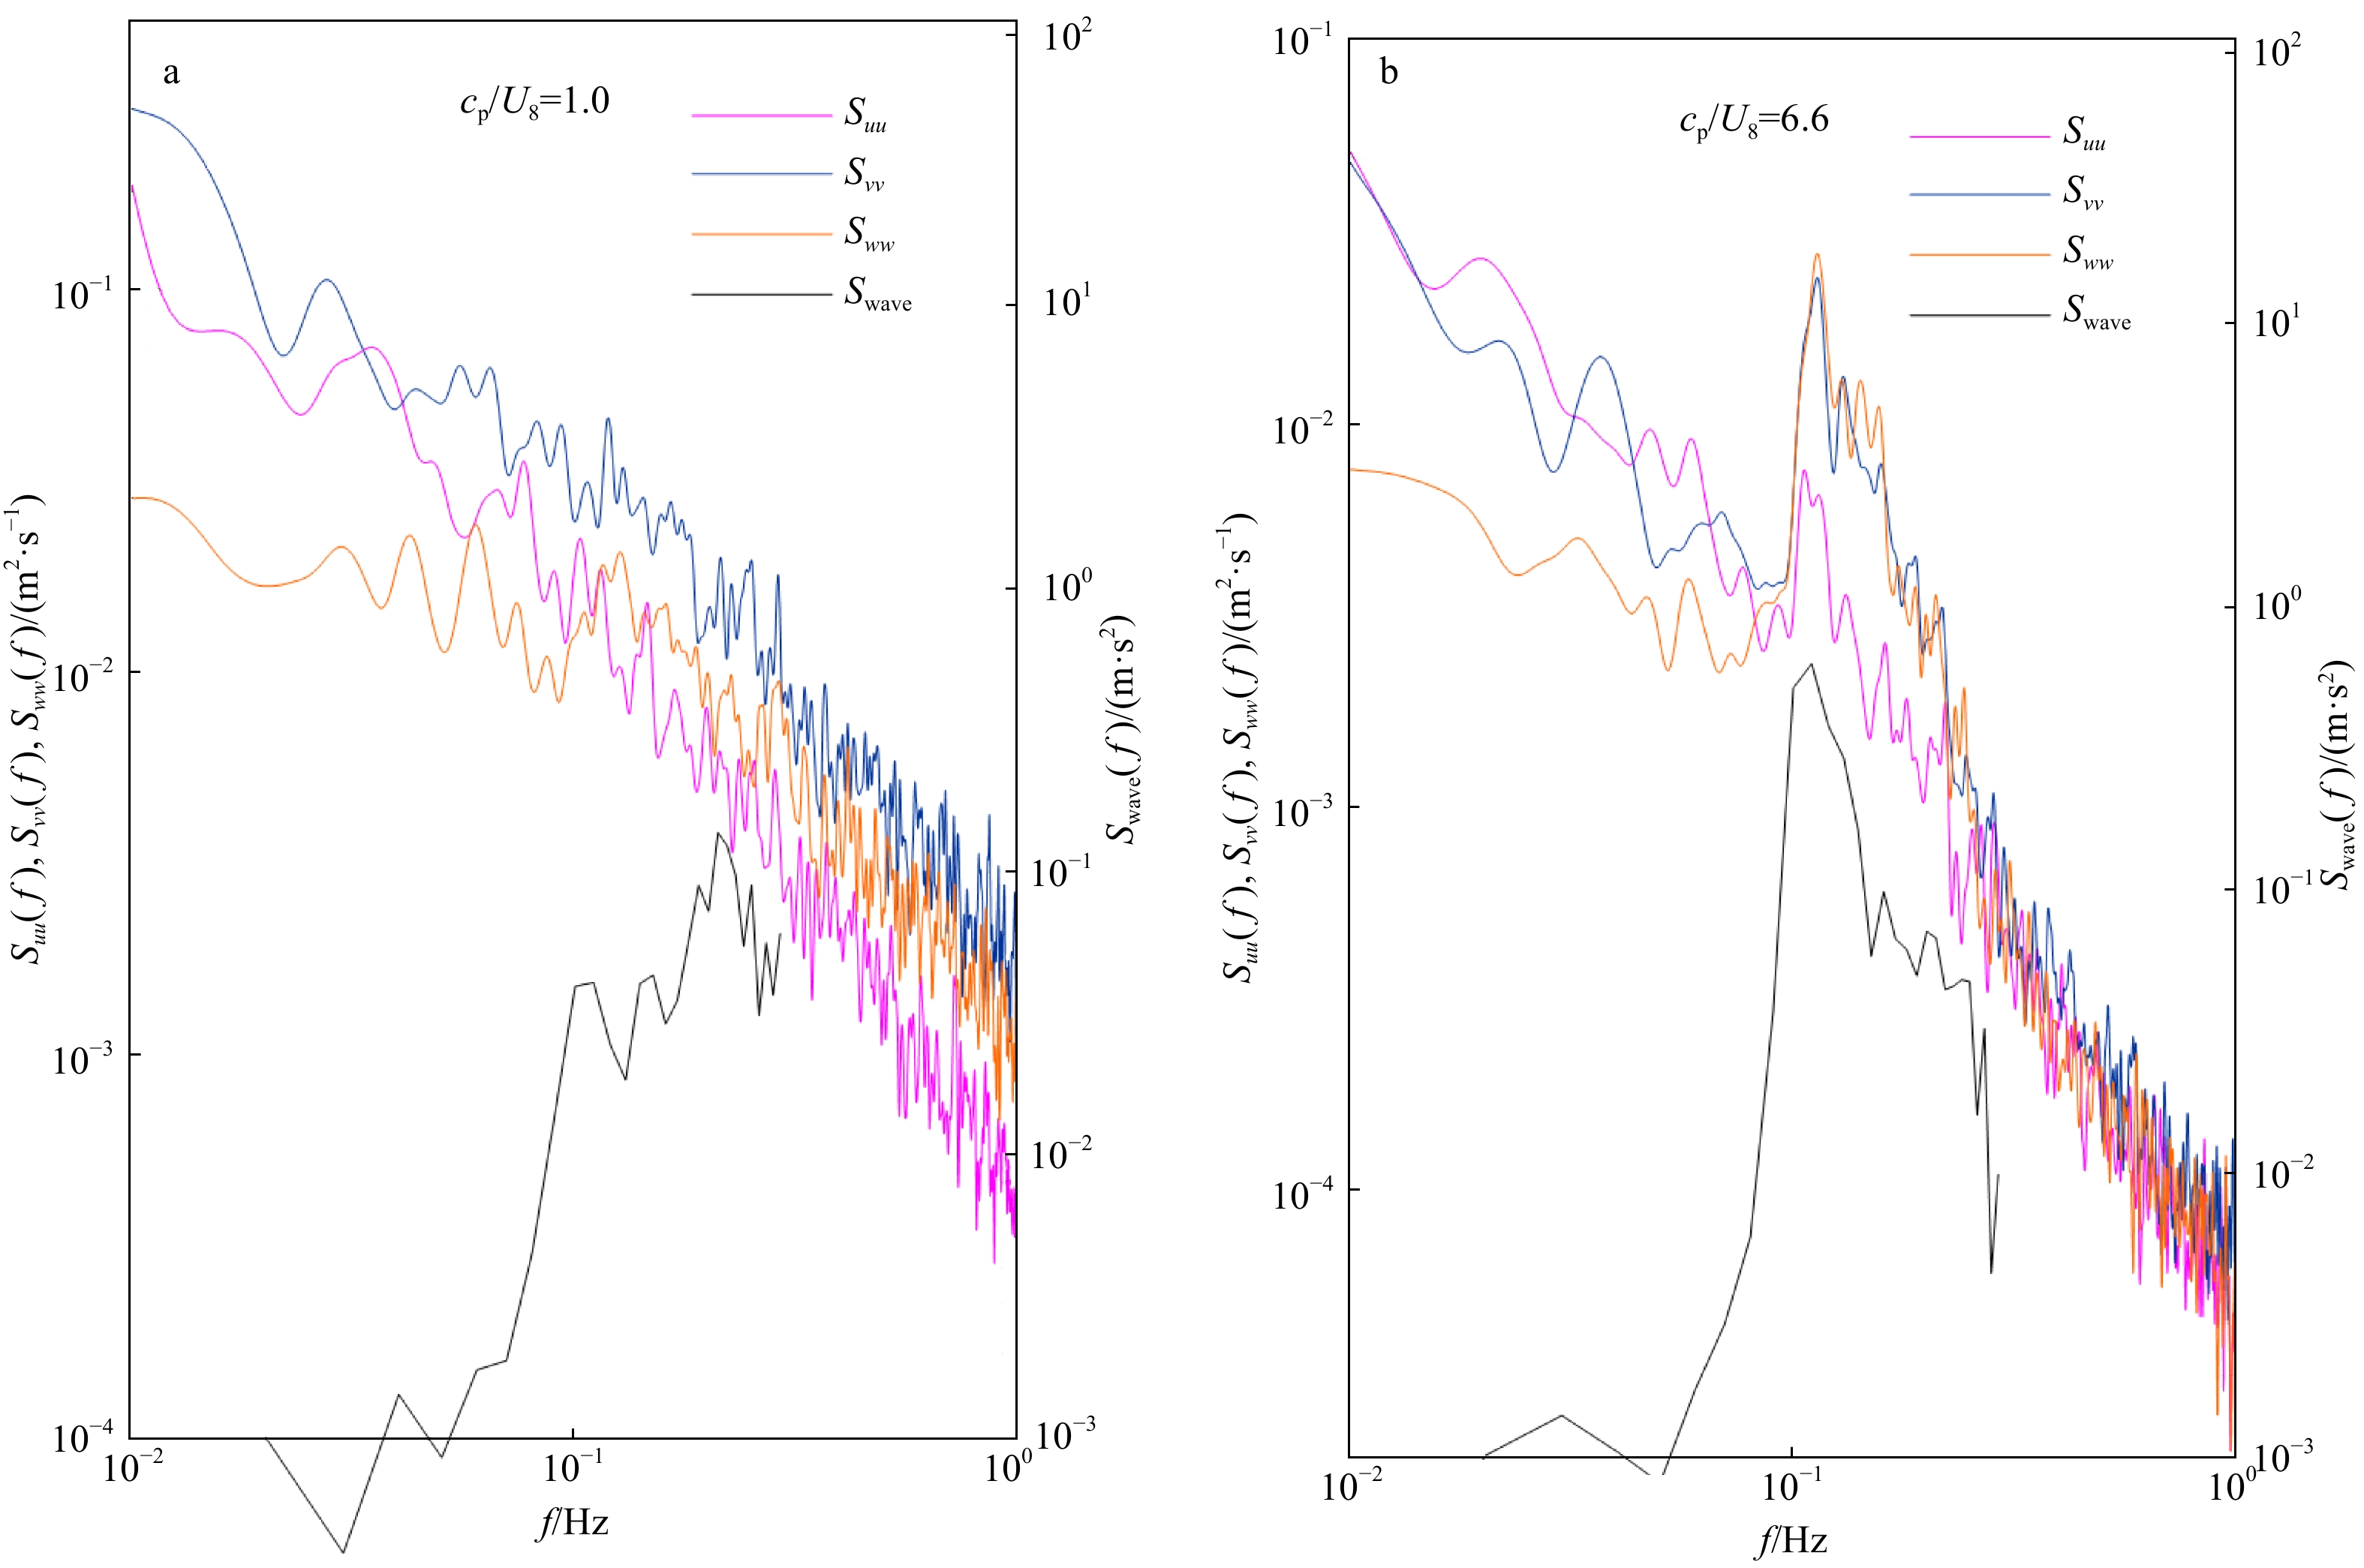
图 3 3个方向的湍流谱和海浪谱
a. 在3月8日9时,波龄cp/U8=1.0,风浪条件下;b. 在4月9日10时,波龄cp/U8=6.6,涌浪条件下。紫红色的线(Suu)、青色的线(Svv)和橘色的线(Sww)分别代表顺风向、侧风向和垂向的湍流谱,黑色的线(Swave)代表海浪谱
Fig. 3 Power spectra in three directions and directional wave spectrum
a. Under wind sea at 9 o’clock on March 8 when wave age cp/U8=1.0; b. under swell conditions at 10 o’clock on April 9 when wave age cp/U8=6.6. The magenta line (Suu), cyan line (Svv), and orange line (Sww) represent longitudinal, lateral, and vertical wind power spectra, respectively. The black line (Swave) represents wave spectra
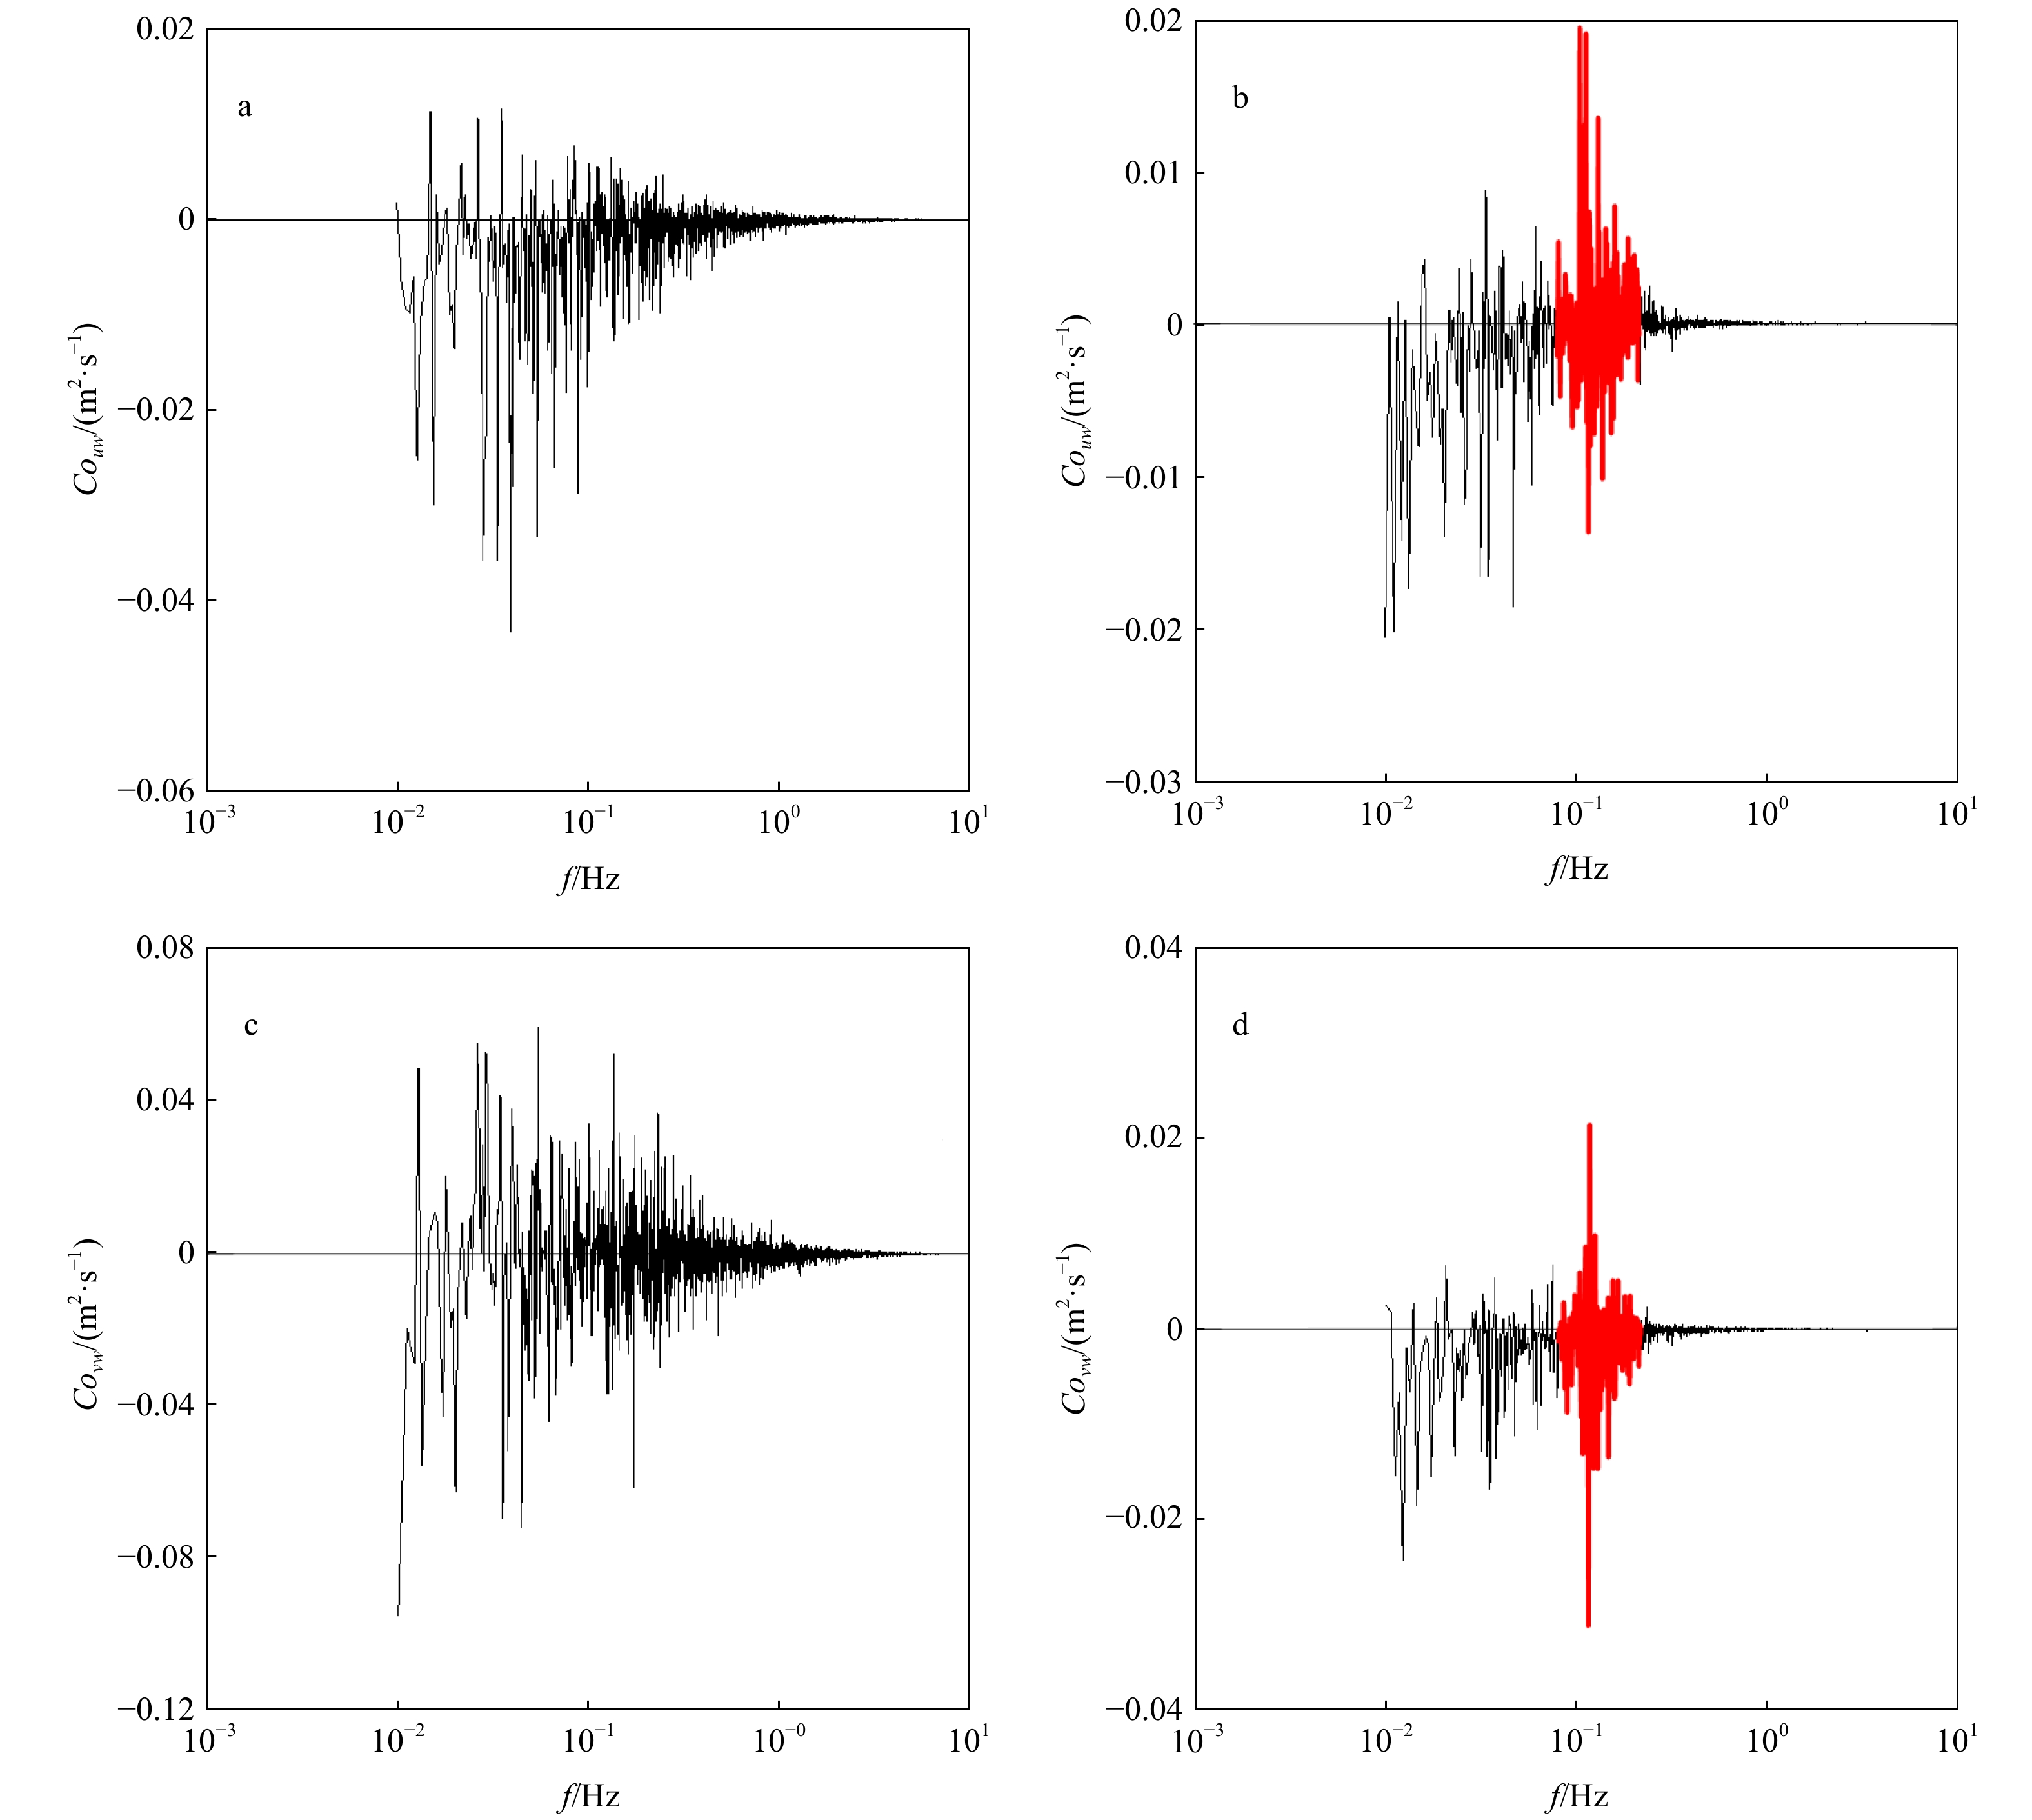
图 4 顺风向(Couw)和侧风向(Covw)的协谱
a和c表示在3月8日9时,风浪条件下;b和d表示在4月9日10时,涌浪条件下。红色的区间代表受涌浪影响的区域
Fig. 4 Along-wind (Couw) and cross-wind (Covw) cospectra
a and c. Under wind sea condition at 9 o’clock on March 8; b and d. under swell condition at 10 o’clock on April 9. The red interval represents the area affected by swell

图 5 Ogive曲线
a. 在3月8日9时,风浪条件下;b. 在4月9日10时,涌浪条件下。绿色的线(Ogx)和蓝色的线(Ogy)分别代表顺风向和侧风向的Ogive曲线。红色区间代表受涌浪影响的区域,与图4对应
Fig. 5 Ogive curve
a. Under wind sea condition at 9 o’clock on March 8; b. under swell condition at 10 o’clock on April 9. The green line (Ogx) and blue line (Ogy) represent longitudinal and lateral Ogive curves. The red interval represents the area affected by swell just like Figure 4
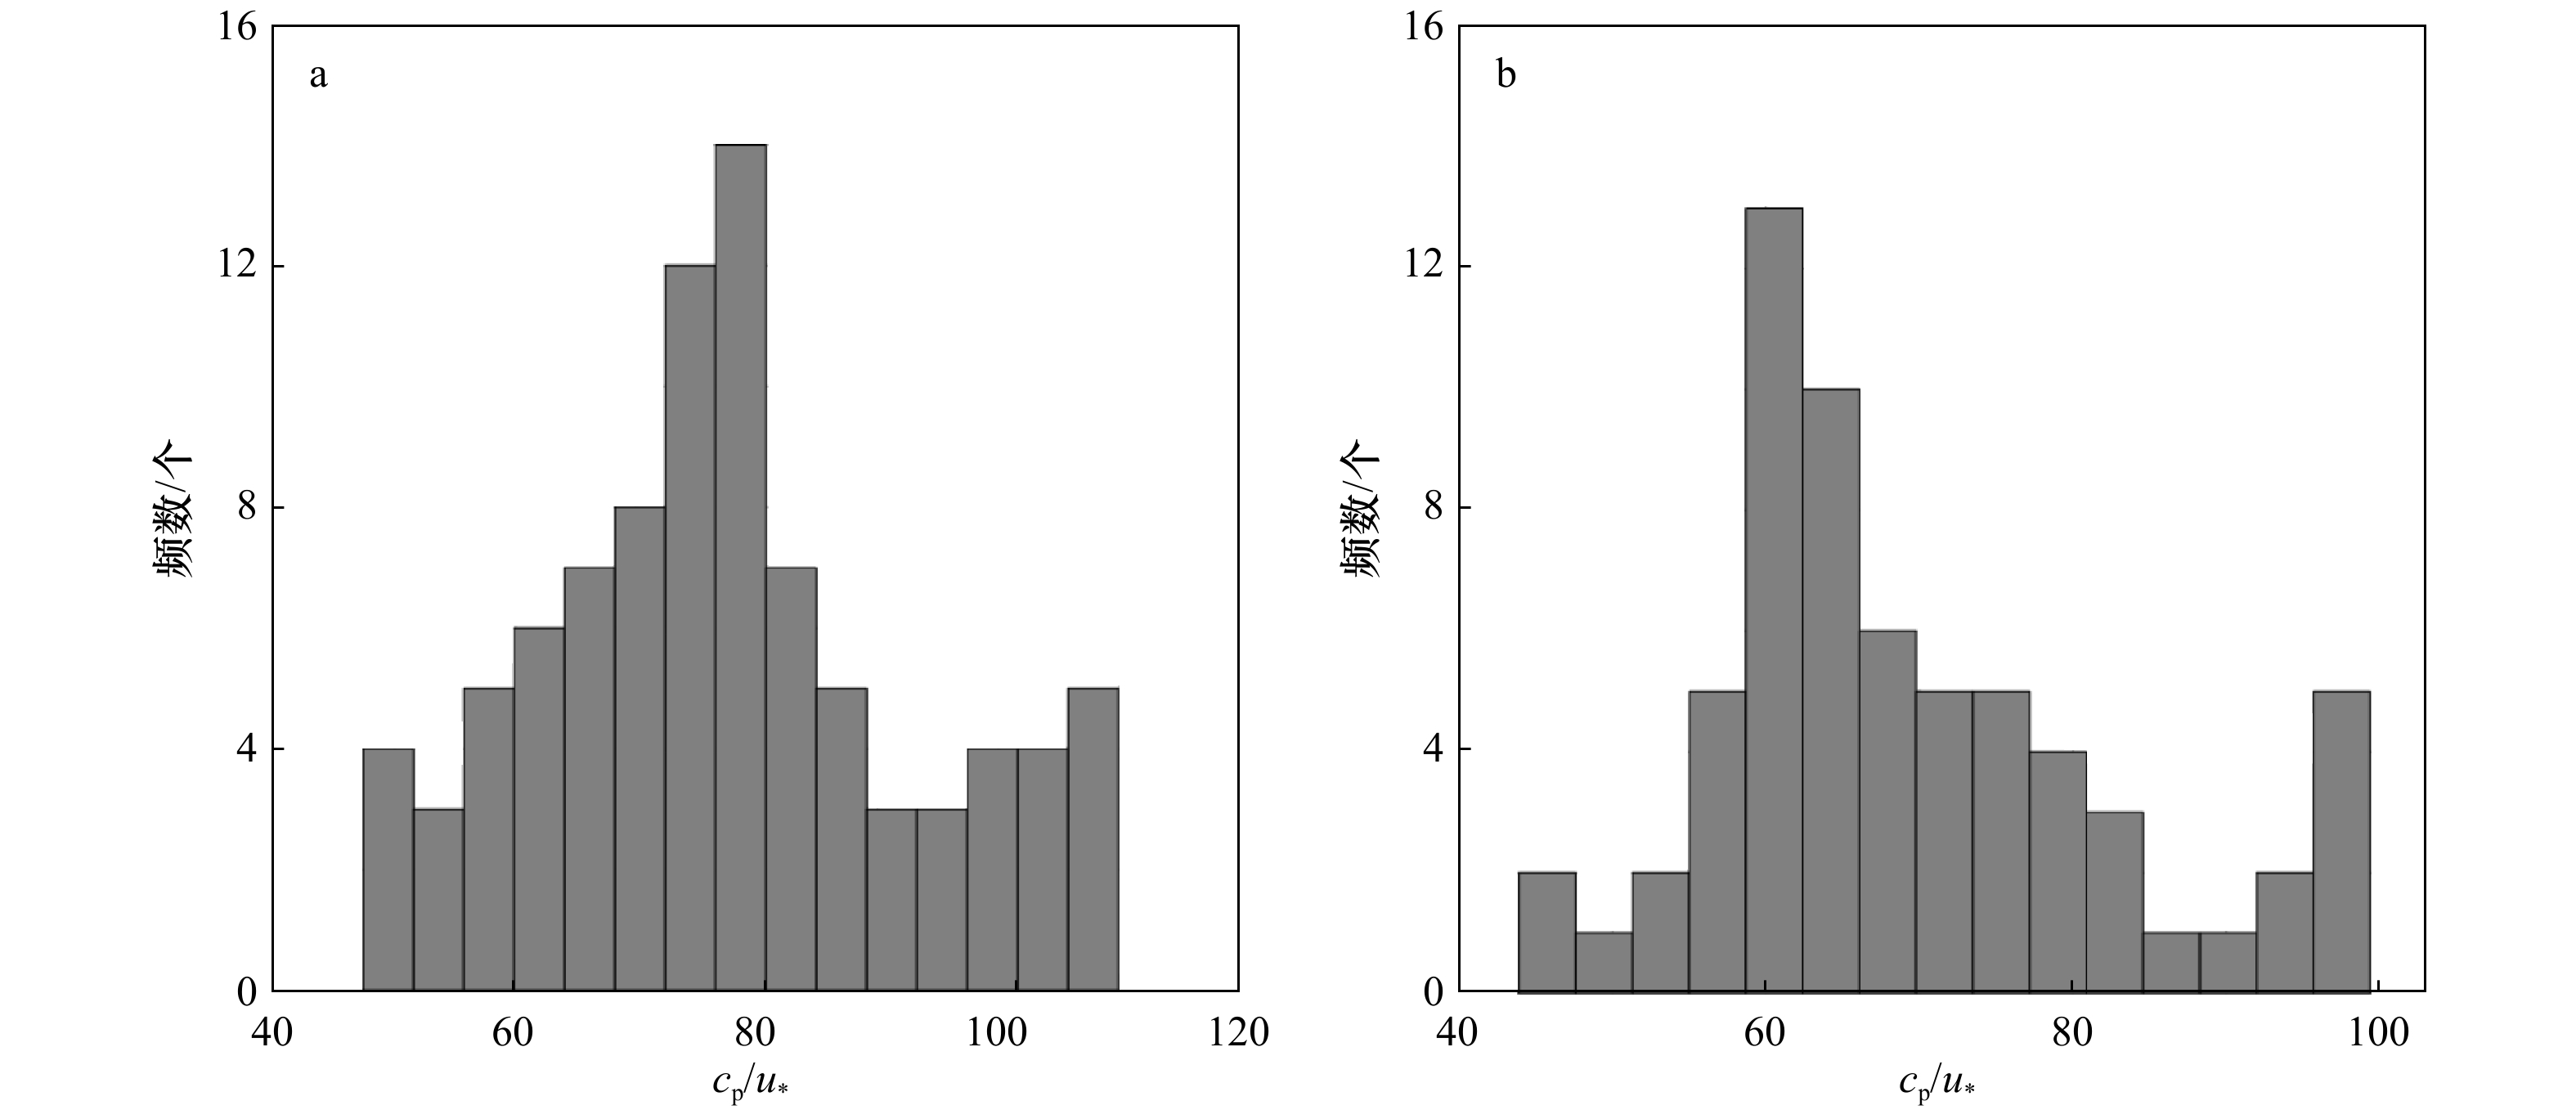
图 6 顺风向(a)和侧风向(b)浪致雷诺应力反转符号时波龄的统计分布
Fig. 6 Statistical distribution of wave age when wave-induced Reynolds stress reverses sign of along-wind (a) and cross-wind (b)
-
[1] Monin A S, Yaglom A M. Statistical Fluid Mechanics[M]. Cambridge: The MIT Press, 1975. [2] Oost W A, Komen G J, Jacobs C M J, et al. New evidence for a relation between wind stress and wave age from measurements during ASGAMAGE[J]. Boundary-Layer Meteorology, 2002, 103(3): 409−438. doi: 10.1023/A:1014913624535 [3] Drennan W M, Graber H C, Hauser D, et al. On the wave age dependence of wind stress over pure wind seas[J]. Journal of Geophysical Research, 2003, 108(C3): 8062. doi: 10.1029/2000JC000715 [4] Drennan W M, Taylor P K, Yelland M J. Parameterizing the sea surface roughness[J]. Journal of Physical Oceanography, 2005, 35(5): 835−848. doi: 10.1175/JPO2704.1 [5] Edson J B, Jampana V, Weller R A, et al. On the exchange of momentum over the open ocean[J]. Journal of Physical Oceanography, 2013, 43(8): 1589−1610. doi: 10.1175/JPO-D-12-0173.1 [6] Smedman A, Högström U, Bergström H, et al. A case study of air-sea interaction during swell conditions[J]. Journal of Geophysical Research: Oceans, 1999, 104(C11): 25833−25851. doi: 10.1029/1999JC900213 [7] Grachev A A, Fairall C W. Upward momentum transfer in the marine boundary layer[J]. Journal of Physical Oceanography, 2001, 31(7): 1698−1711. doi: 10.1175/1520-0485(2001)031<1698:UMTITM>2.0.CO;2 [8] Zou Zhongshui, Li Shuiqing, Huang Jian, et al. Atmospheric boundary layer turbulence in the presence of swell: Turbulent kinetic energy budget, monin-obukhov similarity theory, and inertial dissipation method[J]. Journal of Physical Oceanography, 2020, 50(5): 1213−1225. doi: 10.1175/JPO-D-19-0136.1 [9] Babanin A V, Mcconochie J, Chalikov D. Winds near the surface of waves: Observations and modeling[J]. Journal of Physical Oceanography, 2018, 48(5): 1079−1088. doi: 10.1175/JPO-D-17-0009.1 [10] Voermans J J, Rapizo H, Ma Hongyu, et al. Air-sea momentum fluxes during tropical cyclone Olwyn[J]. Journal of Physical Oceanography, 2019, 49(6): 1369−1379. doi: 10.1175/JPO-D-18-0261.1 [11] Geernaert G L. Measurements of the angle between the wind vector and wind stress vector in the surface layer over the North Sea[J]. Journal of Geophysical Research, 1988, 93(C7): 8215−8220. doi: 10.1029/JC093iC07p08215 [12] Grachev A A, Fairall C W, Hare J E, et al. Wind stress vector over ocean waves[J]. Journal of Physical Oceanography, 2003, 33(11): 2408−2429. doi: 10.1175/1520-0485(2003)033<2408:WSVOOW>2.0.CO;2 [13] Zhang F W, Drennan W M, Haus B K, et al. On wind-wave-current interactions during the shoaling waves experiment[J]. Journal of Geophysical Research: Oceans, 2009, 114(C1): C01018. [14] Zou Zhongshui, Song Jinbao, Li Peiliang, et al. Effects of swell waves on atmospheric boundary layer turbulence: A low wind field study[J]. Journal of Geophysical Research: Oceans, 2019, 124(8): 5671−5685. doi: 10.1029/2019JC015153 [15] Chen Gang, Belcher S E. Effects of long waves on wind-generated waves[J]. Journal of Physical Oceanography, 2000, 30(9): 2246−2256. doi: 10.1175/1520-0485(2000)030<2246:EOLWOW>2.0.CO;2 [16] García-Nava H, Ocampo-Torres F J, Hwang P A, et al. Reduction of wind stress due to swell at high wind conditions[J]. Journal of Geophysical Research: Oceans, 2012, 117(C11): 1−11. [17] 陈汉宝, 刘海源, 徐亚男, 等. 风浪与涌浪相互影响的实验[J]. 天津大学学报(自然科学与工程技术版), 2013, 46(12): 1122−1126.Chen Hanbao, Liu Haiyuan, Xu Ya’nan, et al. Experiment on interaction between wind wave and swell[J]. Journal of Tianjin University (Science and Technology), 2013, 46(12): 1122−1126. [18] Högström U, Sahlée E, Smedman A S, et al. Surface stress over the ocean in swell-dominated conditions during moderate winds[J]. Journal of the Atmospheric Sciences, 2015, 72(12): 4777−4795. doi: 10.1175/JAS-D-15-0139.1 [19] Chen Sheng, Qiao Fangli, Jiang Wenzheng, et al. Impact of surface waves on wind stress under low to moderate wind conditions[J]. Journal of Physical Oceanography, 2019, 49(8): 2017−2028. doi: 10.1175/JPO-D-18-0266.1 [20] Young I R. Directional spectra of hurricane wind waves[J]. Journal of Geophysical Research: Oceans, 2006, 111(C8): C08020. [21] Kahma K K, Donelan M A, Drennan W M, et al. Evidence of energy and momentum flux from swell to wind[J]. Journal of Physical Oceanography, 2016, 46(7): 2143−2156. doi: 10.1175/JPO-D-15-0213.1 [22] Högström U, Sahlée E, Smedman A S, et al. The transition from downward to upward air-sea momentum flux in swell-dominated light wind conditions[J]. Journal of the Atmospheric Sciences, 2018, 75(8): 2579−2588. doi: 10.1175/JAS-D-17-0334.1 [23] Zou Zhongshui, Zhao Dongliang, Zhang Jun, et al. The influence of swell on the atmospheric boundary layer under nonneutral conditions[J]. Journal of Physical Oceanography, 2018, 48(4): 925−936. doi: 10.1175/JPO-D-17-0195.1 [24] Buckley M P, Veron F. Structure of the airflow above surface waves[J]. Journal of Physical Oceanography, 2016, 46(5): 1377−1397. doi: 10.1175/JPO-D-15-0135.1 [25] Rieder K F, Smith J A. Removing wave effects from the wind stress vector[J]. Journal of Geophysical Research: Oceans, 1998, 103(C1): 1363−1374. doi: 10.1029/97JC02571 [26] Makin V K, Kudryavtsev V N, Mastenbroek C. Drag of the sea surface[J]. Boundary-Layer Meteorology, 1995, 73(1/2): 159−182. [27] Wu Lichuan, Hristov T, Rutgersson A. Vertical profiles of wave-coherent momentum flux and velocity variances in the marine atmospheric boundary layer[J]. Journal of Physical Oceanography, 2018, 48(3): 625−641. doi: 10.1175/JPO-D-17-0052.1 [28] Hanley K E, Belcher S E. Wave-driven wind jets in the marine atmospheric boundary layer[J]. Journal of the Atmospheric Sciences, 2008, 65(8): 2646−2660. doi: 10.1175/2007JAS2562.1 [29] Sullivan P P, Edson J B, Hristov T, et al. Large-eddy simulations and observations of atmospheric marine boundary layers above nonequilibrium surface waves[J]. Journal of the Atmospheric Sciences, 2008, 65(4): 1225−1245. doi: 10.1175/2007JAS2427.1 [30] Semedo A, Saetra Ø, Rutgersson A, et al. Wave-induced wind in the marine boundary layer[J]. Journal of the Atmospheric Sciences, 2009, 66(8): 2256−2271. doi: 10.1175/2009JAS3018.1 [31] Belcher S E, Hunt J C R. Turbulent shear flow over slowly moving waves[J]. Journal of Fluid Mechanics, 1993, 251: 109−148. doi: 10.1017/S0022112093003350 [32] Plant W J. A relationship between wind stress and wave slope[J]. Journal of Geophysical Research, 1982, 87(C3): 1961−1967. doi: 10.1029/JC087iC03p01961 [33] Cohen J E, Belcher S E. Turbulent shear flow over fast-moving waves[J]. Journal of Fluid Mechanics, 1999, 386(1): 345−372. [34] Zou Zhongshui, Zhao Dongliang, Liu Bin, et al. Observation-based parameterization of air-sea fluxes in terms of wind speed and atmospheric stability under low-to-moderate wind conditions[J]. Journal of Geophysical Research: Oceans, 2017, 122(5): 4123−4142. doi: 10.1002/2016JC012399 [35] Högström U, Rutgersson A, Sahlée E, et al. Air-sea interaction features in the Baltic Sea and at a pacific trade-wind site: An inter-comparison study[J]. Boundary-Layer Meteorology, 2013, 147(1): 139−163. doi: 10.1007/s10546-012-9776-8 [36] Chen Sheng, Qiao Fangli, Huang Chuanjiang, et al. Deviation of wind stress from wind direction under low wind conditions[J]. Journal of Geophysical Research: Oceans, 2018, 123(12): 9357−9368. doi: 10.1029/2018JC014137 [37] Miles J W. On the generation of surface waves by shear flows[J]. Journal of Fluid Mechanics, 1957, 3(2): 185−204. doi: 10.1017/S0022112057000567 -

 下载:
下载:
计量
- 文章访问数: 442
- HTML全文浏览量: 206
- PDF下载量: 41
- 被引次数: 0
