Analysis of black-hole eddy on material transport in the western Pacific
-
摘要: 基于椭圆型拉格朗日拟序结构(elliptic Lagrangian Coherent Structures, eLCSs)可以提取出黑洞涡旋,它具有较强的输运能力并且随流场长时间运动后仍保持连贯,类似于海洋中的“黑洞”,故被称为黑洞涡旋。本文基于地转流速度场数据,针对西太平洋中一个典型的黑洞涡旋(Eddy A)使用eLCSs的方法提取涡旋边界,并进行分析研究。利用海表温度、海表盐度和叶绿素浓度数据分析验证Eddy A水平方向上物质输运的连贯性;使用Argo浮标得到的不同深度的温度、盐度和溶解氧数据对Eddy A垂直方向的物质相干性进行分析验证。通过分析证明,在较长的时间尺度上,黑洞涡旋边界较欧拉涡旋边界的连贯性更强,能更加客观地描述物质输运。Abstract: Black-hole eddy can be extracted based on elliptic Lagrangian Coherent Structures (eLCSs), which can transport material and maintain coherent under geostrophic for a long time. It was similar to the black hole in the ocean, so it was called black-hole eddy. In this paper, the boundary of black-hole eddy was extracted based on the data of the geostrophic flow velocity field. Using the method of eLCSs and choosing a targeted eddy (Eddy A) in the western Pacific to analyze. Sea surface temperature, sea surface salinity and chlorophyll concentration data are used to verify that the Eddy A is coherent in horizontal material transport. The temperature, salinity and dissolved oxygen data obtained by Argo in different depths are used to prove the coherence in vertical of Eddy A. The result demonstrates that the boundary of black-hole eddy is more coherent than Eulerian boundary in a long time scale and can describe the transport of material more objectively.
-
Key words:
- black-hole eddy /
- coherence /
- material transport /
- three-dimensional structures
-
图 2 以Eddy A为例,
$ {t}_{0} $ 以2014年4月10日为初始时刻,积分时间为30 d的黑洞涡旋提取λ=1边界(红色曲线)和最外层边界(蓝色曲线)的比较橙色点为涡心,黑色为涡旋外的点,黑色虚线为庞加莱截面
Fig. 2 Black-hole eddy’s boundaries for t0=April 10, 2014, with a detection time scale of 30 d, are extracted in red (λ=1) and blue (λ=0.9)
The red point is the eddy center, the black point is the point outside the eddy, and the black dotted line is the Poincare section
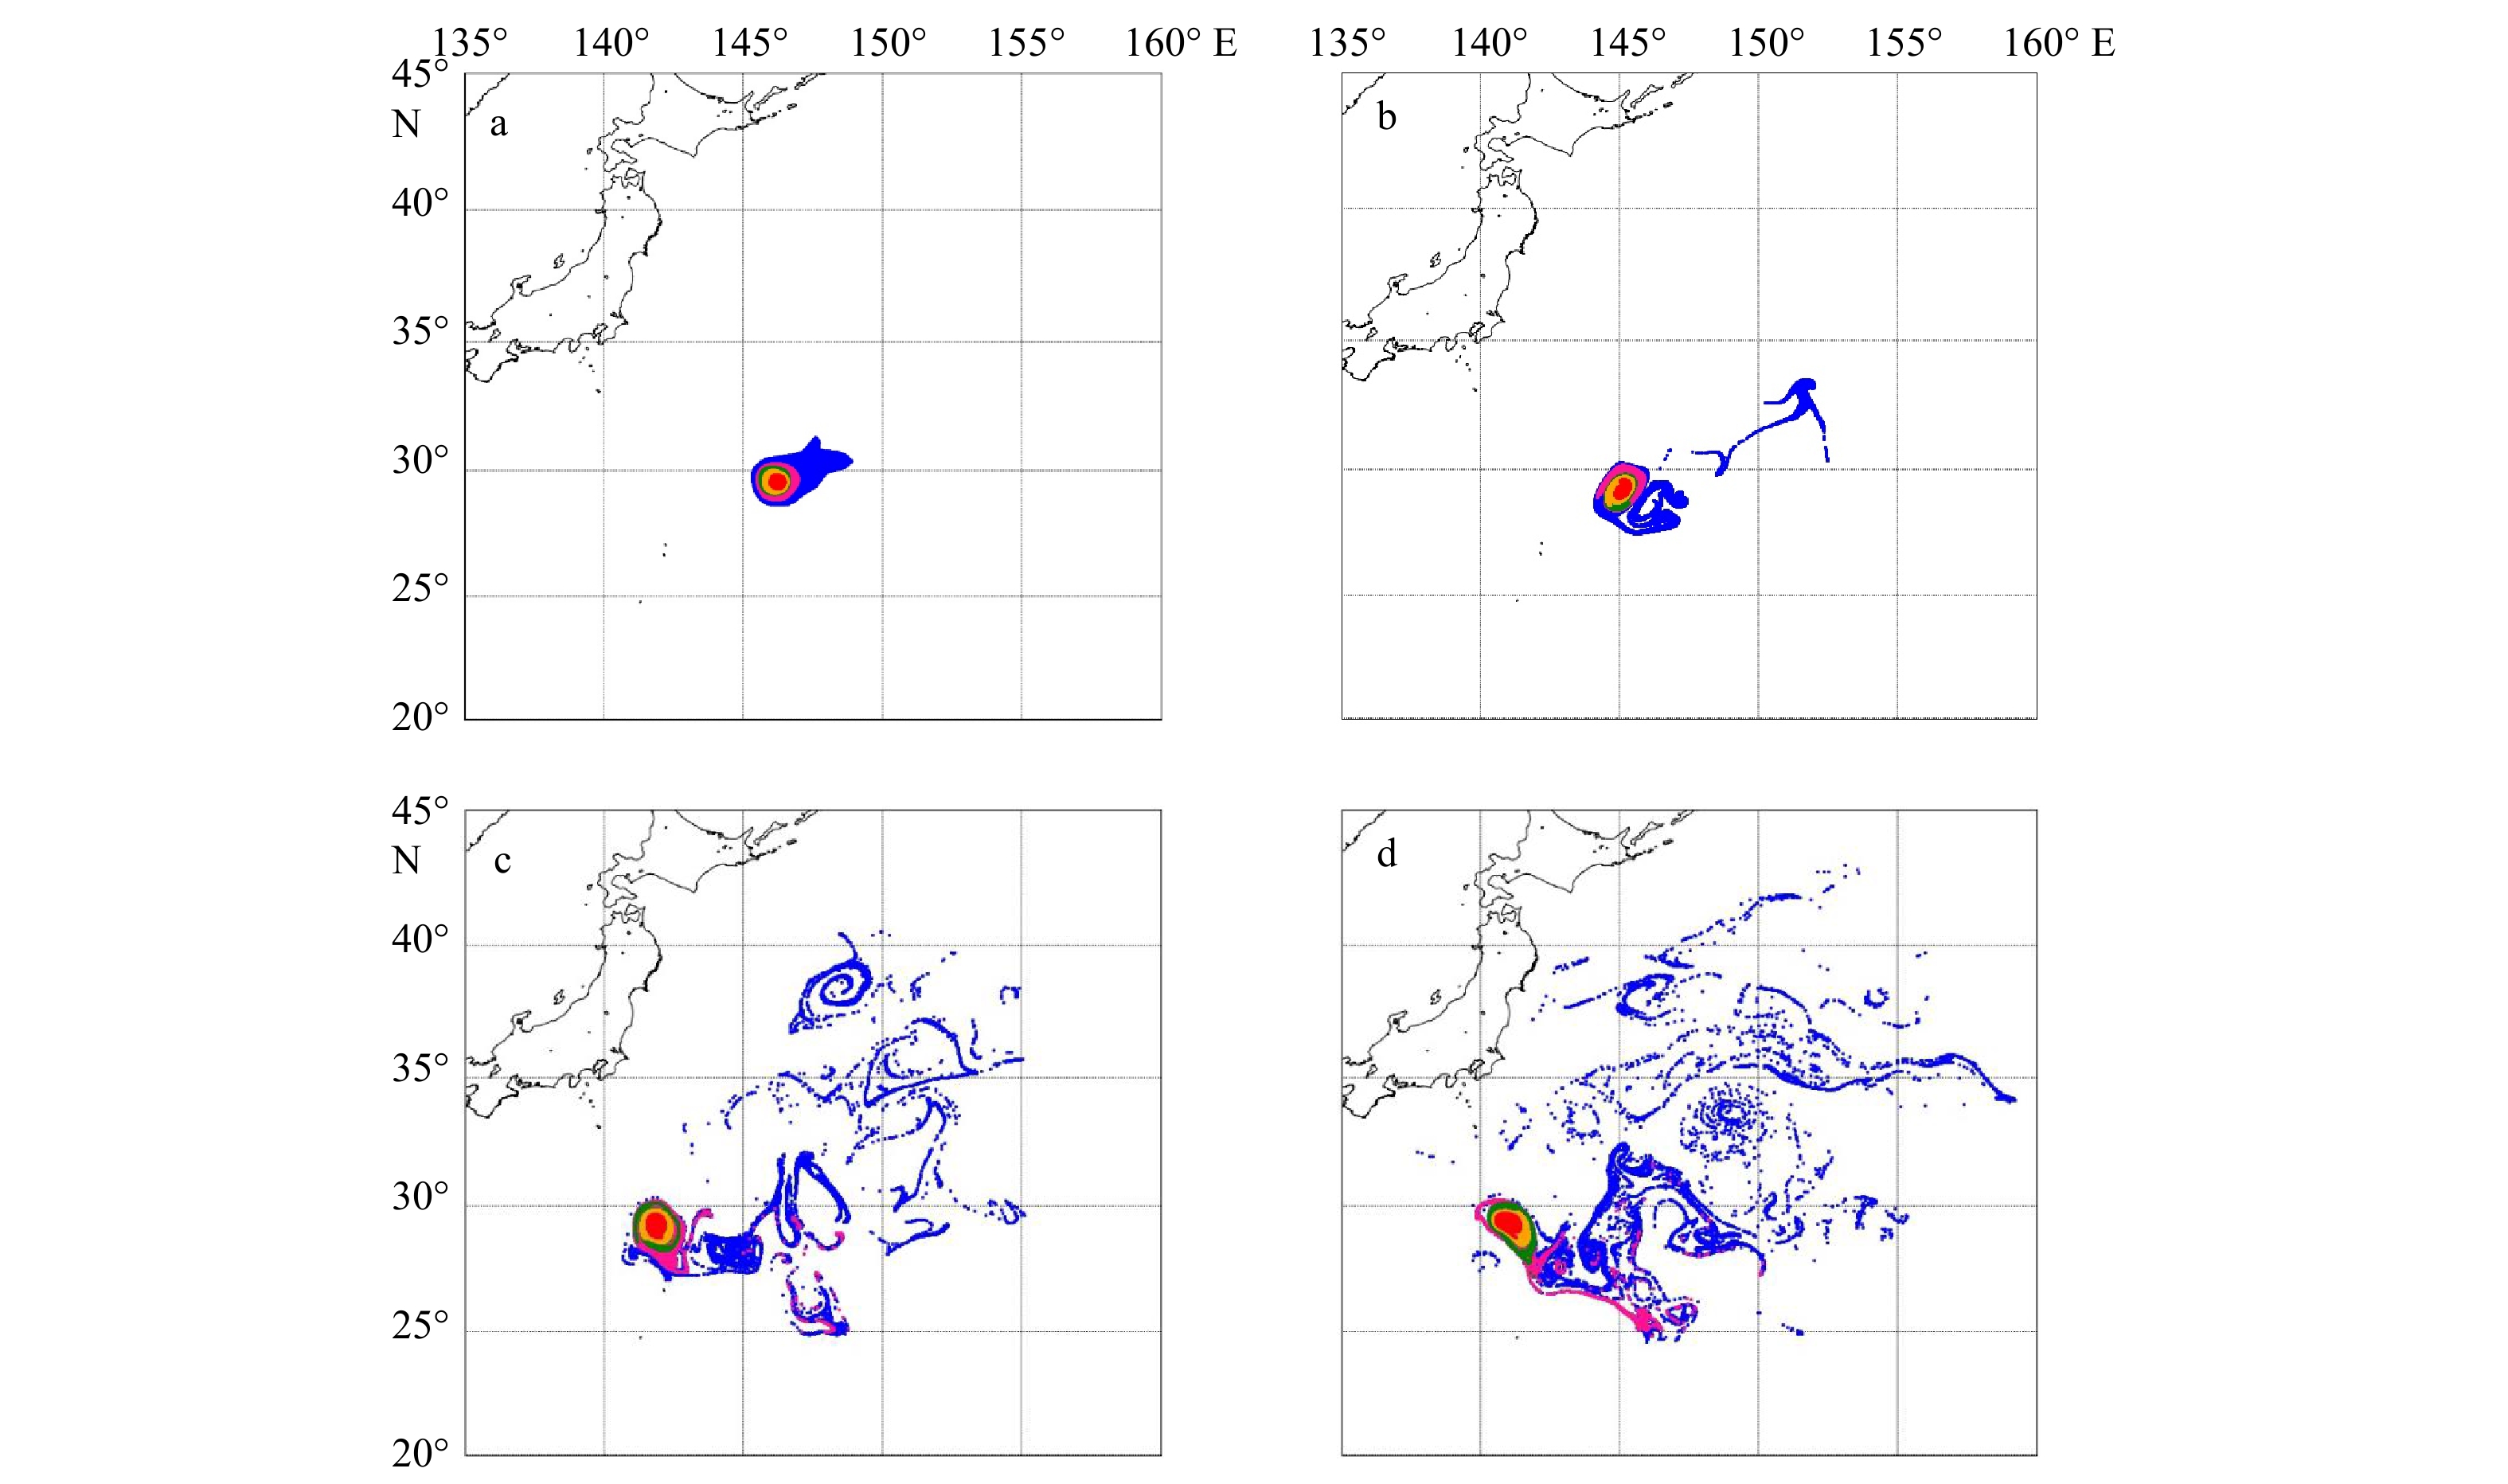
图 3 黑洞涡旋边界(粉色、绿色、橙色和红色线分别为积分时间30 d、60 d、90 d和120 d)和欧拉边界(蓝色线)随流场运动其内部虚拟粒子的移动轨迹
a. 2014年4月10日各边界的初始位置;b−d. 分别为5月9日、7月8日和8月7日的粒子轨迹
Fig. 3 Eddy boundaries of the black-hole (pink, green, orange and red lines are with detection time scale of 30 d, 60 d, 90 d and 120 d respectively) and Eulerian boundary (blue) filled with virtual particles moves with the geostrophic
a. The initial position of the boundary on April 10, 2014; b−d. particles tracks on May 9, July 8 and August 7, respectively
图 4 黑洞涡旋边界(粉色、绿色、橙色和红色线分别为积分时间30 d、60 d、90 d和120 d)和欧拉边界(蓝色)随流场运动的轨迹
a为2014年4月10日各边界的初始位置;b−d分别为5月9日、7月8日和8月7日的粒子轨迹;右列为对应的左列图中黑色框内的放大图
Fig. 4 The trajectories of black-hole (pink, green, orange and red lines are with detection time scale of 30 d, 60 d, 90 d and 120 d respectively) and Eulerian boundary (blue) under the geostrophic
a. The initial position of the boundary on April 10, 2014; b−d. particles tracks on May 9, July 8 and August 7, respectively; the right column is the enlarged image in the black box of the left column
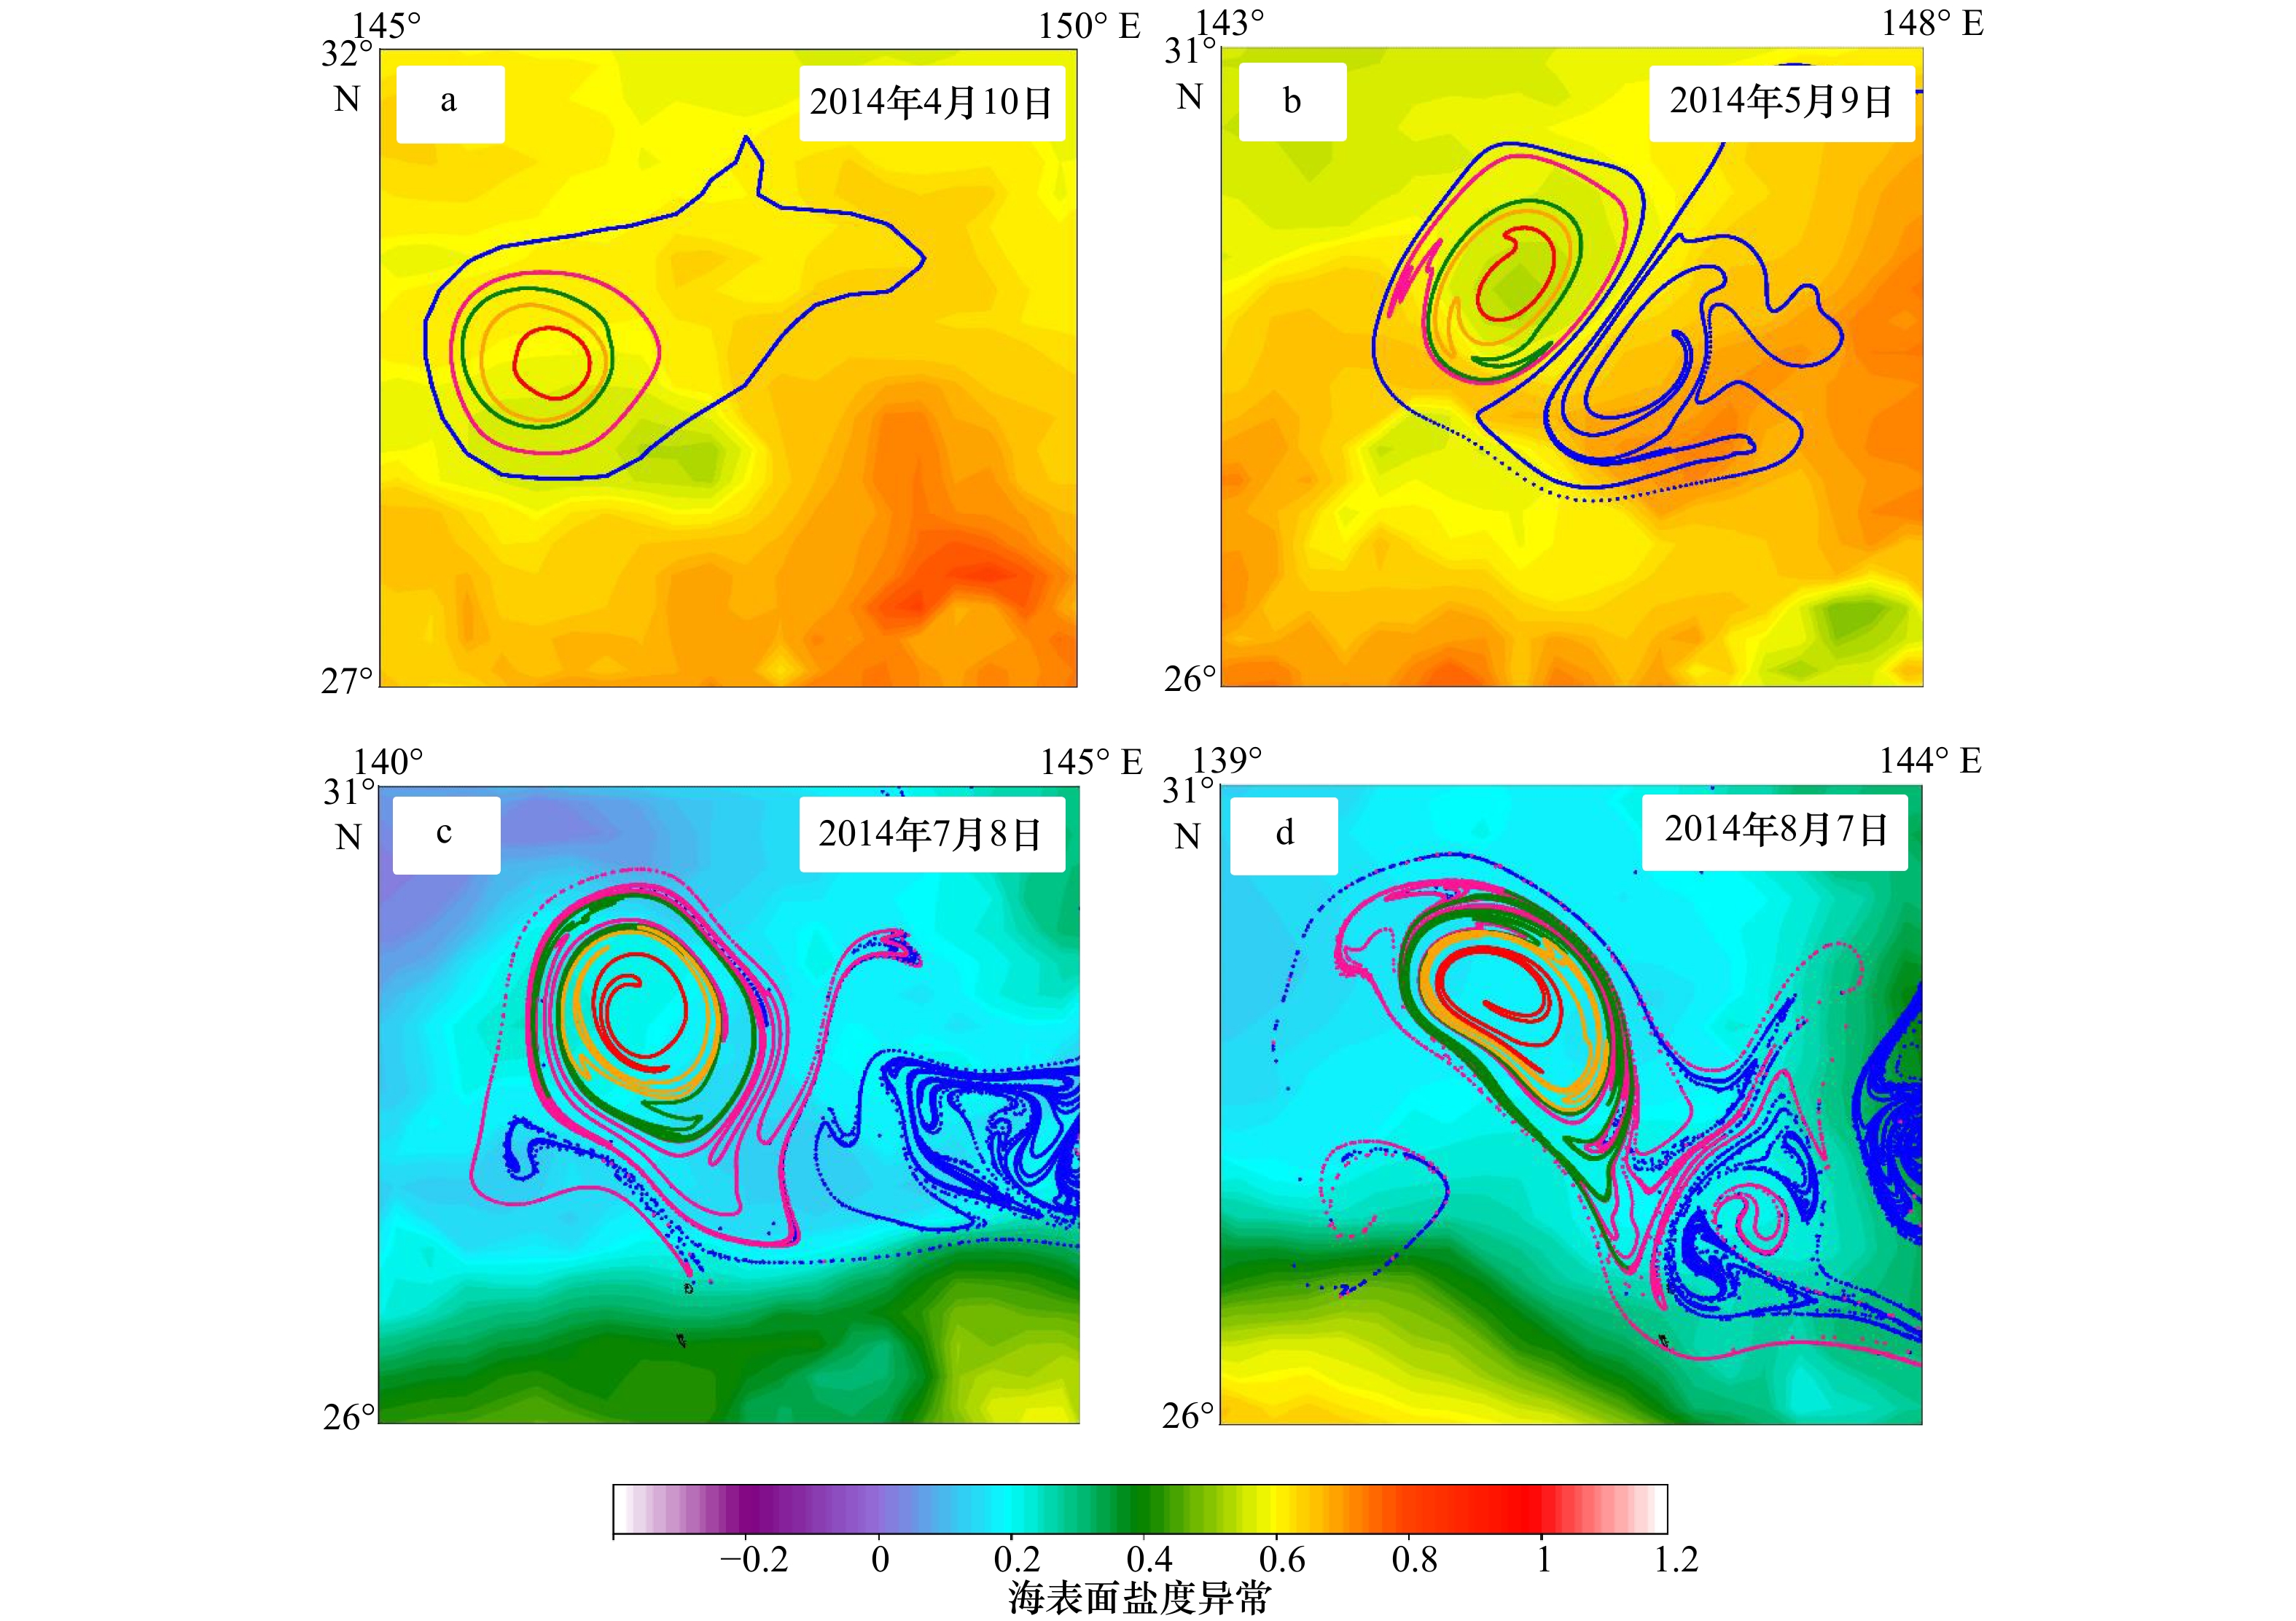
图 5 黑洞涡旋边界(粉色、绿色、橙色和红色线分别为积分时间30 d,60 d,90 d和120 d)和欧拉边界(蓝色线)随流场运动轨迹
a. 2014年4月10日各边界的初始位置;b−d分别为5月9日、7月8日和8月7日的粒子轨迹
Fig. 5 The trajectories of black-hole (pink, green, orange and red lines are with detection time scale of 30 d, 60 d, 90 d and 120 d respectively) and Eulerian boundary (blue) under the geostrophic
a. The initial position of the boundary on April 10, 2014; b−d. particles tracks on May 9, July 8 and August 7, respectively
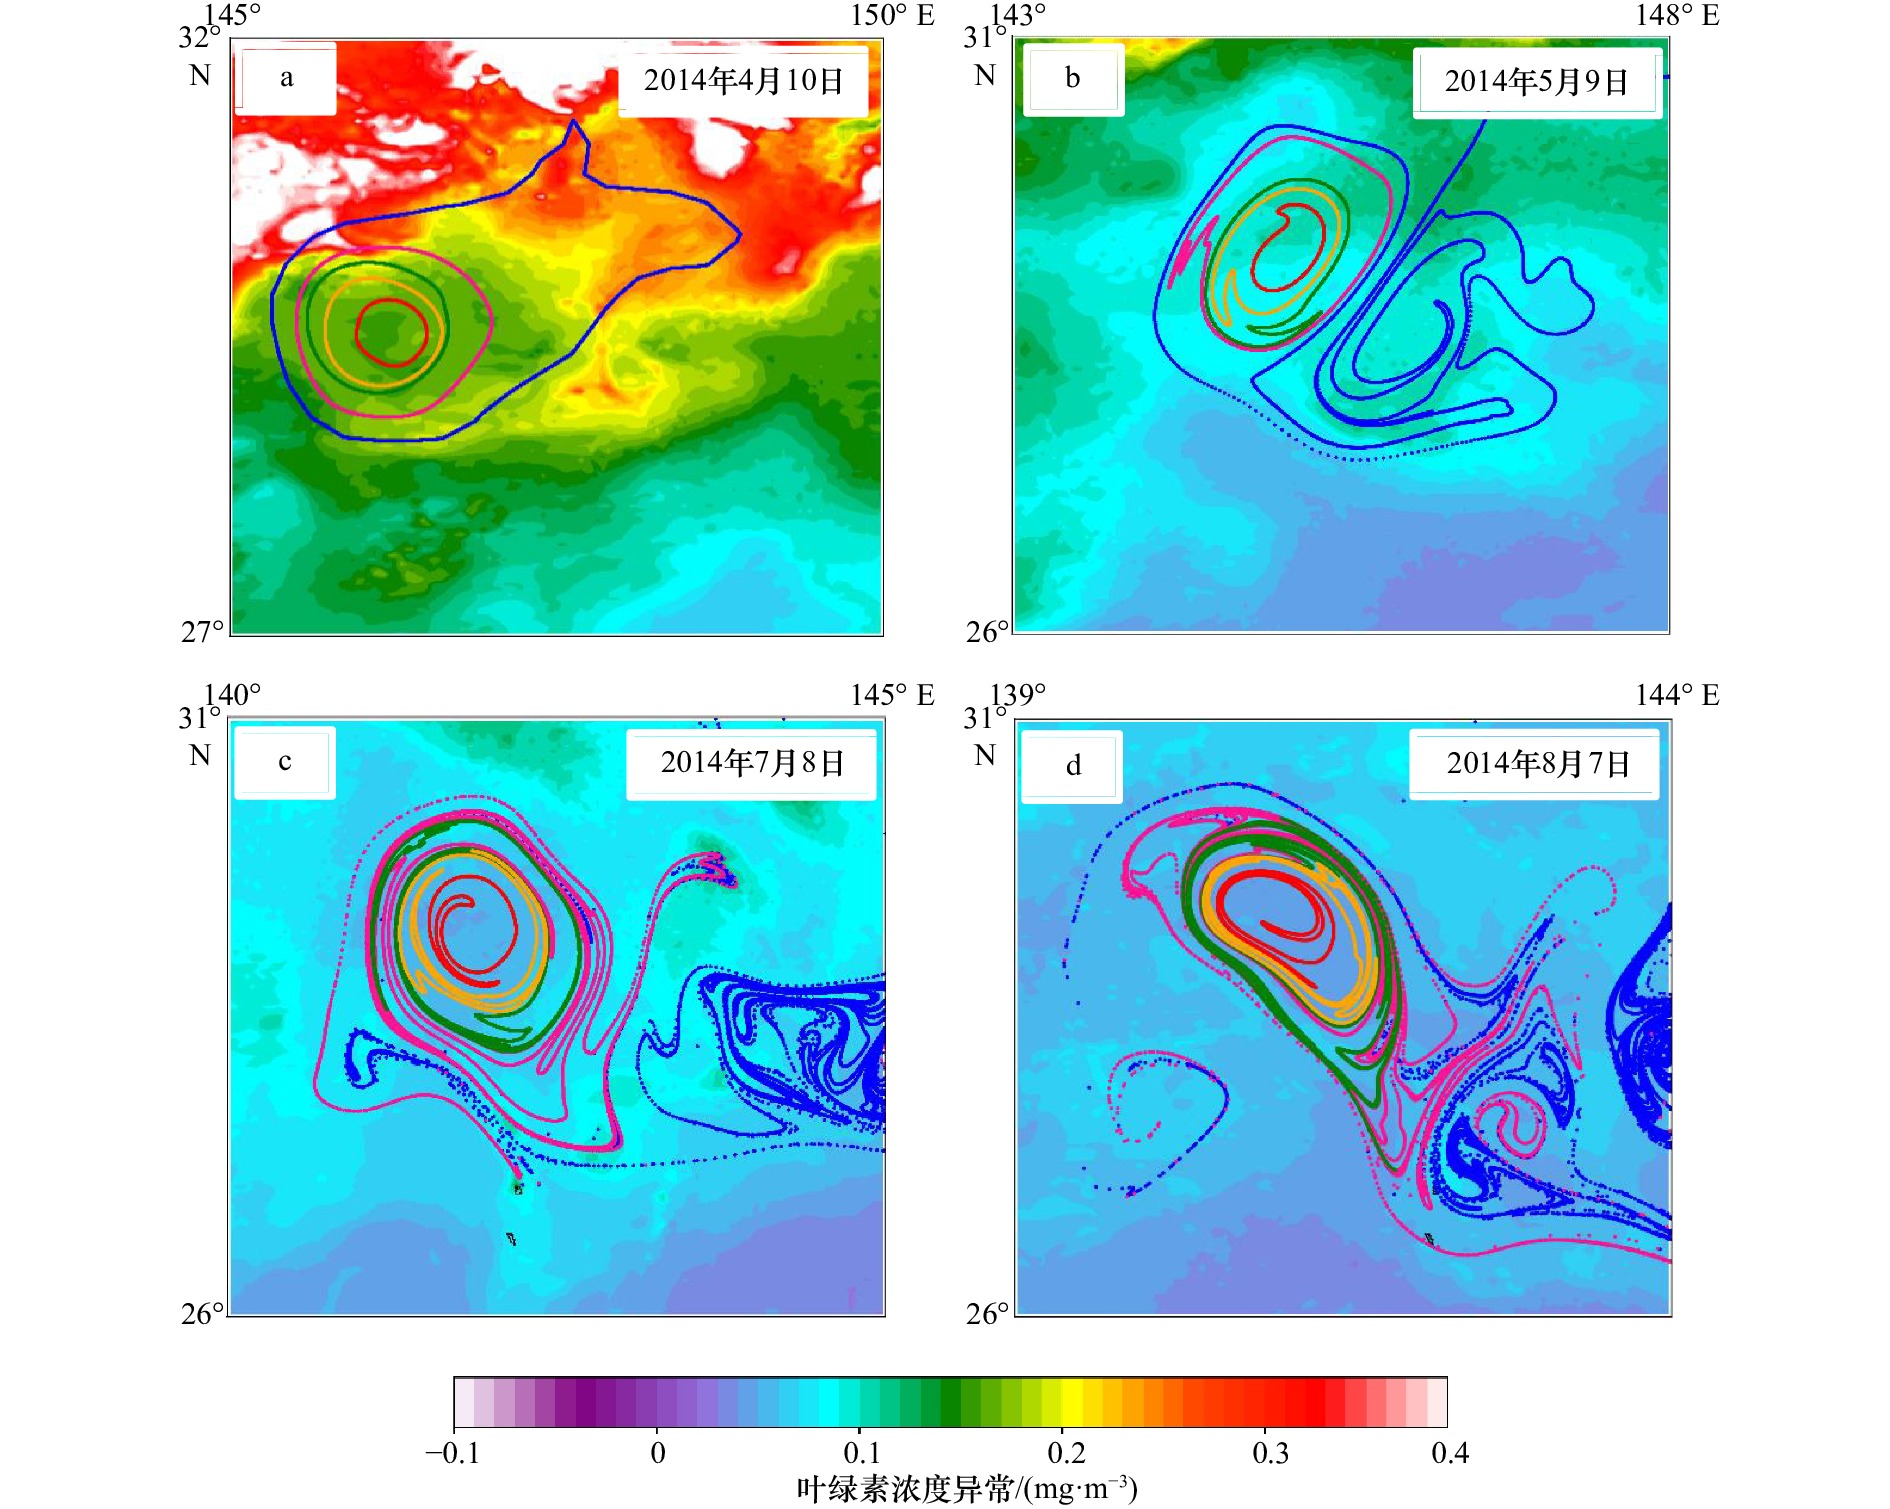
图 6 黑洞涡旋边界(粉色、绿色、橙色和红色线分别为积分时间30 d、60 d、90 d和120 d)和欧拉边界(蓝色线)随流场运动的轨迹
a. 2014年4月10日各边界的初始位置;b−d分别为5月9日、7月8日和8月7日的粒子轨迹
Fig. 6 The trajectories of black-hole (pink, green, orange and red lines are with detection time scale of 30 d, 60 d, 90 d and 120 d respectively) and Eulerian boundary (blue) under the geostrophic
a. The initial position of the boundary on April 10, 2014; b−d. particles tracks on May 9, July 8 and August 7, respectively
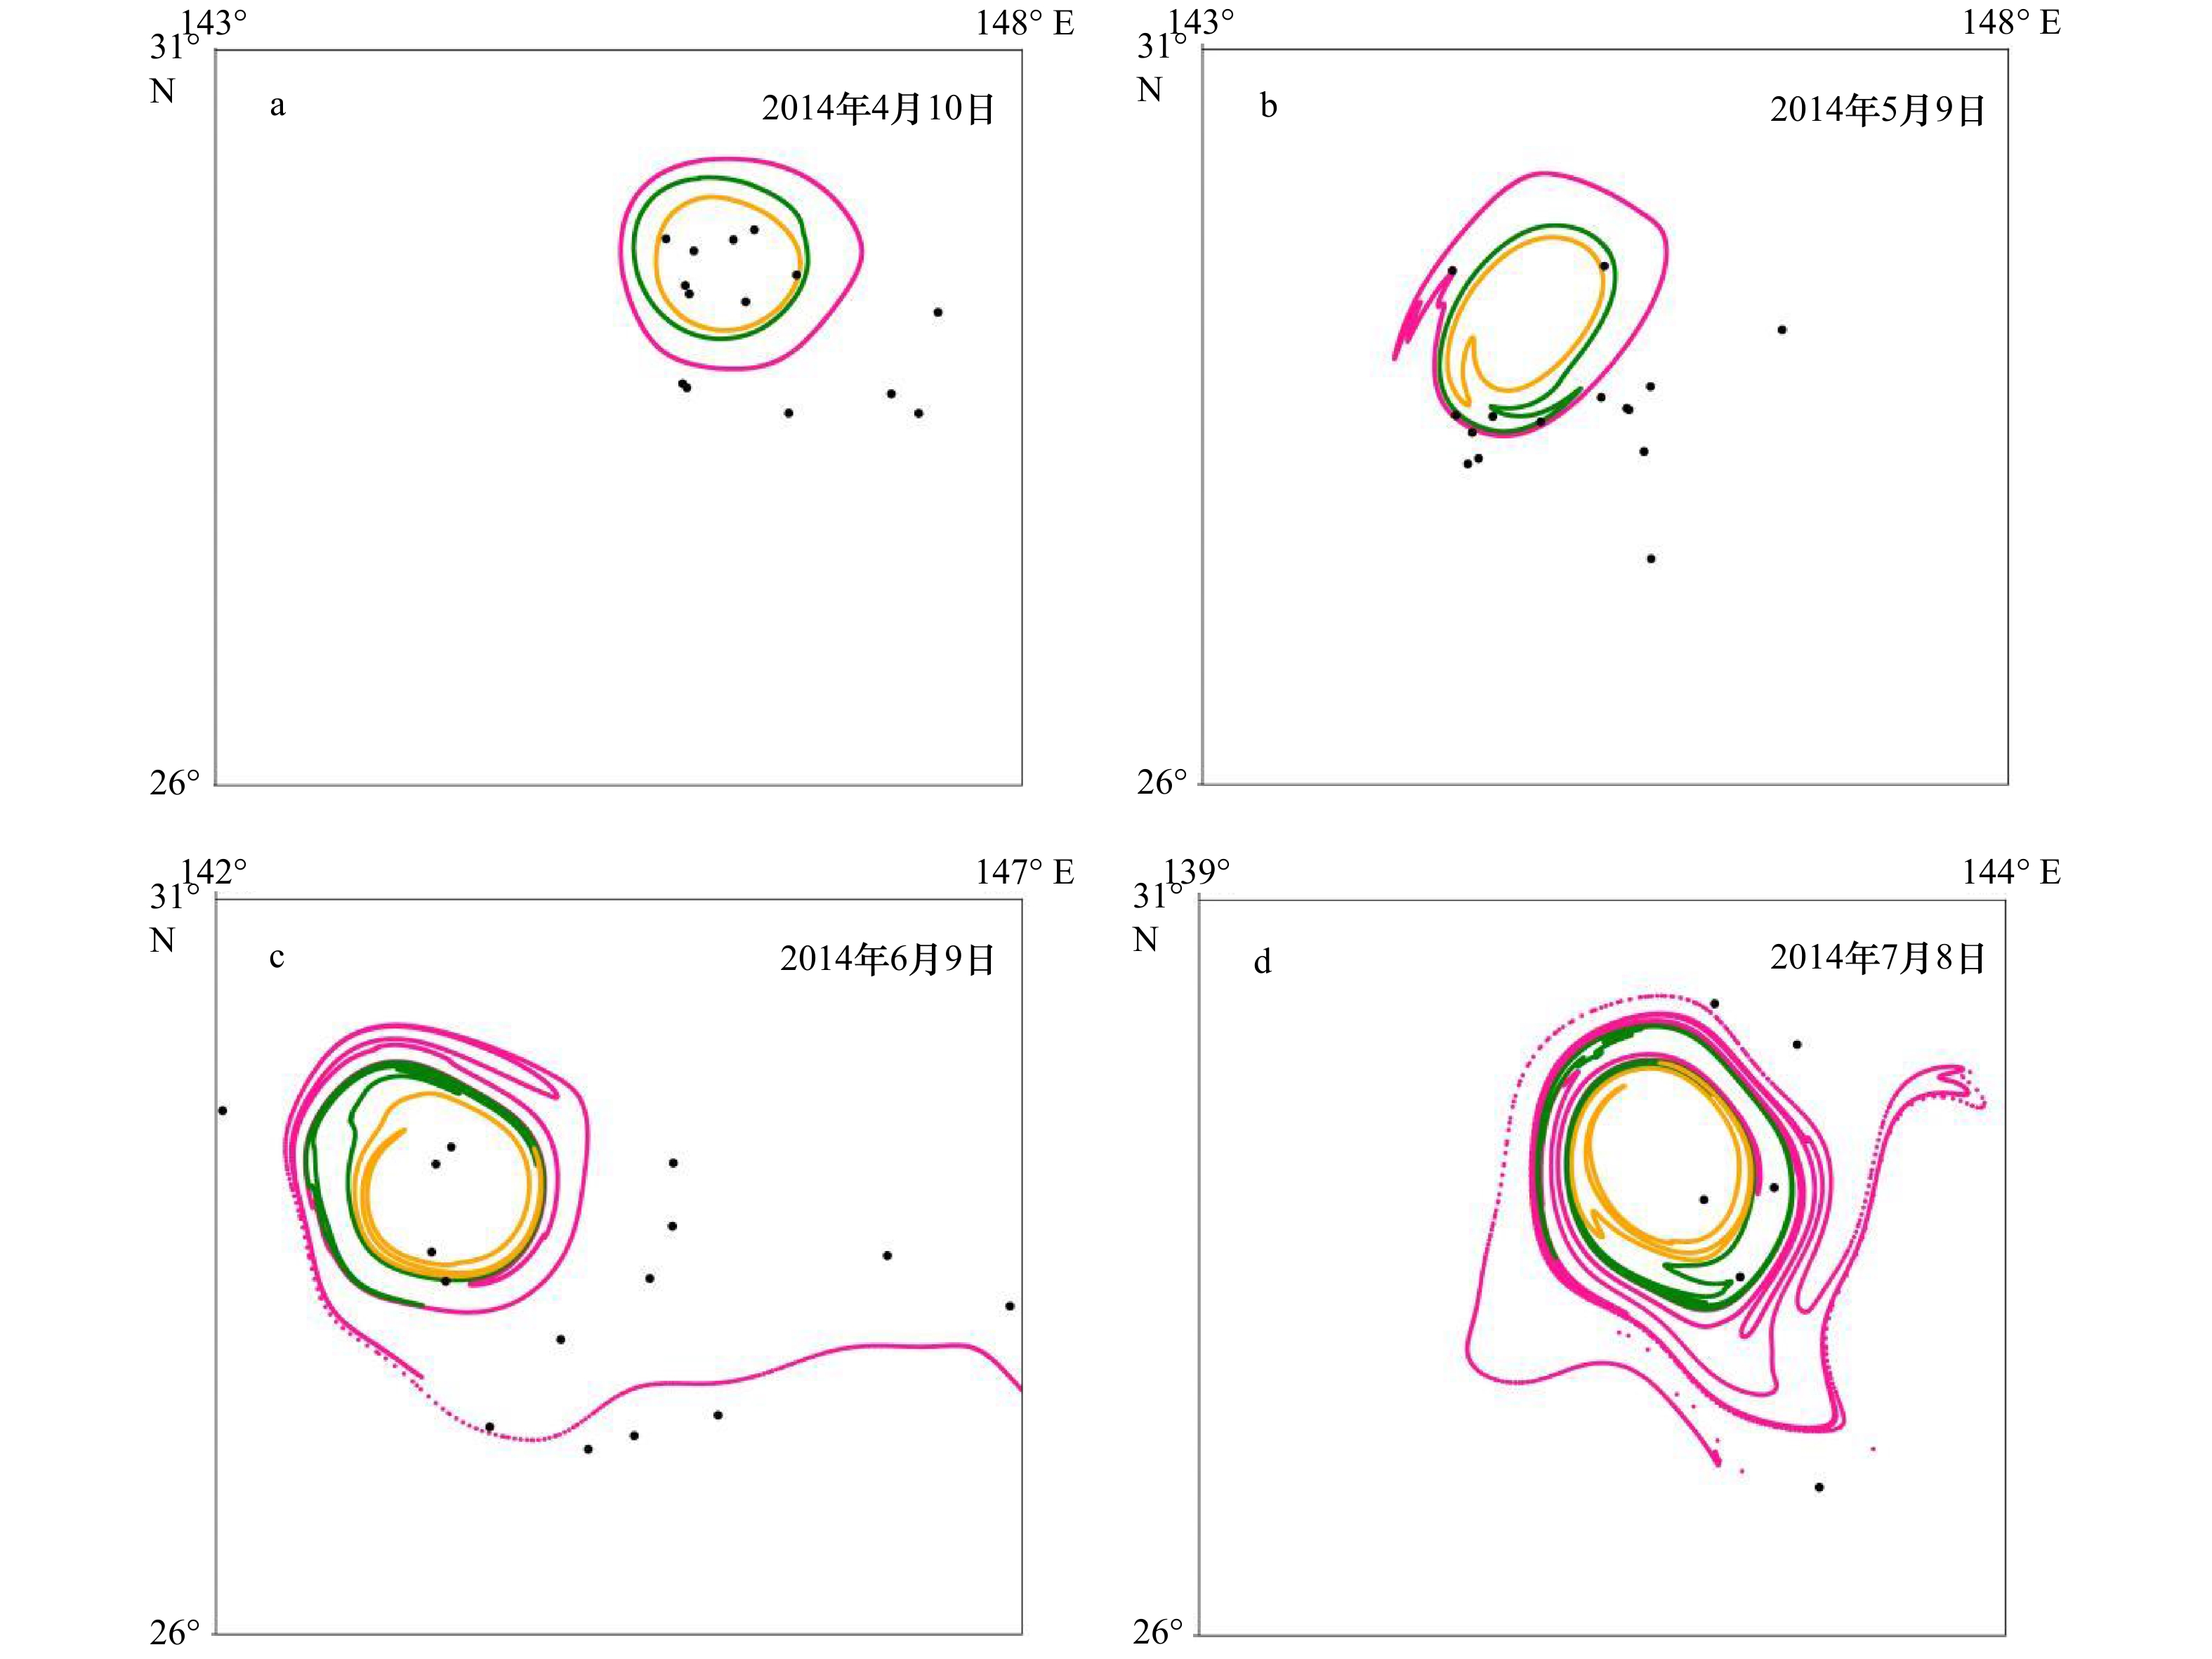
图 7 Argo浮标(黑色点)与涡旋Eddy A边界的相对位置
曲线为$ {t}_{0} $=2014年4月10日的T=30 d(粉色)、T=60 d(绿色)和T=90 d(黄色)的拉格朗日边界
Fig. 7 The relative position of Argo buoy (black dots) and Eddy A
Each black-hole eddy boundary has a different detection time scale T of 30-days (pink), 60-days (green), 90-days (yellow) and $ {t}_{0} $= April 10, 2014 on April 10, 2014 (a), May 9, 2014 (b), June 9, 2014 (c) and July 8, 2014 (d)
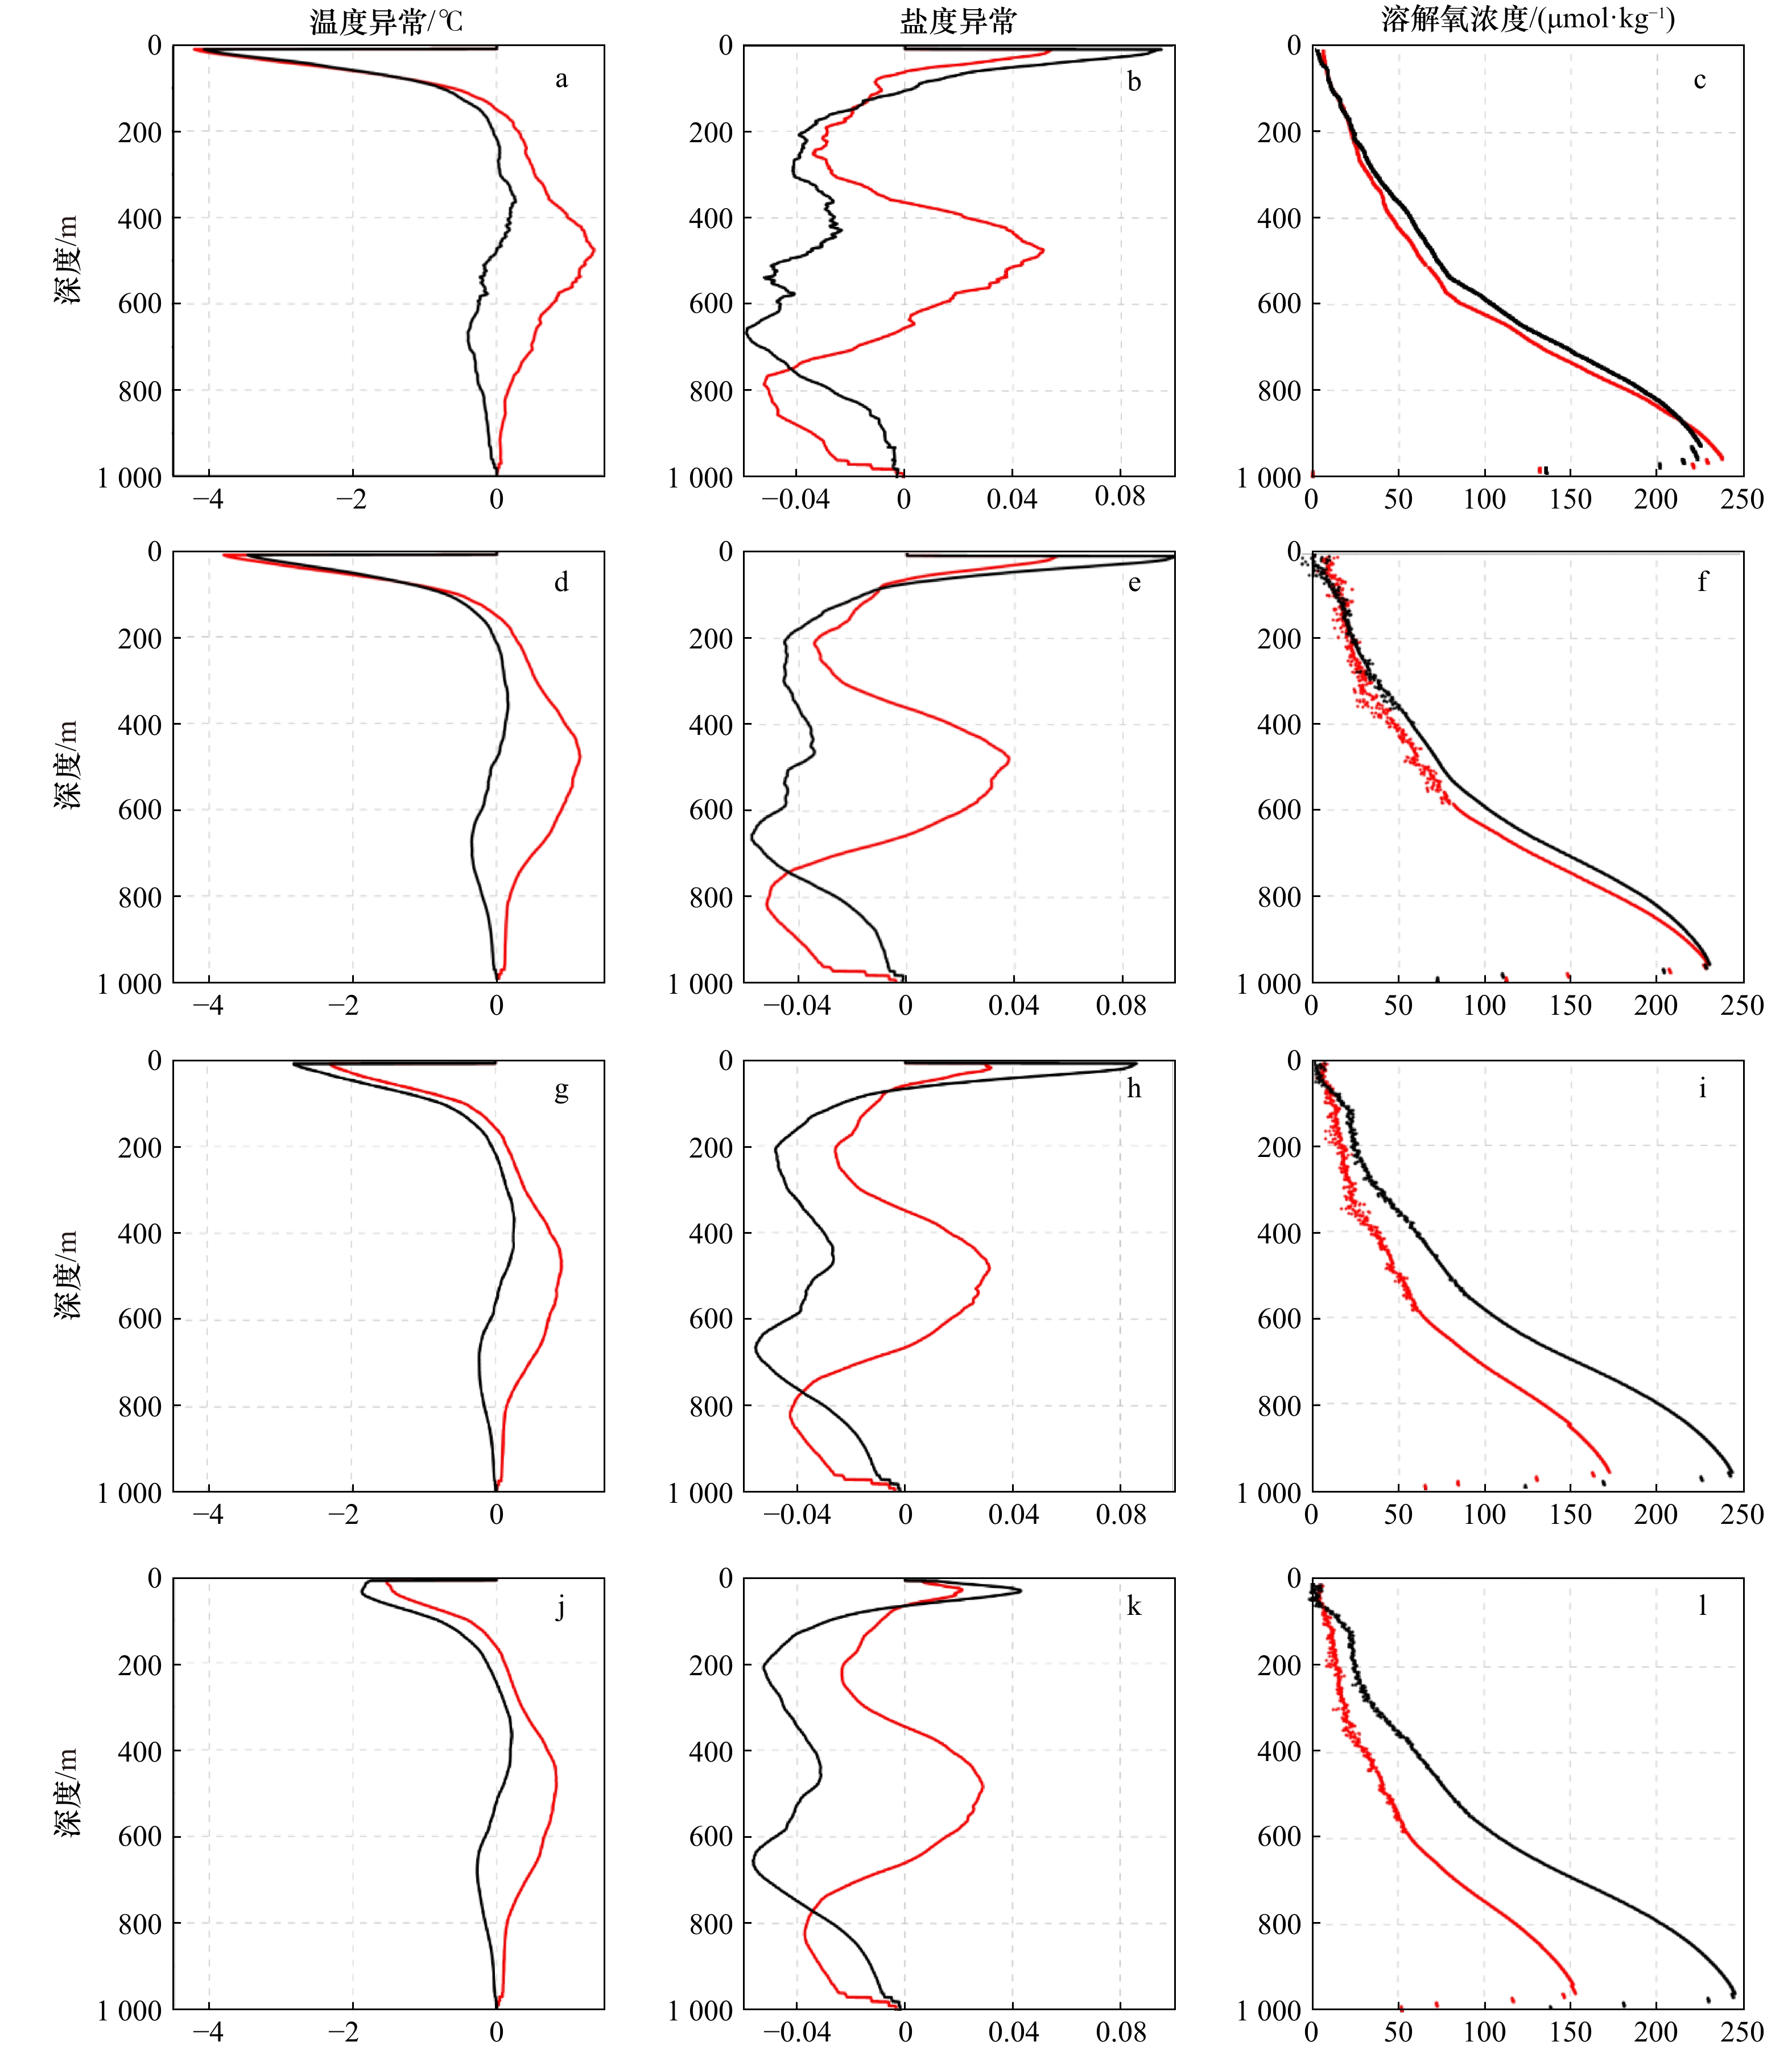
图 8 垂直方向上不同时间积分的黑洞涡旋边界内(红色曲线)外(黑色曲线)物质分布差异比较
a, d, g, j. 温度异常剖面;b,e, h, k. 盐度异常剖面;c, f, i, l. 溶解氧浓度剖面。第1行和第2行分别为T=30 d边界在4月10日和5月9日的剖面,第3行和第4行为T=60 d边界在7月8日和T=90 d边界在8月7日的剖面
Fig. 8 The difference of material distribution inside (red curve) and outside (black curve) the black-hole eddy boundaries in vertical
a, d, g, j. The temperature anomaly profiles; b, e, h, k. the salinity anomaly profiles; c, f, i, l. the dissolved oxygen concentration profiles. The first and second lines are profiles of the boundary T=30 d on April 10 and May 9, the third and fourth lines are profiles of the boundary T=60 d on July 8 and T=90 d on August 7
图 9 Argo数据点的温度异常和盐度异常与涡心相对距离统计
a, c, e, g, i. 为温度异常;b, d, f, h, j. 盐度异常。第1行至第5行的深度分别为100 m,300 m,500 m,700 m,900 m。红色、橙色和绿色竖线分别代表随流场运动后T=30 d,90 d和120 d的平均黑洞边界,蓝色的线代表拟合曲线,蓝色空心点为拟合曲线二阶导数为0的点
Fig. 9 The statistical graphs of relative distance between Argo data point of temperature anomaly and salinity anomaly and eddy center
a, c, e, g, i. Temperature anomaly; b, d, f, h, j. salinity anomaly. The depth of the first to fifth rows is 100 m, 300 m, 500 m, 700 m and 900 m respectively. The red, orange and green vertical lines represent the average black-hole eddy boundaries of T=30 d, 90 d and 120 d after moving with the flow field. The solid blue lines represent the fitting curve, and the blue edge dots show where the second derivative is 0
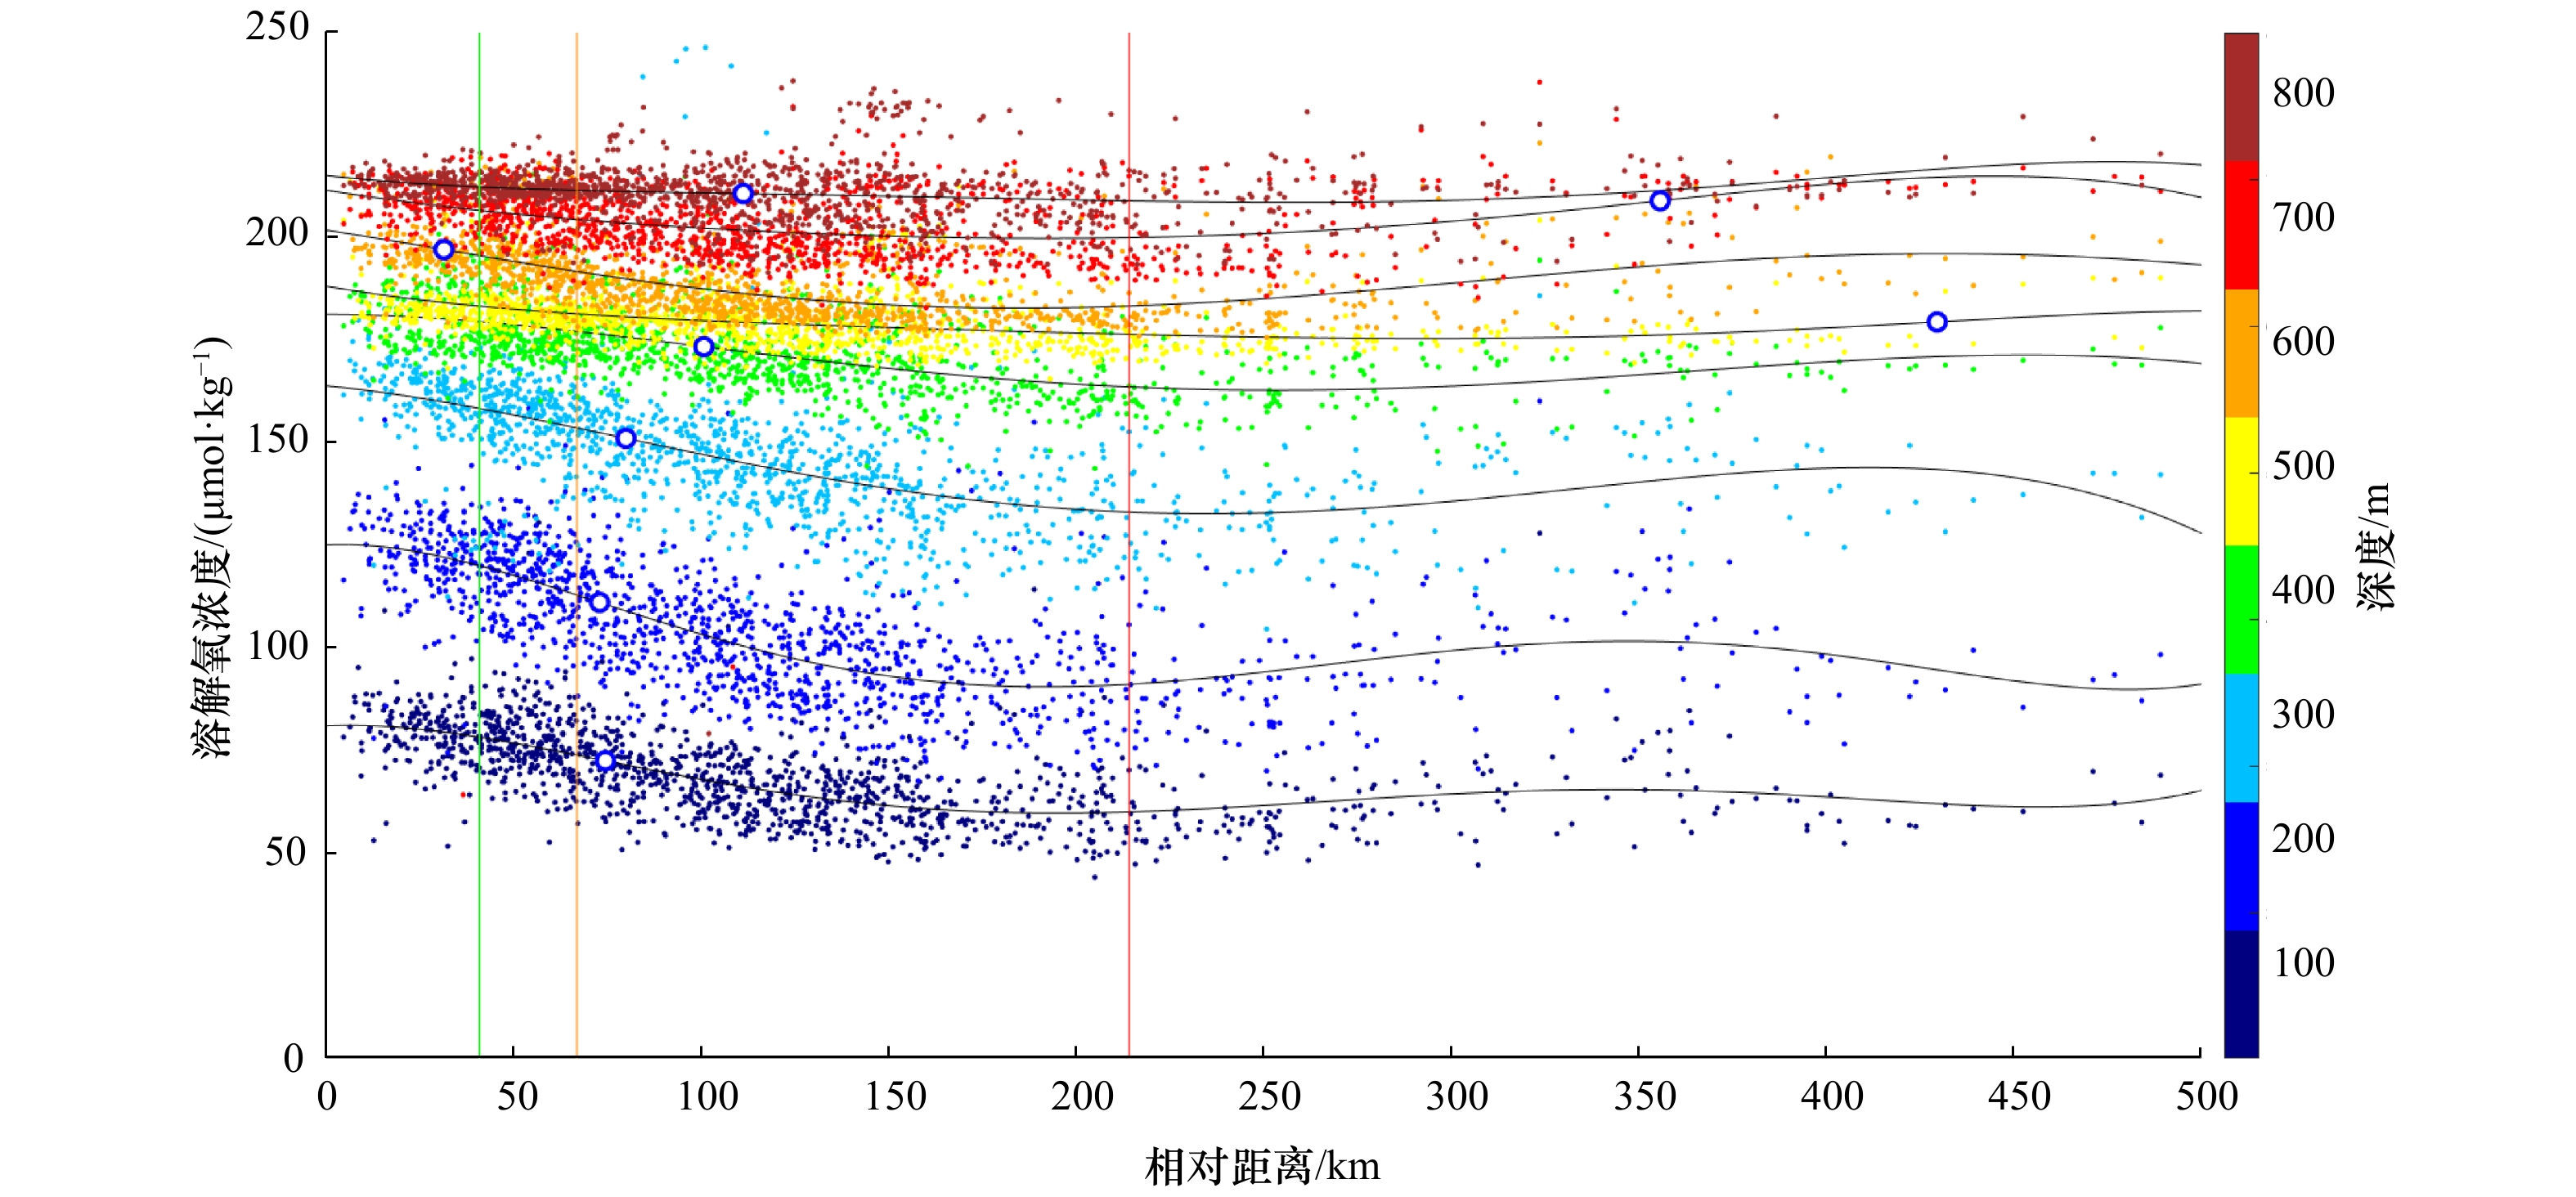
图 10 Argo数据点的溶解氧浓度与涡心相对距离统计
点的颜色代表所属深度范围,红色、橙色和绿色竖线分别代表随流场运动后T=30 d、90 d和120 d的平均黑洞涡旋边界。黑色的线代表拟合曲线,蓝色空心点为拟合曲线二阶导数为0的点
Fig. 10 The statistical graphs of relative distance between Argo data point of dissolved oxygen concentration and eddy center
The color of points represents the depths. The red, orange and green vertical lines represent the average black-hole eddy boundaries of T=30 d, 90 d and 120 d after moving with the flow field. The black lines represent the fitting curve, and the blue edge dots show where the second derivative is 0
-
[1] Chen G, Hou Y, Chu X. Mesoscale eddies in the South China Sea: Mean properties, spatiotemporal variability, and impact on thermohaline structure[J]. Journal of Geophysical Research: Oceans, 2011, 116(C6): C06018. [2] Faghmous J H, Styles L, Mithal V, et al. Eddyscan: A physically consistent ocean eddy monitoring application[C]//2012 Conference on Intelligent Data Understanding. Washington, DC: IEEE, 2012: 96−103. [3] Liu Y, Chen G, Sun M, et al. A parallel SLA-based algorithm for global mesoscale eddy identification[J]. Journal of Atmospheric and Oceanic Technology, 2016, 33(12): 2743−2754. doi: 10.1175/JTECH-D-16-0033.1 [4] Faghmous J H, Le M, Uluyol M, et al. A parameter-free spatio-temporal pattern mining model to catalog global ocean dynamics[C]//2013 IEEE 13th International Conference on Data Mining. Dallas: IEEE, 2013: 151−160. [5] Chelton D B, Schlax M G, Samelson R M. Global observations of nonlinear mesoscale eddies[J]. Progress in Oceanography, 2011, 91(2): 167−216. doi: 10.1016/j.pocean.2011.01.002 [6] Chaigneau A, Le Texier M, Eldin G, et al. Vertical structure of mesoscale eddies in the eastern South Pacific Ocean: A composite analysis from altimetry and Argo profiling floats[J]. Journal of Geophysical Research: Oceans, 2011, 116(C11): C11025. [7] Beron-Vera F J, Wang Y, Olascoaga M J, et al. Objective detection of oceanic eddies and the Agulhas leakage[J]. Journal of Physical Oceanography, 2013, 43(7): 1426−1438. doi: 10.1175/JPO-D-12-0171.1 [8] Sun M, Tian F, Liu Y, et al. An improved automatic algorithm for global eddy tracking using satellite altimeter data[J]. Remote Sensing, 2017, 9(3): 206. doi: 10.3390/rs9030206 [9] Tian Fenglin, Wu Di, Yuan Liming, et al. Impacts of the efficiencies of identification and tracking algorithms on the statistical properties of global mesoscale eddies using merged altimeter data.[J] International Journal of Remote Sensing, 2020,41(8): 2835−2860. [10] 夏琼. 典型海洋中尺度涡旋特征分析研究[D]. 青岛: 中国科学院大学(中国科学院海洋研究所), 2018.Xia Qiong. Study on the characteristics of typical oceanic mesoscale eddies[D]. Qingdao: University of Chinese Academy of Sciences (Institute of Oceanology, Chinese Academy of Sciences), 2018. [11] Wang Y, Olascoaga M J, Beron-Vera F J. Coherent water transport across the South Atlantic[J]. Geophysical Research Letters, 2015, 42(10): 4072−4079. doi: 10.1002/2015GL064089 [12] Haller G, Beron-Vera F J. Coherent Lagrangian vortices: The black holes of turbulence[J]. Journal of Fluid Mechanics, 2013(731): R4-1−R4-10. [13] Haller G. Lagrangian coherent structures[J]. Annual Review of Fluid Mechanics, 2015, 47: 137−162. doi: 10.1146/annurev-fluid-010313-141322 [14] Beron-Vera F J, Hadjighasem A, Xia Q, et al. Coherent Lagrangian swirls among submesoscale motions[J]. Proceedings of the National Academy of Sciences, 2019, 116(37): 18251−18256. [15] Haller G, Yuan G. Lagrangian coherent structures and mixing in two-dimensional turbulence[J]. Physica D: Nonlinear Phenomena, 2000, 147(3/4): 352−370. doi: 10.1016/S0167-2789(00)00142-1 [16] V Artale, Boffetta G, Celani A, et al. Dispersion of passive tracers in closed basins: Beyond the diffusion coefficient[J]. Physics of Fluids, 1997, 9(11): 3162−3171. doi: 10.1063/1.869433 [17] Aurell E, Boffetta G, Crisanti A, et al. Predictability in the large: an extension of the concept of Lyapunov exponent[J]. Journal of Physics A: Mathematical and General, 1997, 30(1): 1−26. doi: 10.1088/0305-4470/30/1/003 [18] d'Ovidio F, Fernández V, Hernández-García E, et al. Mixing structures in the Mediterranean Sea from finite-size Lyapunov exponents[J]. Geophysical Research Letters, 2004, 31(17): L17203. [19] Haller G. A variational theory of hyperbolic Lagrangian coherent structures[J]. Physica D: Nonlinear Phenomena, 2011, 240(7): 574−598. doi: 10.1016/j.physd.2010.11.010 [20] Haller G, Beron-Vera F J. Geodesic theory of transport barriers in two-dimensional flows[J]. Physica D: Nonlinear Phenomena, 2012, 241(20): 1680−1702. doi: 10.1016/j.physd.2012.06.012 [21] Haller G, Hadjighasem A, Farazmand M, et al. Defining coherent vortices objectively from the vorticity[J]. Journal of Fluid Mechanics, 2016, 795: 136−173. doi: 10.1017/jfm.2016.151 [22] Abernathey R, Haller G. Transport by Lagrangian Vortices in the Eastern Pacific[J]. Journal of Physical Oceanography, 2018, 48(3): 667−685. doi: 10.1175/JPO-D-17-0102.1 [23] Rypina I I, Kamenkovich I, Berloff P, et al. Eddy-induced particle dispersion in the near-surface north Atlantic[J]. Journal of Physical Oceanography, 2012, 42(12): 2206−2228. doi: 10.1175/JPO-D-11-0191.1 [24] Beron-Vera F J, Olascoaga M J, Wang Y, et al. Enduring Lagrangian coherence of a Loop Current ring assessed using independent observations[J]. Scientific Reports, 2018, 8(1): 1−12. [25] Dong C, McWilliams J C, Liu Y, et al. Global heat and salt transports by eddy movement[J]. Nature Communications, 2014, 5: 3294. doi: 10.1038/ncomms4294 [26] Xu Lixiao, Li Peiliang, Xie ShangPing, et al. Observing mesoscale eddy effects on mode-water subduction and transport in the North Pacific[J]. Nature Communications, 2016, 7: 10505. doi: 10.1038/ncomms10505 [27] Zhang Zhengguang, Wang Wei, Qiu Bo. Oceanic mass transport by mesoscale eddies[J]. Science, 2014, 345(6194): 322−324. doi: 10.1126/science.1252418 [28] Hu Jianyu, Gan Jianping, Sun Zhenyu, et al. Observed three-dimensional structure of a cold eddy in the southwestern South China Sea[J]. Journal of Geophysical Research:Oceans, 2011, 116(C5): C05016. [29] Dong Changming, Lin Xiayan, Liu Yu, et al. Three-dimensional oceanic eddy analysis in the Southern California Bight from a numerical product[J]. Journal of Geophysical Research: Oceans, 2012, 117(C7): C00H14. [30] Lin Xiayan, Dong Changming, Chen Dake, et al. Three-dimensional properties of mesoscale eddies in the South China Sea based on eddy-resolving model output[J]. Deep-Sea Research Part I: Oceanographic Research Papers, 2015, 99: 46−64. doi: 10.1016/j.dsr.2015.01.007 [31] Blazevski D, Haller G. Hyperbolic and elliptic transport barriers in three-dimensional unsteady flows[J]. Physica D: Nonlinear Phenomena, 2014, 273−274: 46−62. doi: 10.1016/j.physd.2014.01.007 [32] Onu K, Huhn F, Haller G. LCS Tool: A computational platform for Lagrangian coherent structures[J]. Journal of Computational Science, 2015, 7: 26−36. doi: 10.1016/j.jocs.2014.12.002 [33] Mason E, Pascual A, McWilliams J C. A new sea surface height-based code for oceanic mesoscale eddy tracking[J]. Journal of Atmospheric and Oceanic Technology, 2014, 31(5): 1181−1188. doi: 10.1175/JTECH-D-14-00019.1 [34] Leterme S C, Pingree R D. The gulf stream, rings and north atlantic eddy structures from remote sensing (altimeter and seawifs)[J]. Journal of Marine Systems, 2008, 69(3/4): 177−190. doi: 10.1016/j.jmarsys.2005.11.022 [35] Yang Guang, Wang Fan, Li Yuanlong, et al. Mesoscale eddies in the northwestern subtropical Pacific Ocean: Statistical characteristics and three-dimensional structures[J]. Journal of Geophysical Research Oceans, 2013, 118(4): 1906−1925. doi: 10.1002/jgrc.20164 -


 下载:
下载:


