

Numerical simulation of storm surge inundation in block scale
-
摘要: 本文利用ADCIRC模型,在宁波市北仑区建立了街区尺度的风暴潮漫滩模型,北仑区陆地分辨率达5~10 m。模拟结果整体展现漫滩淹没城市街道建筑的过程,细致刻画了水流在街区和建筑错综复杂分布时的流动情况,以及不同建筑物附近水深的变化,比以往的漫滩模拟更加精细,体现街区尺度网格的优势。数值模拟结果表明:此模型可以较好地模拟1211号台风“海葵”和5612号台风“温黛”的风暴潮过程。利用卫星遥感图像对北仑区地物进行分类,考虑下垫面底摩擦变化对漫滩模拟的影响。对比未考虑底摩擦情况的模拟实验结果,淹没面积减少了21.4%,大部分区域水深降低在0.1~0.2 m,街区尺度网格细致展示出不同地物所在区域的水深降低程度以及淹没面积变化。Abstract: This paper uses the ADCIRC model to establish a block-scale storm surge inundation model in the Beilun District, Ningbo City, with a land resolution of 5−10 m in the Beilun District. The simulation results show the overall process of inundation flooding urban street buildings, and detail description of the flow of water in the complex distribution of blocks and buildings, as well as changes in water depth near different buildings, which are more refined than previous inundation simulations, reflecting the advantages of block scale grid. Numerical simulation results show that this model can simulate the storm surge process of No. 1211 Typhoon “Haikui” and No. 5612 Typhoon “Wanda” well. Satellite remote sensing images are used to classify features in the Beilun District, and the influence of changes in the friction of different underlying surfaces on inundation simulation is considered. Comparing the results of the simulation experiment without considering the underlying surface friction, the submerged area is reduced by 21.4%, and the water depth in most areas is reduced to 0.1−0.2 m. The block-scale grid shows the degree of water depth reduction and the change of submerged area in different areas.
-
Key words:
- storm surge /
- inundation /
- block scale /
- underlying surface friction
-

图 3 大洋所选网格区域(a)、北仑区附近海域(b)以及北仑区局部放大的陆地网格(c)
Fig. 3 The selected grid of ocean (a), the sea area near the Beilun District (b), and the land grid magnified locally in the Beilun District (c)

图 4 大洋(a)和北仑区附近海域(b)水深分布
Fig. 4 The distribution of water depth in the ocean (a) and nearby seas of Beilun District (b)
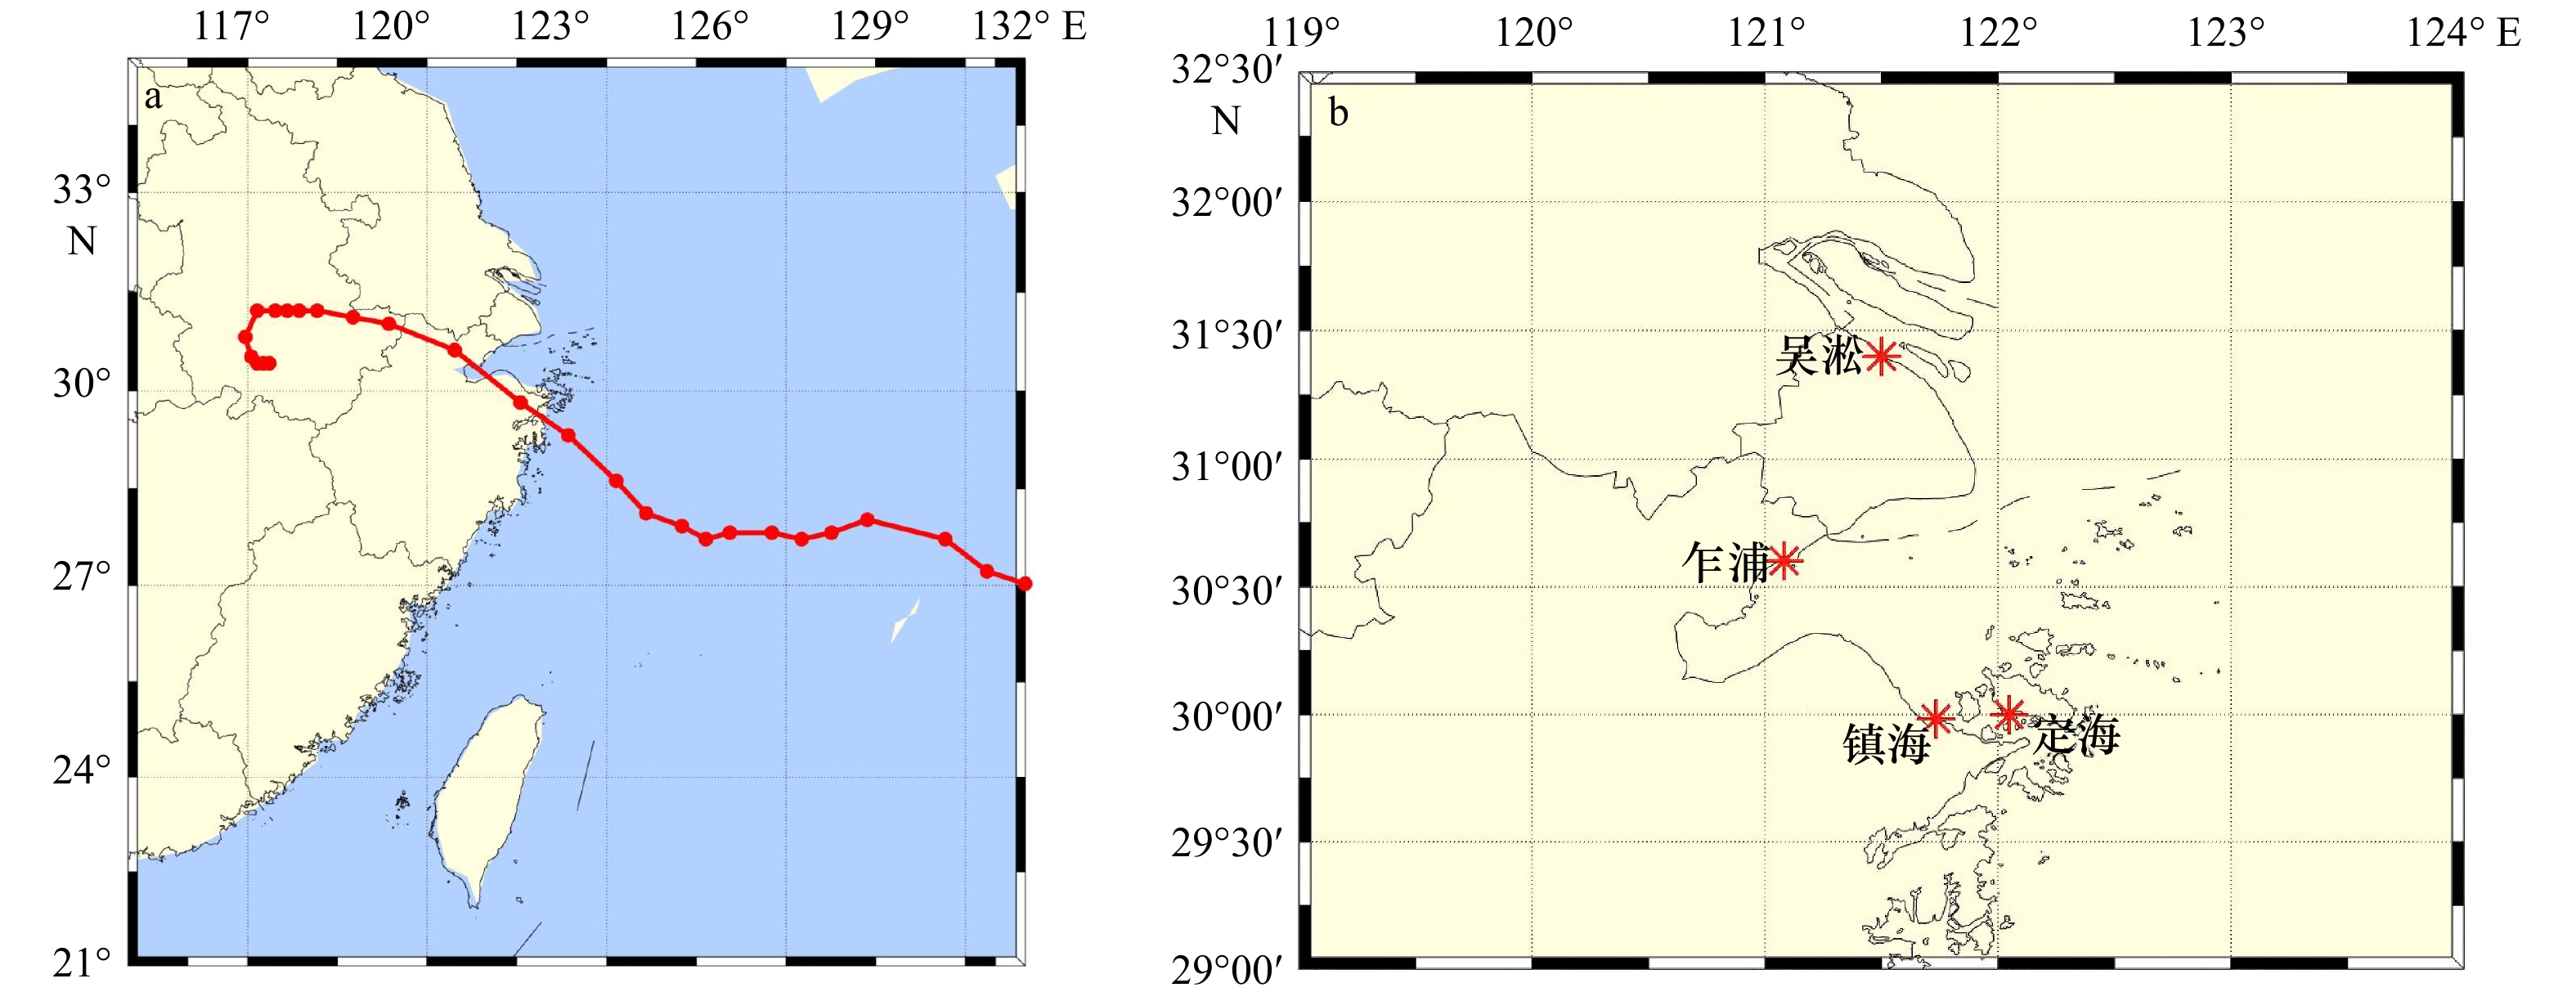
图 6 1211号台风“海葵”路径(a)和验潮站分布(b)
Fig. 6 Track of No. 1211 Typhoon Haikui (a) and distribution of tide gauge stations (b)

图 7 镇海、吴淞、乍浦和定海站风暴潮实测值和模拟值对比
Fig. 7 Comparison of measured and simulated storm surge values at Zhenhai,Wusong, Zhapu and Dinghai stations

图 8 5612号台风“温黛”路径(a)和验潮站位置分布(b)
Fig. 8 Track of No. 5612 Typhoon Wanda (a) and location distribution of tide gauge stations (b)

图 9 镇海、吴淞、乍浦和高桥站风暴潮实测值与模拟值对比
Fig. 9 Comparison of measured and simulated storm surge values at Zhenhai,Wusong, Zhapu and Gaoqiao stations

图 10 甬江澄浪堰和姚江大闸径流边界位置分布
Fig. 10 Runoff boundary location distribution of Chenglang Weir on Yongjiang River and Yaojiang Gate
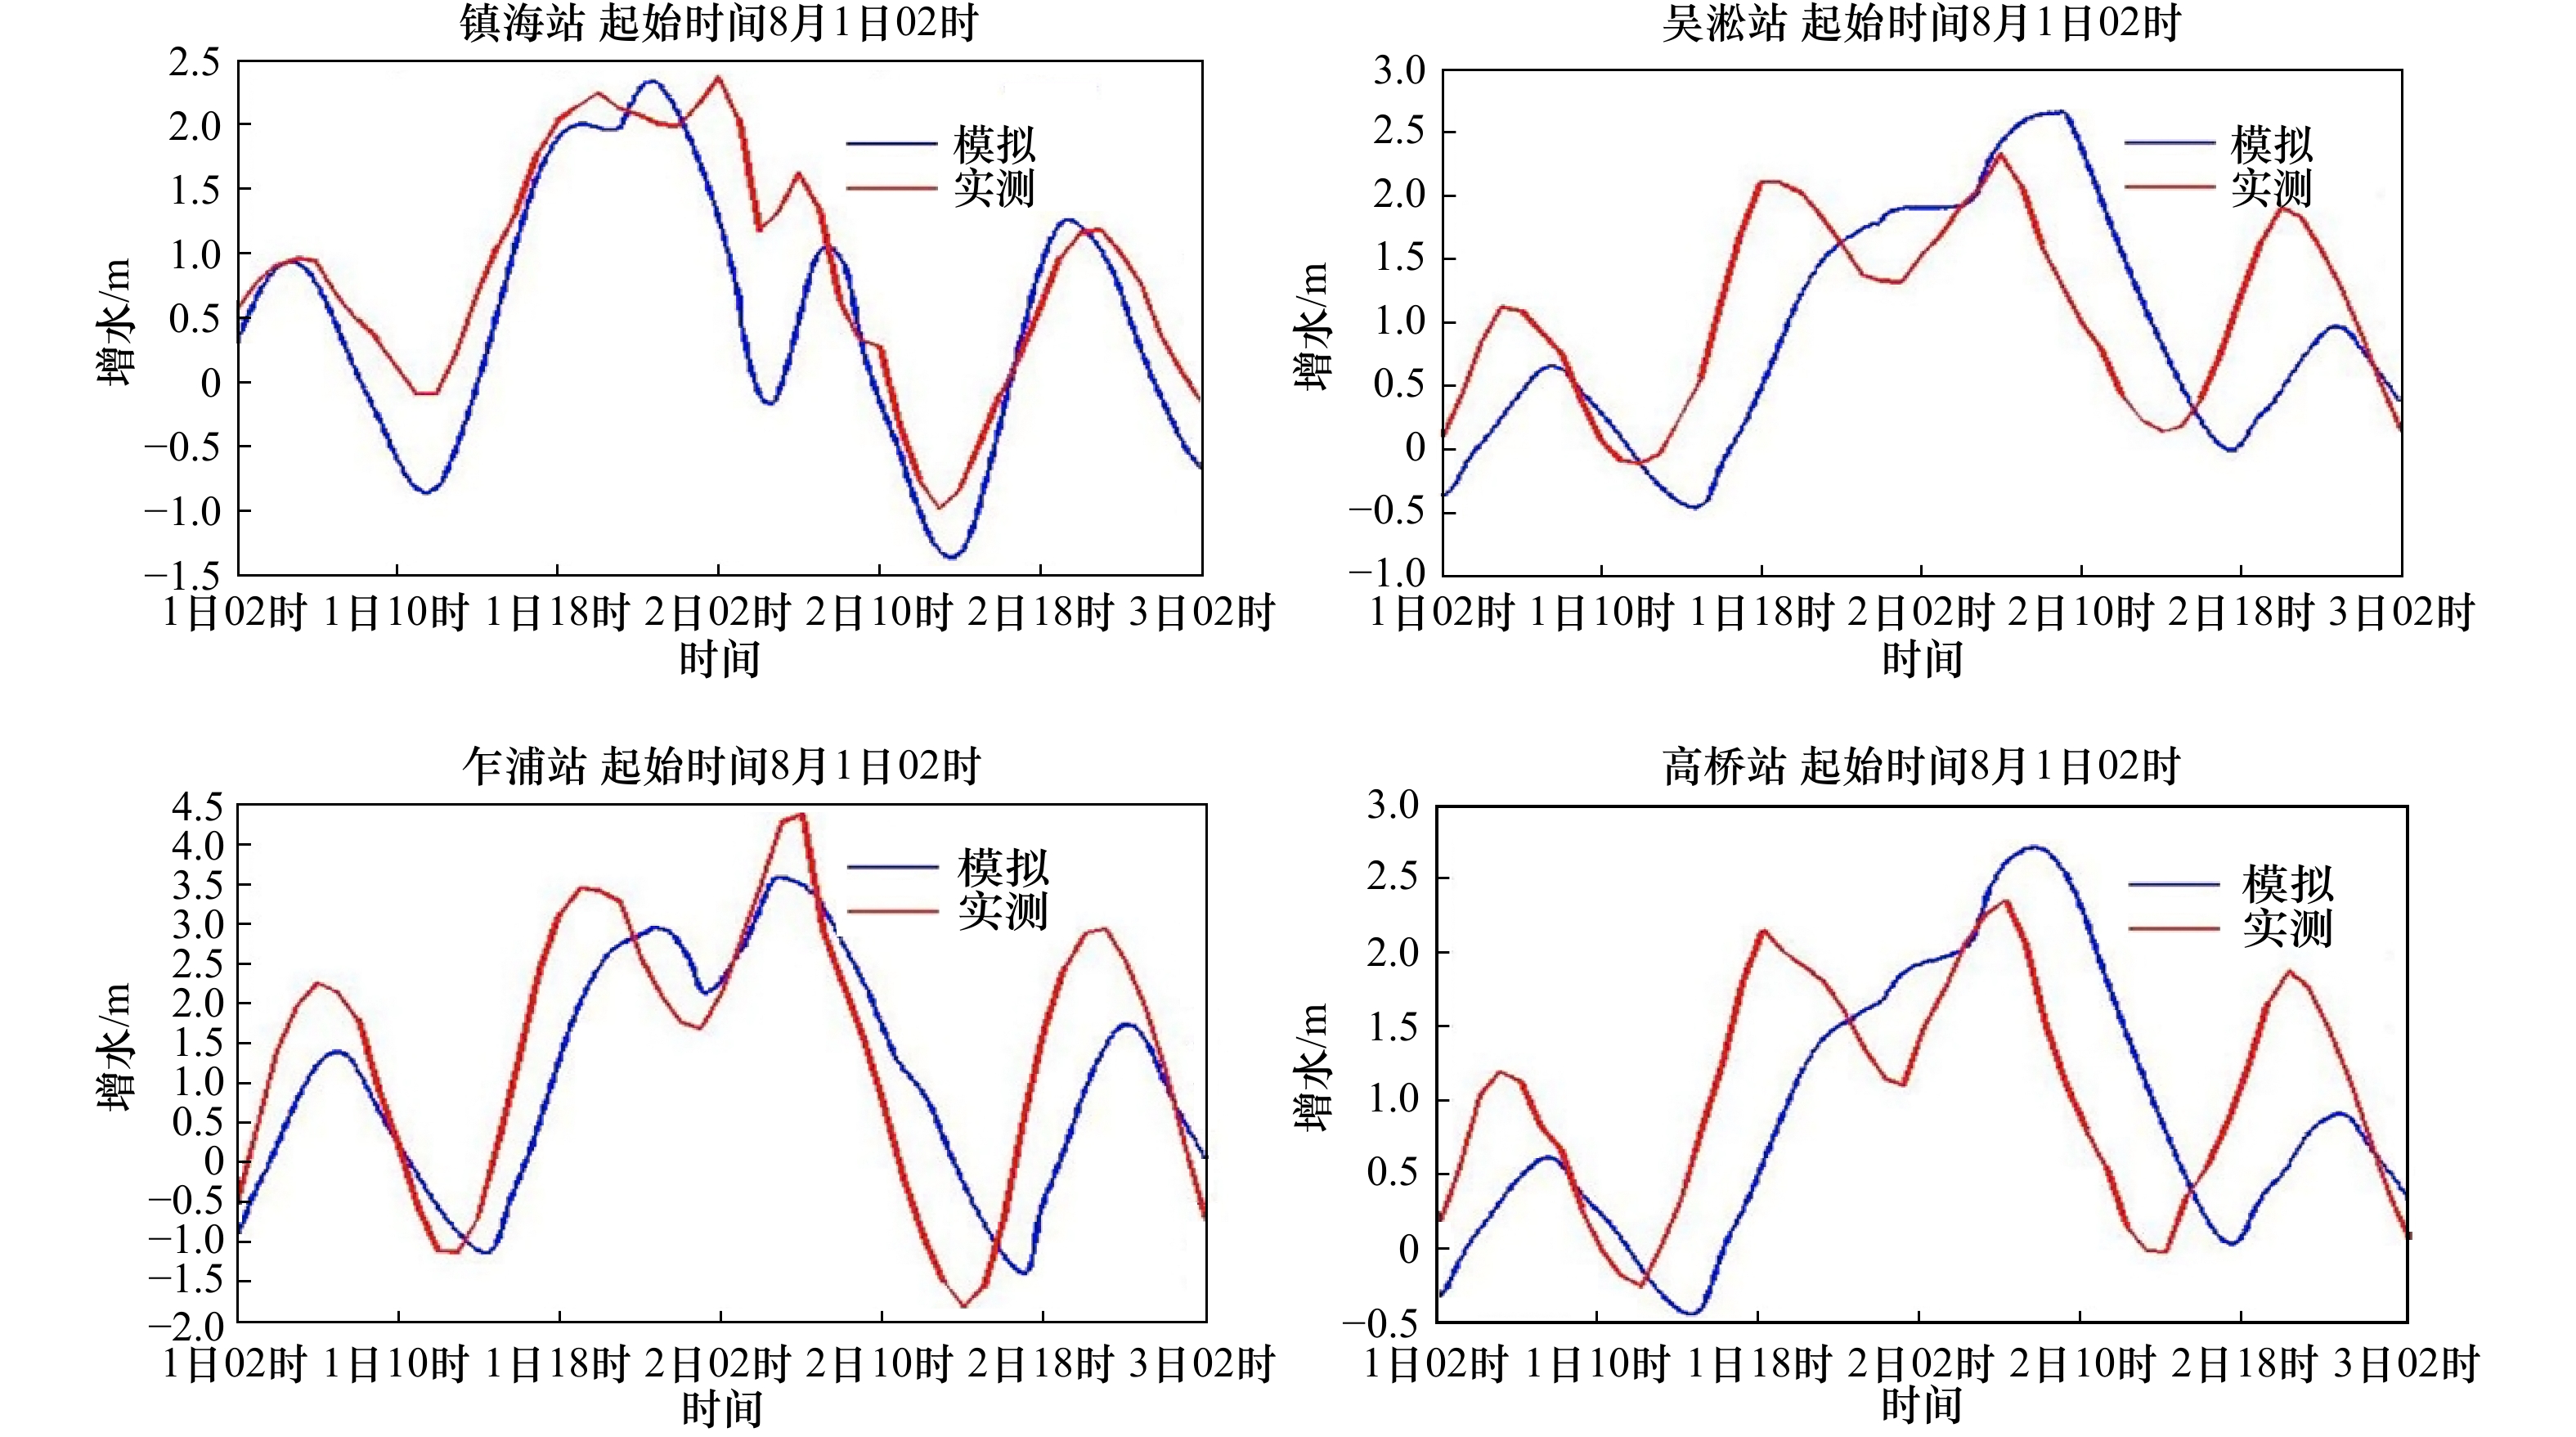
图 11 镇海、吴淞、乍浦和高桥站总潮位实测值与模拟值对比
Fig. 11 Comparison of measured and simulated total tide level at Zhenhai, Wusong, Zhapu and Gaoqiao stations
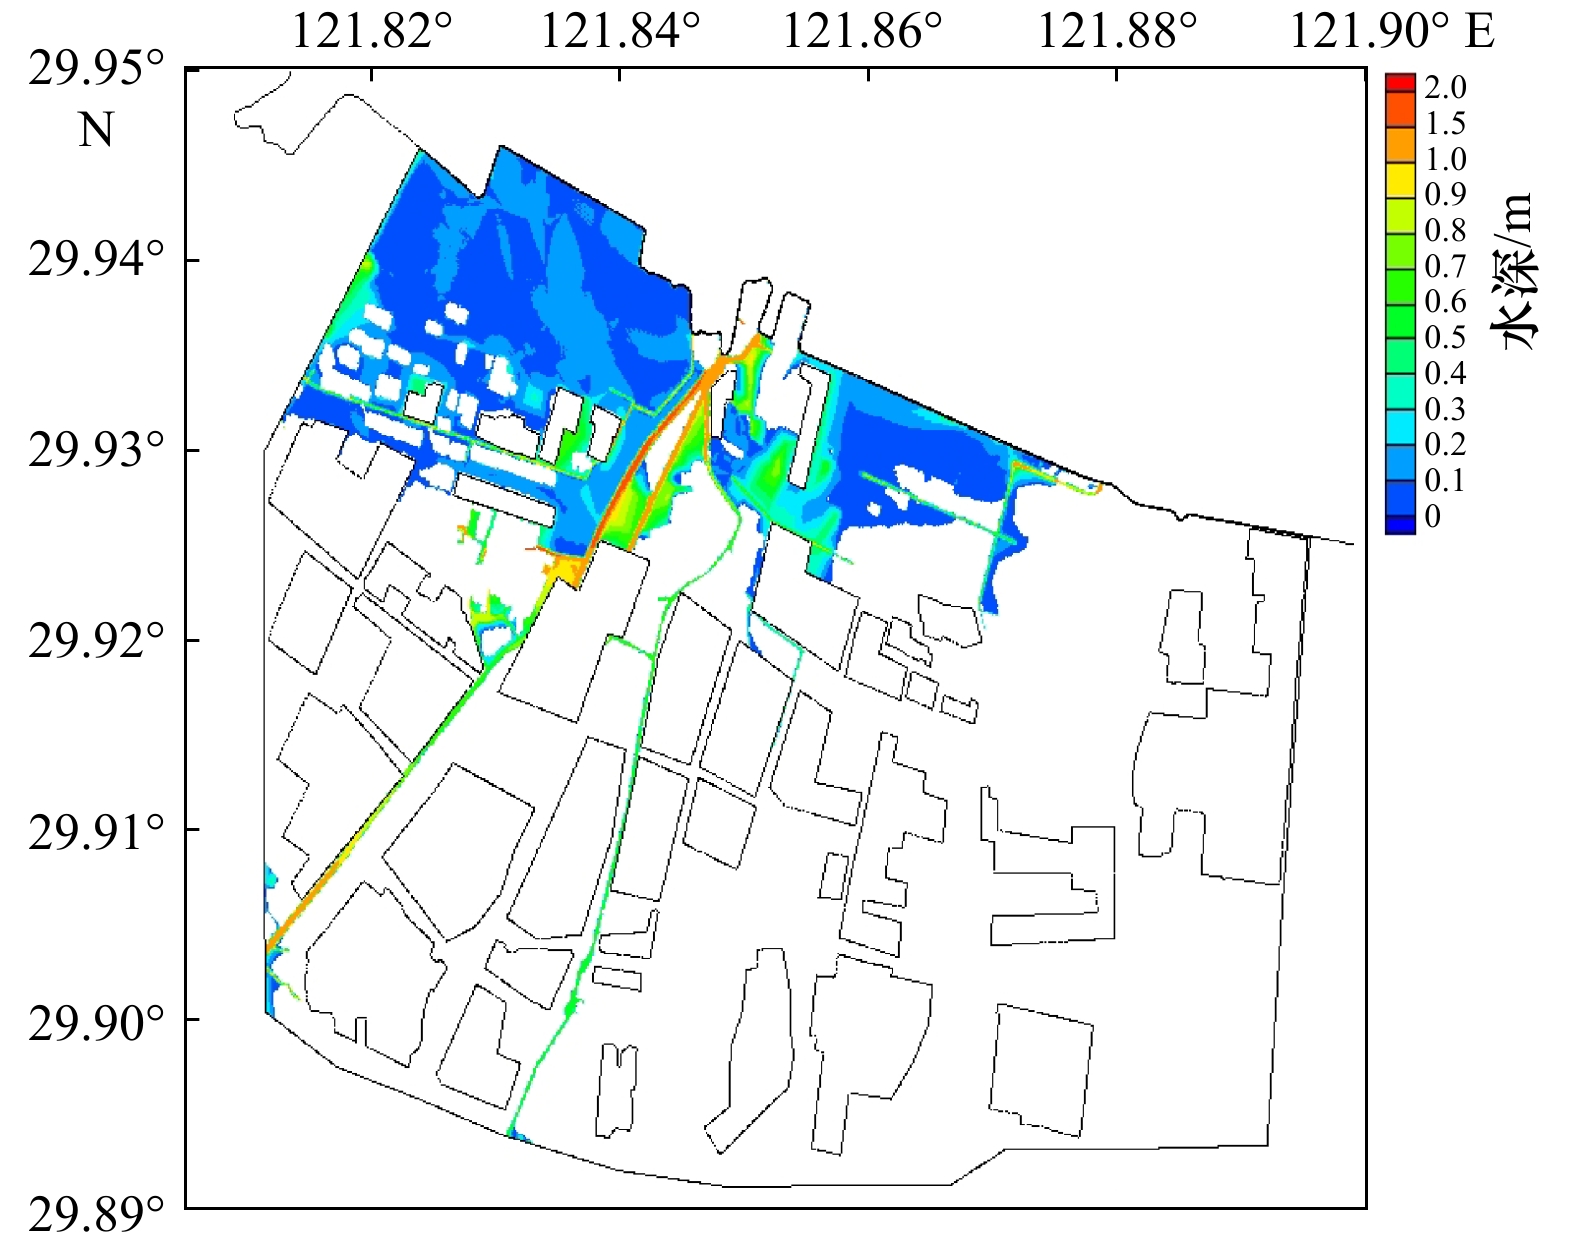
图 12 5612号台风“温黛”漫滩模拟的最大淹没范围
Fig. 12 Maximum inundation area simulated by No. 5612 Typhoon Wanda

图 13 5612号台风“温黛”漫滩过程三维图
Fig. 13 Three-dimensional diagram of the inundation process of No. 5612 Typhoon Wanda

图 15 考虑下垫面底摩擦变化后,北仑区最大淹没范围
Fig. 15 The maximum submerged area of Beilun District after considering the change of the underlying surface friction

图 16 考虑下垫面底摩擦变化前后,北仑区最大淹没水深差值
Fig. 16 Maximum submerged depth difference in the Beilun District before and after considering the underlying surface friction

图 17 考虑下垫面底摩擦变化前后,淹没区域变化
红色表示面积增加;蓝色表示面积减少
Fig. 17 The change of the submerged area before and after considering the change of the underlying surface friction
Red represents increased area; blue represents reduced area
表 1 4个验潮站最大增水实测值和模拟值相对误差分析统计(单位:m)
Tab. 1 Statistical table of relative error analysis of the measured and simulated values of the maximum water increasing at 4 tide gauge stations (unit: m)
站名 实测值 模拟值 相对误差 镇海 1.67 1.6 4.2% 吴淞 1.5 1.45 3.3% 乍浦 3.03 2.72 10.2% 定海 1.55 1.41 9%  下载: 导出CSV
表 2 4个验潮站最大增水实测值与模拟值相对误差分析统计表(单位:m)
Tab. 2 Statistical table of relative error analysis between the measured and simulated values of the maximum water increasing at 4 tide gauge stations (unit: m)
站名 实测值 模拟值 相对误差 镇海 2.52 2.75 9.13% 吴淞 2.16 2.44 12.96% 乍浦 4.11 4.34 5.6% 高桥 2.39 2.52 5.44%
下载: 导出CSV
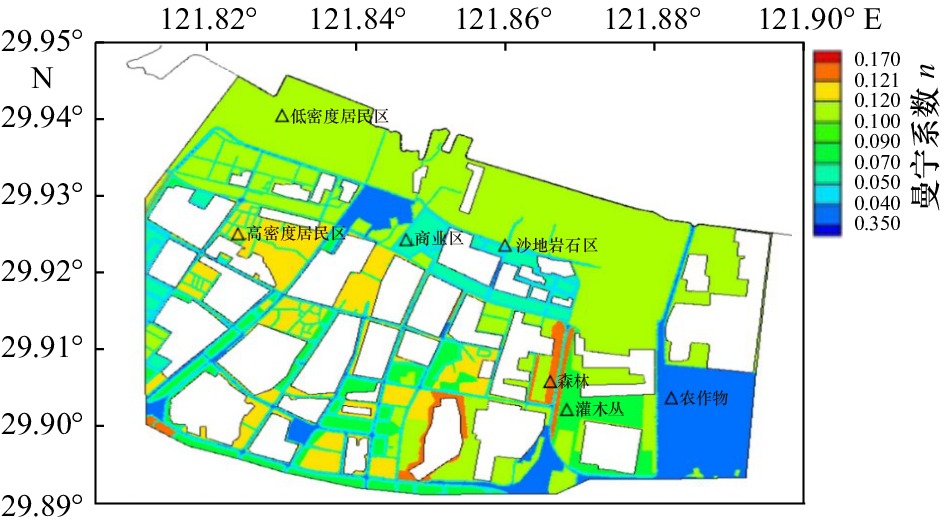
表 3 7类地物的曼宁系数(n)设置
Tab. 3 Manning-n settings for seven types of features
等级 21 22 23 31 43 51 83 n 0.120 0.121 0.050 0.040 0.170 0.070 0.035 地物描述 低密度居民区 高密度居民区 商业区 裸露的岩石和沙地 四季常青和随季节变化的两种森林的混合 灌木丛 农作物稀少地
下载: 导出CSV
-
[1] 石先武, 谭骏, 国志兴, 等. 风暴潮灾害风险评估研究综述[J]. 地球科学进展, 2013, 28(8): 866−874. doi: 10.11867/j.issn.1001-8166.2013.08.0866Shi Xianwu, Tan Jun, Guo Zhixing, et al. A review of risk assessment of storm surge disaster[J]. Advances in Earth Science, 2013, 28(8): 866−874. doi: 10.11867/j.issn.1001-8166.2013.08.0866 [2] 冯士筰. 风暴潮的研究进展[J]. 世界科技研究与发展, 1998, 20(4): 44−47.Feng Shizuo. The advance of researches on storm surges[J]. World Sci-Tech Research & Development, 1998, 20(4): 44−47. [3] 王喜年. 风暴潮预报知识讲座[J]. 海洋预报, 2001, 18(1): 73−78. doi: 10.3969/j.issn.1003-0239.2001.01.010Wang Xinian. Lectures on storm surge forecasting[J]. Marine Forecasts, 2001, 18(1): 73−78. doi: 10.3969/j.issn.1003-0239.2001.01.010 [4] 郑国诞, 谢亚力, 胡金春, 等. 台州温岭市风暴潮淹没危险性分析[J]. 海洋预报, 2016, 33(6): 40−50. doi: 10.11737/j.issn.1003-0239.2016.06.005Zheng Guodan, Xie Yali, Hu Jinchun, et al. Inundation risk assessment of typhoon storm surge along Taizhou Wenling City[J]. Marine Forecasts, 2016, 33(6): 40−50. doi: 10.11737/j.issn.1003-0239.2016.06.005 [5] 傅赐福, 于福江, 王培涛, 等. 滨海新区温带风暴潮灾害风险评估研究[J]. 海洋学报, 2013, 35(1): 55−62.Fu Cifu, Yu Fujiang, Wang Peitao, et al. A study on extratropical storm surge disaster risk assessment at Binhai New Area[J]. Haiyang Xuebao, 2013, 35(1): 55−62. [6] 李勇, 田立柱, 裴艳东, 等. 渤海湾西部风暴潮漫滩数值模拟[J]. 地质通报, 2016, 35(10): 1638−1645. doi: 10.3969/j.issn.1671-2552.2016.10.011Li Yong, Tian Lizhu, Pei Yandong, et al. Numerical simulation of storm surge inundation in the west zone of Bohai Bay[J]. Geological Bulletin of China, 2016, 35(10): 1638−1645. doi: 10.3969/j.issn.1671-2552.2016.10.011 [7] Yang Jie, Li Linlin, Zhao Kuifeng, et al. A comparative study of Typhoon Hato (2017) and Typhoon Mangkhut (2018)—their impacts on coastal inundation in Macau[J]. Journal of Geophysical Research: Oceans, 2019, 124(12): 9590−9619. doi: 10.1029/2019JC015249 [8] Luettich R A, Westerrink J J. ADCIRC user manual: A (Parallel) advanced circulation model for oceanic[R]. Coastal and Estuarine Waters, 2006. http://www.marine.unc.edu/C_CATS/adcirc [9] Blain C A, Westerink J J, Luettich R A Jr. Grid convergence studies for the prediction of hurricane storm surge[J]. International Journal of Numerical Methods in Fluids, 1998, 26(4): 369−401. doi: 10.1002/(SICI)1097-0363(19980228)26:4<369::AID-FLD624>3.0.CO;2-0 [10] Greg J. Holland. An analytic model of the wind and pressure profiles in hurricanes[J]. Monthly weather review, 1980, 108(8): 1212−1218. [11] Garratt J R. Review of drag coefficients over oceans and continents[J]. Monthly weather review, 1977, 105(7): 915−929. [12] 郑杰. 5612号台风增水过程的两种数值模拟方法比较[J]. 中国高新技术企业, 2011(19): 30−32.Zheng Jie. Comparison of two numerical simulation methods for the water increasing process of typhoon No. 5612[J]. China High-Tech Enterprises, 2011(19): 30−32. [13] 李文杰, 邵学强. 甬江流域入海径流量研究[J]. 浙江水利科技, 2007(3): 53−55, 59. doi: 10.3969/j.issn.1008-701X.2007.03.022Li Wenjie, Shao Xueqiang. Research on runoff amount into sea in Yongjiang River basin[J]. Zhejiang Hydrotechnics, 2007(3): 53−55, 59. doi: 10.3969/j.issn.1008-701X.2007.03.022 [14] 任剑波, 施伟勇. 风拖曳力系数和曼宁系数对风暴潮流模拟的影响[J]. 人民长江, 2017, 48(18): 86−92.Ren Jianbo, Shi Weiyong. Influence of wind drag coefficient and Manning coefficient on storm current simulation[J]. Yangtze River, 2017, 48(18): 86−92. [15] Akbar M K, Kanjanda S, Musinguzi A. Effect of bottom friction, wind drag coefficient, and meteorological forcing in Hindcast of hurricane Rita storm surge using SWAN + ADCIRC model[J]. Journal of Marine Science and Engineering, 2017, 5(3): 38. doi: 10.3390/jmse5030038 [16] Chu Dongdong, Zhang Jicai, Wu Yongsheng, et al. Sensitivities of modelling storm surge to bottom friction, wind drag coefficient, and meteorological product in the East China Sea[J]. Estuarine, Coastal and Shelf Science, 2019, 231: 106460. doi: 10.1016/j.ecss.2019.106460 -


计量
- 文章访问数: 433
- HTML全文浏览量: 152
- PDF下载量: 54
- 被引次数: 0
