

Nighttime sea fog recognition based on Himawari-8 data
-
摘要: 海雾是一种发生在海面的灾害性天气现象,掌握海雾的分布与生消变化,能有效地减少海雾带来的危害。卫星遥感观测具有近实时、大范围覆盖、连续观测等特点,特别是高时间分辨率的静止卫星观测系统,能够对海雾的发生−发展−消亡过程进行动态跟踪观测。本文以2018‒2019年黄、渤海发生的海雾事件为样例,利用日本静止气象卫星Himawari-8(H-8)红外辐射数据,分析海雾的多通道红外亮温辐射特性,通过不同波段差和波段比组合,定义海雾和晴空水体分离指数、海雾和一般云系分离指数、多通道亮温差斜率指数以及中红外亮温纹理指数,提出基于多指数概率分布的夜间海雾监测算法;算法分别应用于H-8和韩国静止气象卫星GEO-KOMPSAT2A(GK-2A)数据,对2020年2‒6月发生的6次海雾事件多时次卫星观测识别出的海雾位置分布和覆盖面积进行对比实现互验证,结果表明,本文提出的夜间海雾监测算法能有效地实现夜间海雾的识别;选择2020年4月29日夜间H-8和GK-2A 每10 min一次连续观测数据的监测结果,对海雾的发生区域进行跟踪分析,清晰地展现出此次海雾事件的发生、发展演变过程,说明算法能清楚地监测出各时段海雾的分布,跟踪海雾的发展变化,可为海上大雾的防灾减灾提供科学依据和决策基础。Abstract: Sea fog is a kind of disastrous weather phenomenon which occurs on the sea surface. Mastering the distribution and dynamic changes of sea fog can effectively reduce the disasters caused by sea fog. Satellite remote sensing observation has the characteristics of near real time, wide coverage, continuous observation and so on. Especially the geostationary satellite remote sensing observation with high time resolution, which can continuously and dynamically track the occurrence, development and extinction of sea fog. The sea fog events in the Yellow Sea and Bohai Sea are taken from 2018 to 2019 as examples in this paper. Based on the analysis of the multi-channel bright temperature radiation characteristics of sea fog in the Yellow Sea and Bohai Sea by using Himawari-8 (H-8) geostationary satellite data, the separation index of sea fog and cloud, the separation index of sea fog and water, the slope index of multi-band brightness temperature difference and texture index of mid-infrared bright temperature are defined through the difference and ratio combination of different bands, and the night sea fog monitoring algorithm based on multi-exponential probability distribution is proposed to realize the automatic identification of sea fog at night. The algorithm is applied to H-8 and GEO-KOMPSAT2A (GK-2A) geostationary satellite data respectively. The position distribution and coverage area of sea fog identify by multi-time satellite observations of six sea fog events from February to June 2020 are compared to achieve mutual verification. The results show that the algorithm proposed in this paper can effectively recognize sea fog at night. The monitoring results every 10 minutes of continuous observations of H-8 and GK-2A at night on April 29, 2020 are selected to follow up and analyze the area where sea fog occurred, it shows the occurrence, development and evolution of the sea fog event clearly. It indicates that the algorithm can monitor the distribution of sea fog and track the development and change of fog. It can provide scientific basis and decision-making basis for the prevention and mitigation of sea fog.
-

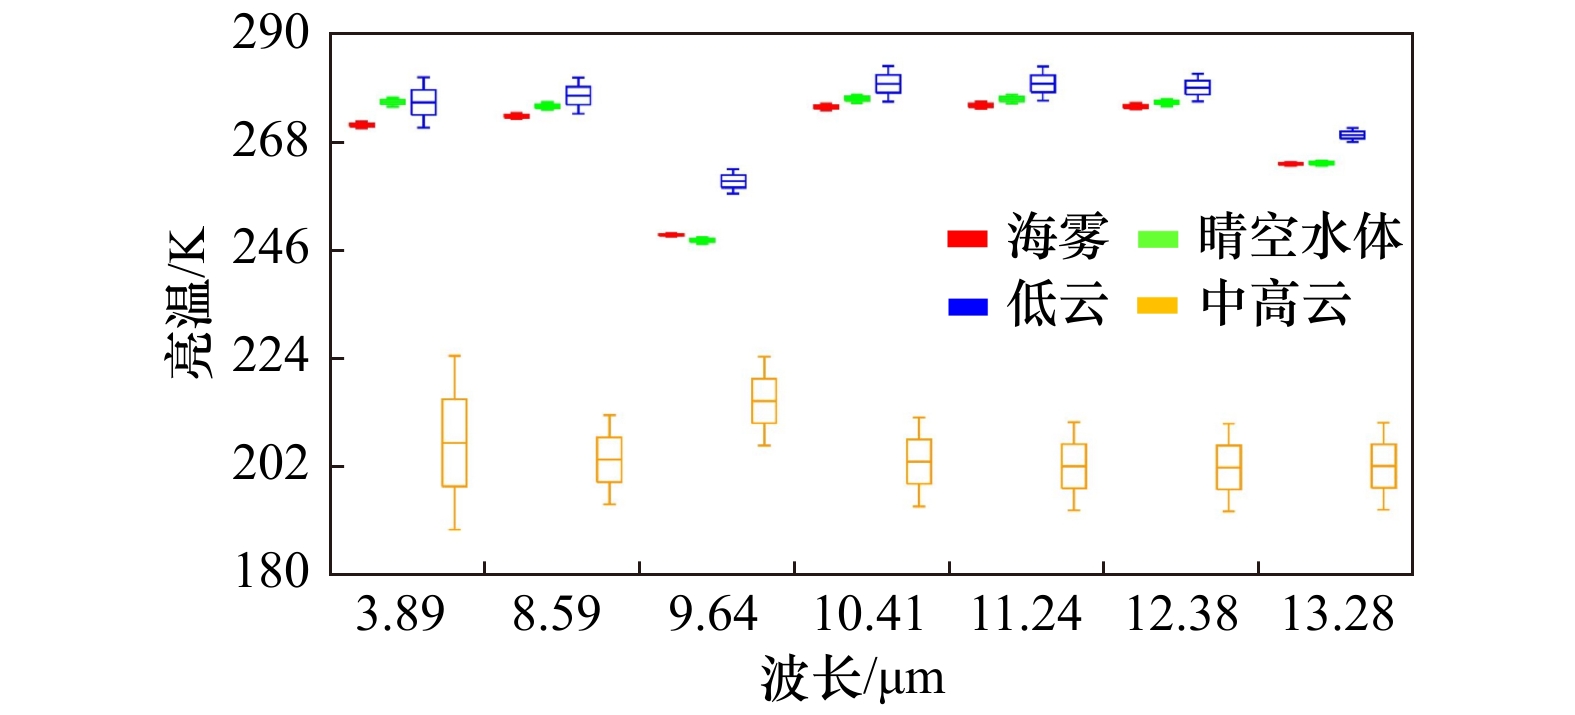
图 2 不同地物类型在7个通道的亮温分布
Fig. 2 Distribution of brightness temperature of different types of feature in 7 channels
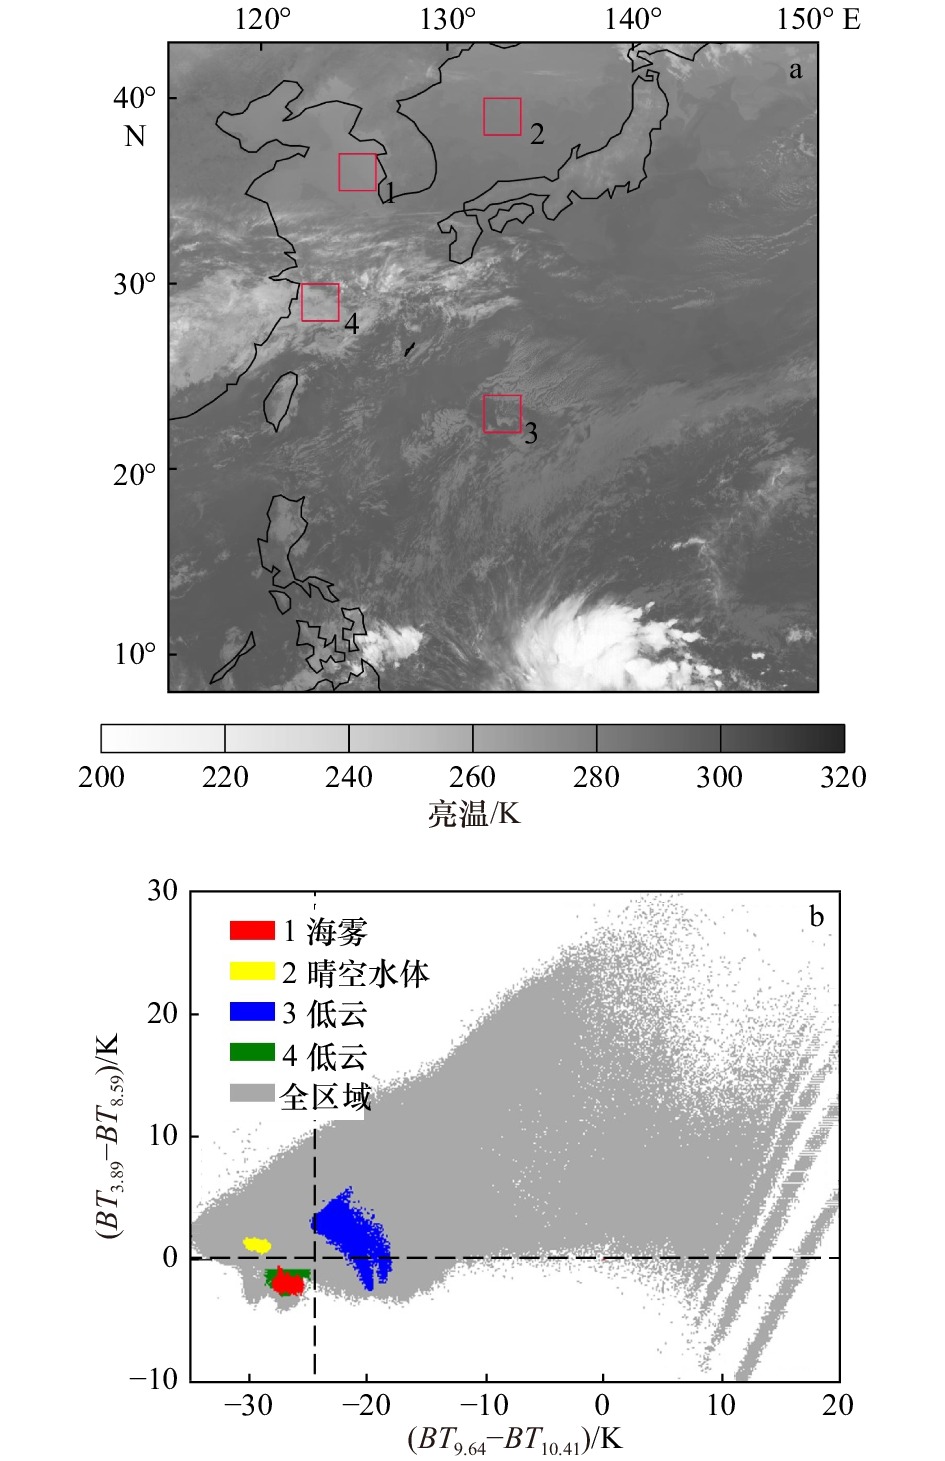
图 3 不同典型地物样本分布区域(a)及其在亮温差(
$ {BT}_{3.89}-{BT}_{8.59} $ )和亮温差($ {BT}_{9.64}-{BT}_{10.41} $ )上的散点分布(b)海雾区标识为区域1;晴空水体区标识为区域2;低云区标识为区域3和区域4
Fig. 3 Sample distribution areas of different typical features (a) and their scatter plot distribution on (
$ {BT}_{3.89}-{BT}_{8.59} $ ) and ($ {BT}_{9.64}-{BT}_{10.41} $ )(b)The sea fog area is identified as area 1; the water area is identified as area 2; the low cloud area is identified as area 3 and area 4
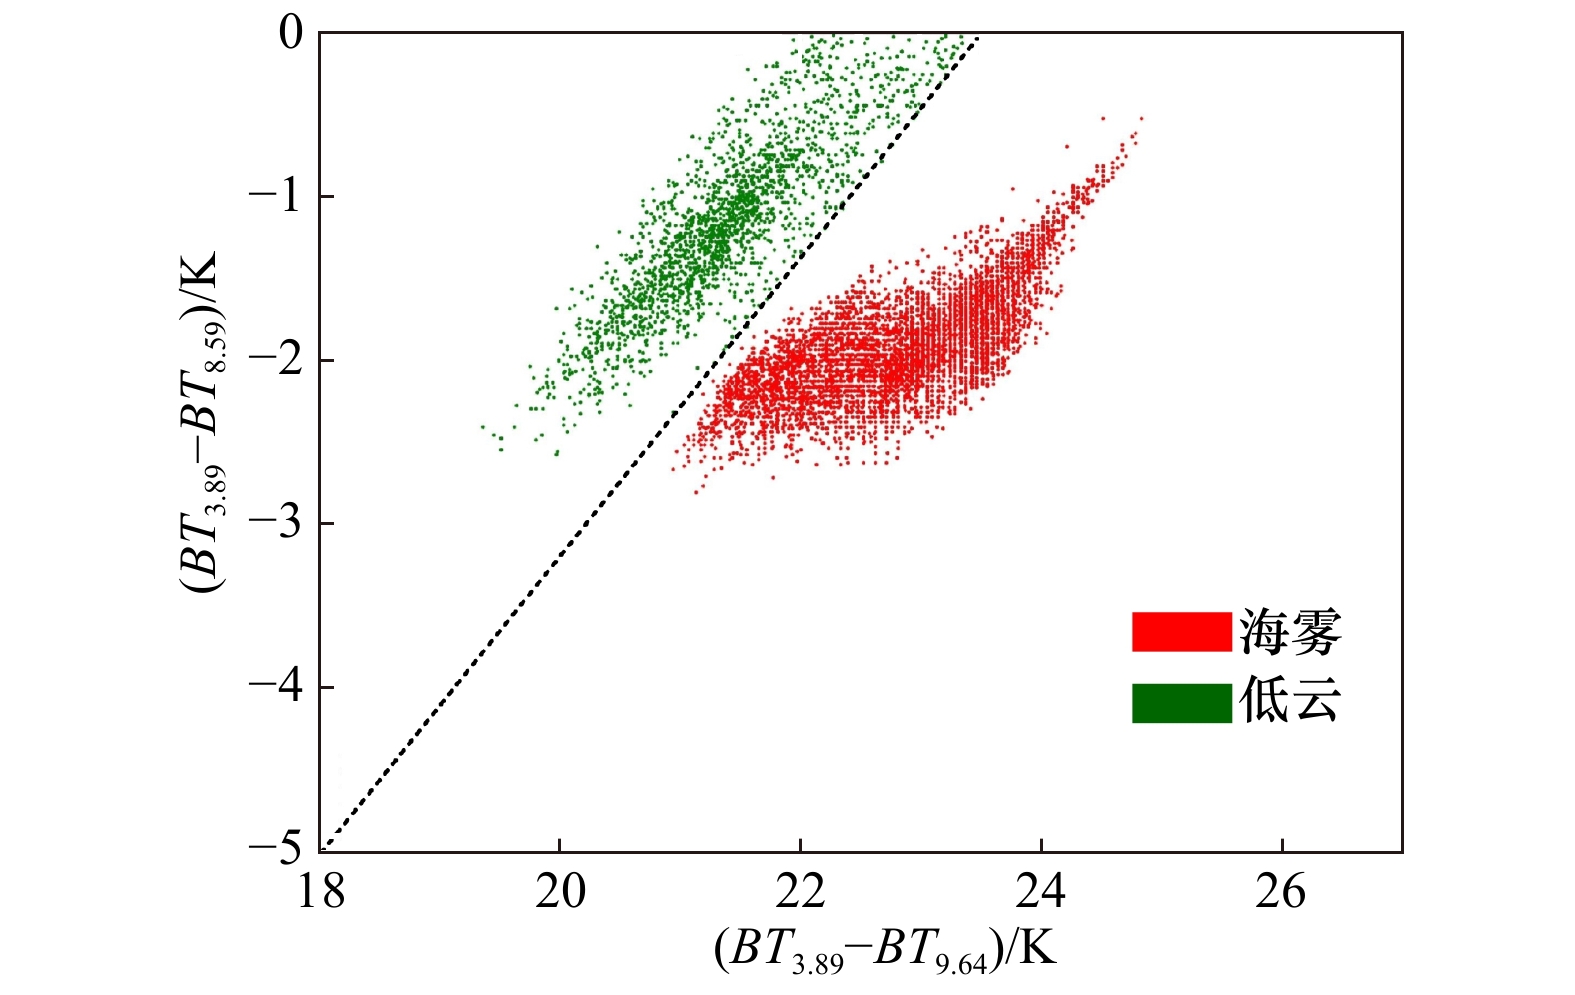
图 4 海雾与区域4的低云在亮度温度差(
${{{B}{T}}_{3.89}-{B}{T}}_{8.59}$ )和亮度温度差(${{{B}{T}}_{3.89}-{B}{T}}_{9.64}$ )上的散点分布Fig. 4 Scatter distribution of (
${{{B}{T}}_{3.89}-{B}{T}}_{8.59}$ ) and (${{{B}{T}}_{3.89}-{B}{T}}_{9.64}$ ) in sea fog and area 4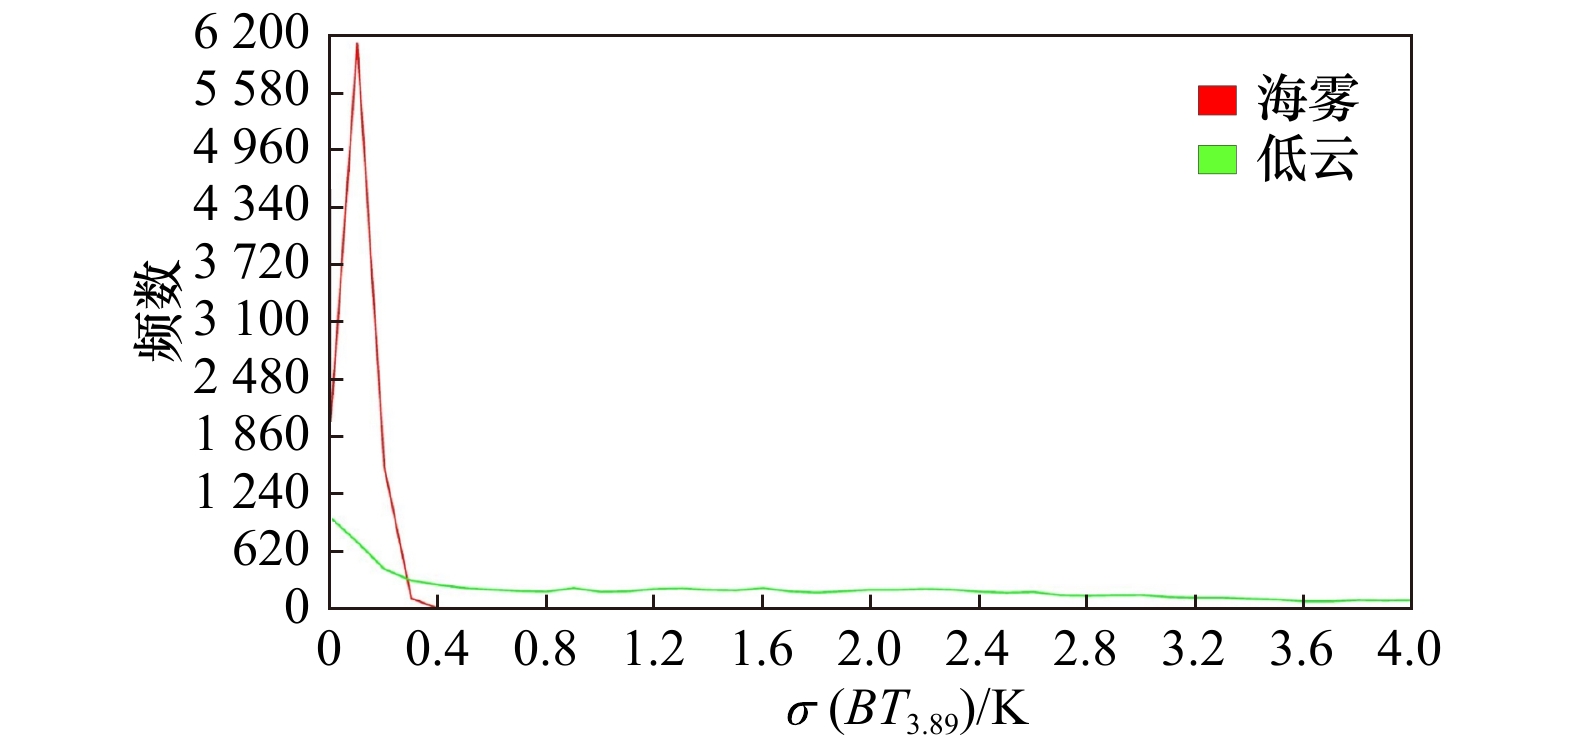
图 5 海雾和一般低云云体的
$ \mathrm{\sigma } \;\left({BT}_{3.89}\right) $ 频数分布Fig. 5
$ \mathrm{\sigma } \;\left({BT}_{3.89}\right) $ frequency distribution of sea fog and low cloud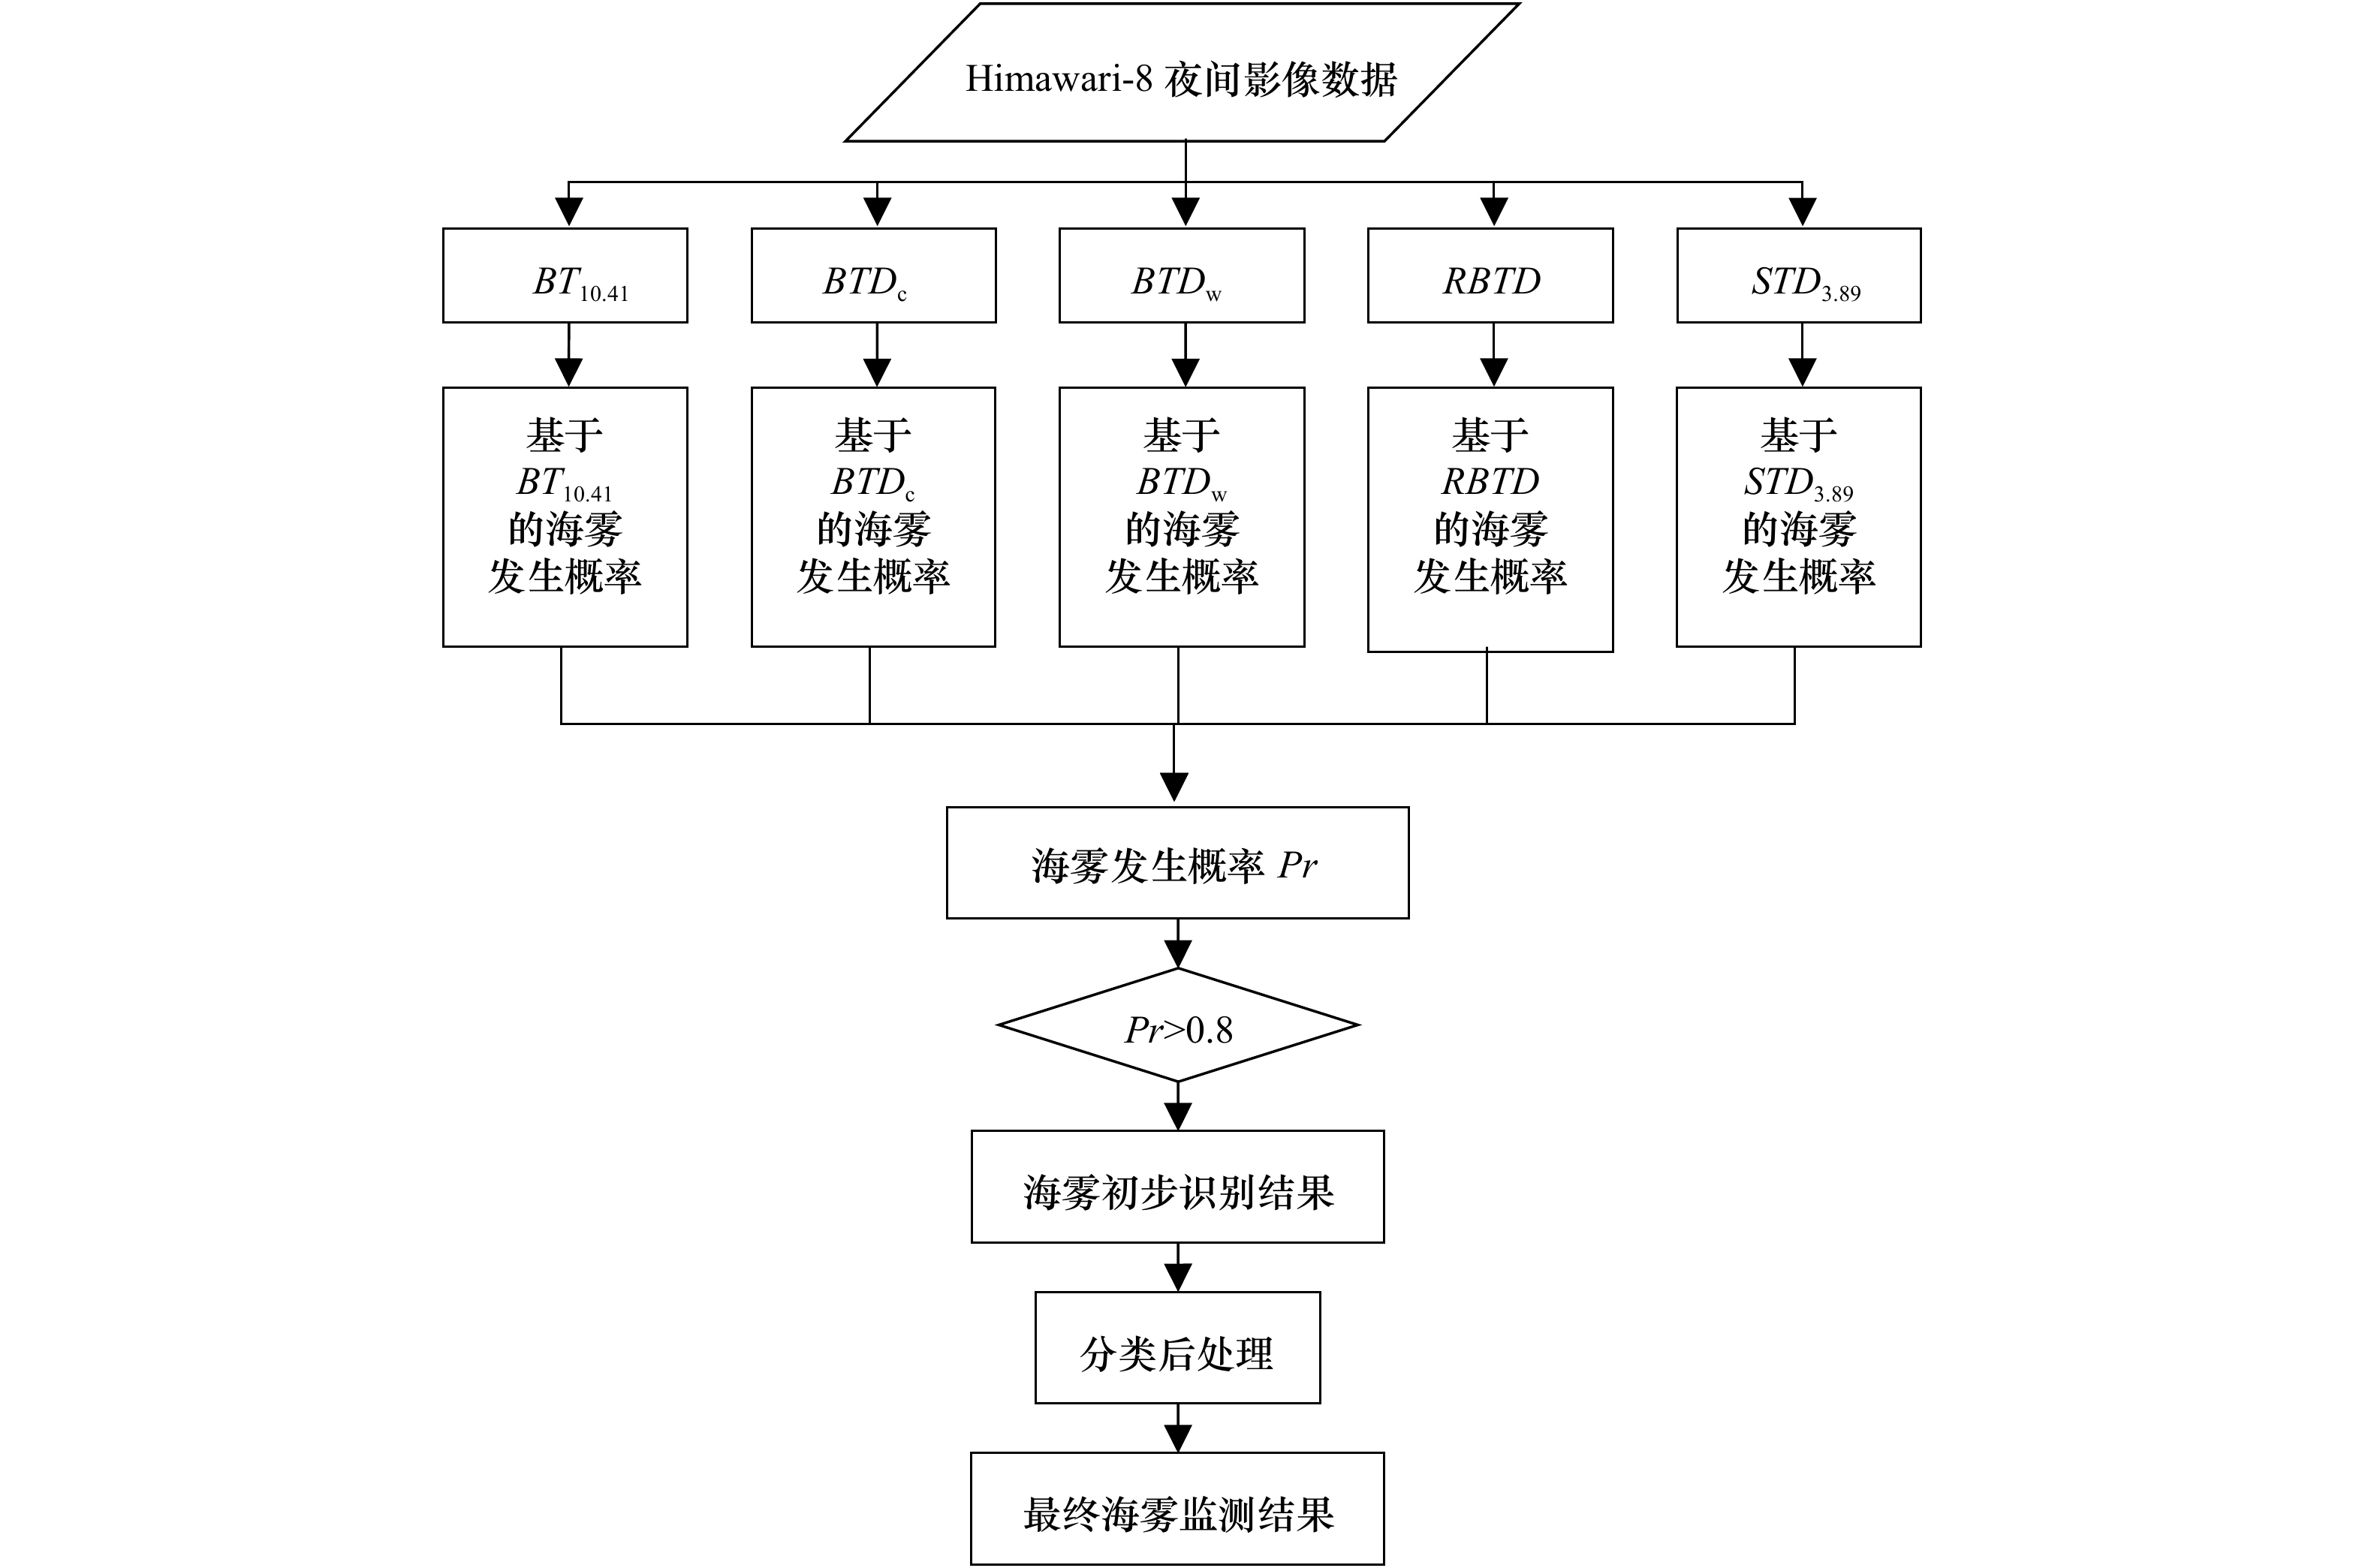
图 6 基于多指数概率分布的夜间海雾监测算法
Fig. 6 Night sea fog monitoring algorithm based on multi-exponential probability distribution

图 7 海雾样本的
$ {BTD}_{\mathrm{c}} $ 频数分布直方图Fig. 7 Histogram of
$ {BTD}_{\mathrm{c}} $ distribution for sea fog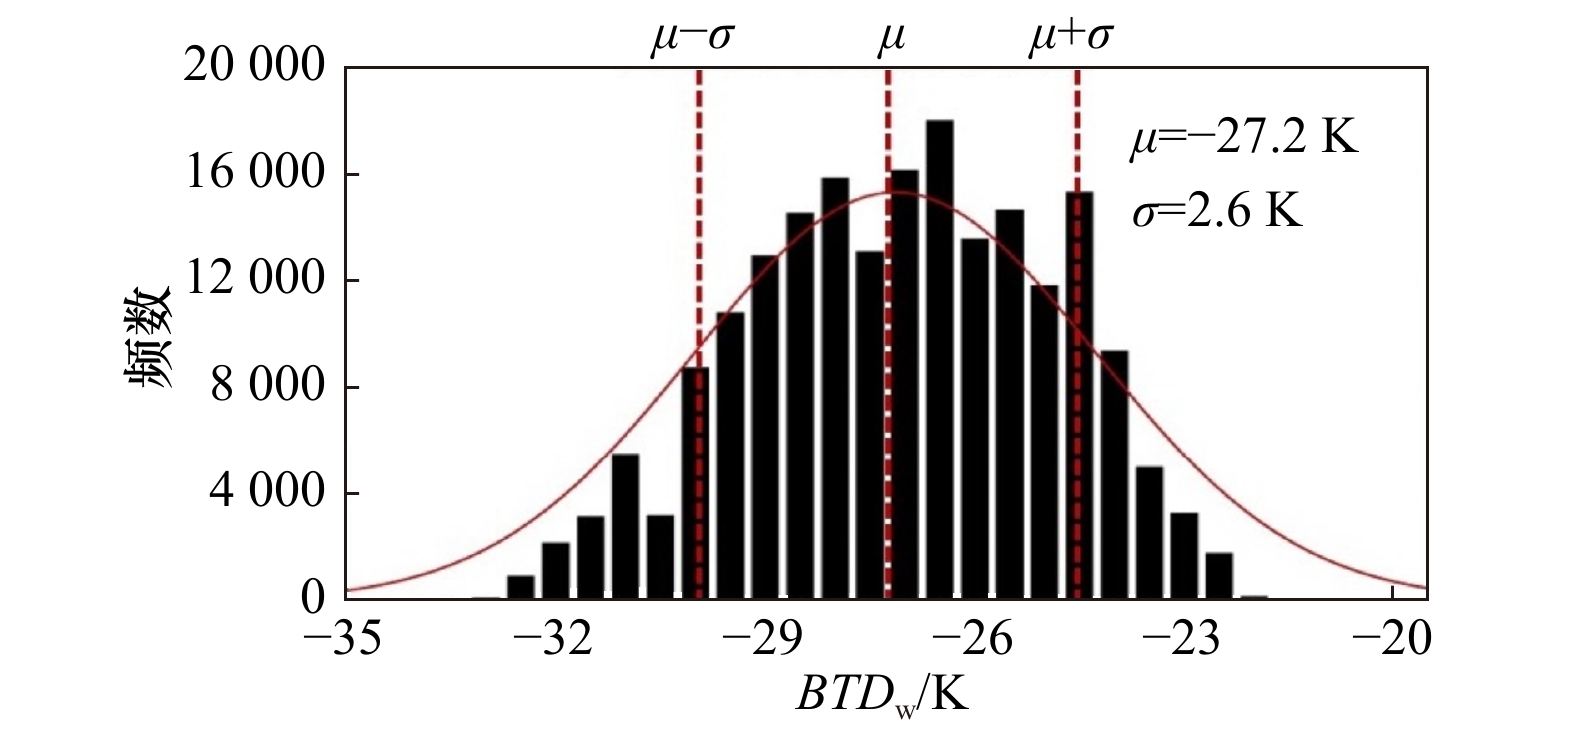
图 8 海雾样本的
$ {BTD}_{\mathrm{w}} $ 频数分布直方图Fig. 8 Histogram of
$ {BTD}_{\mathrm{w}} $ distribution for sea fog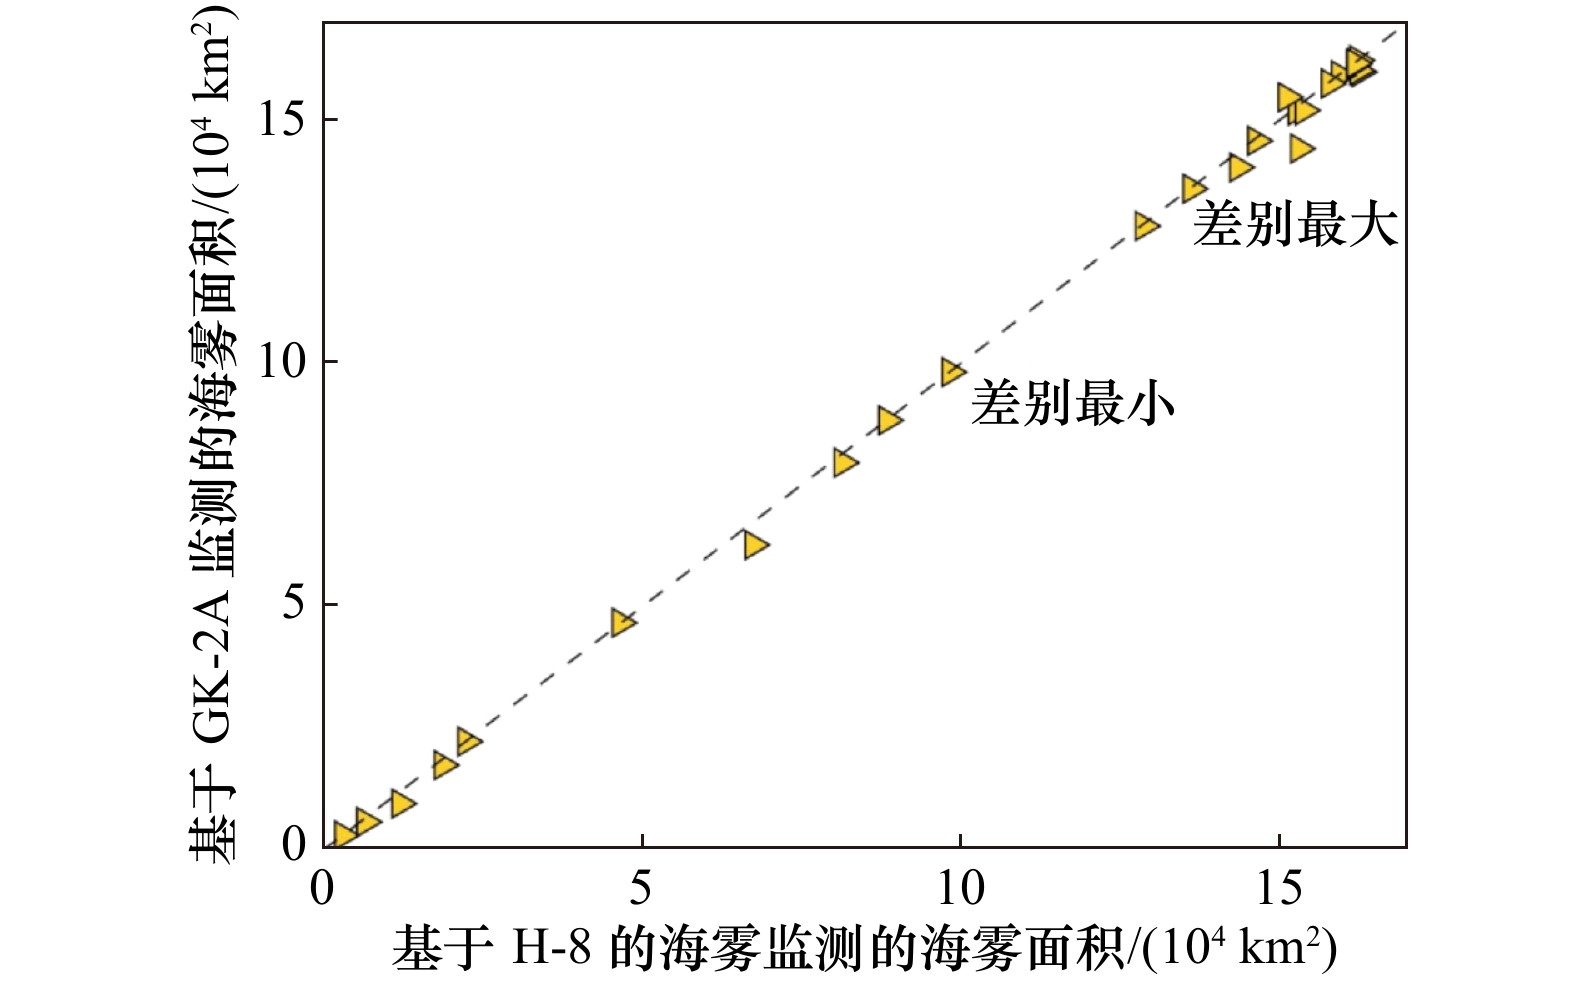
图 10 H-8卫星与GK-2A卫星监测出的海雾覆盖面积对比
Fig. 10 Comparison of the coverage area of sea fog monitor results based on H-8 and GK-2A
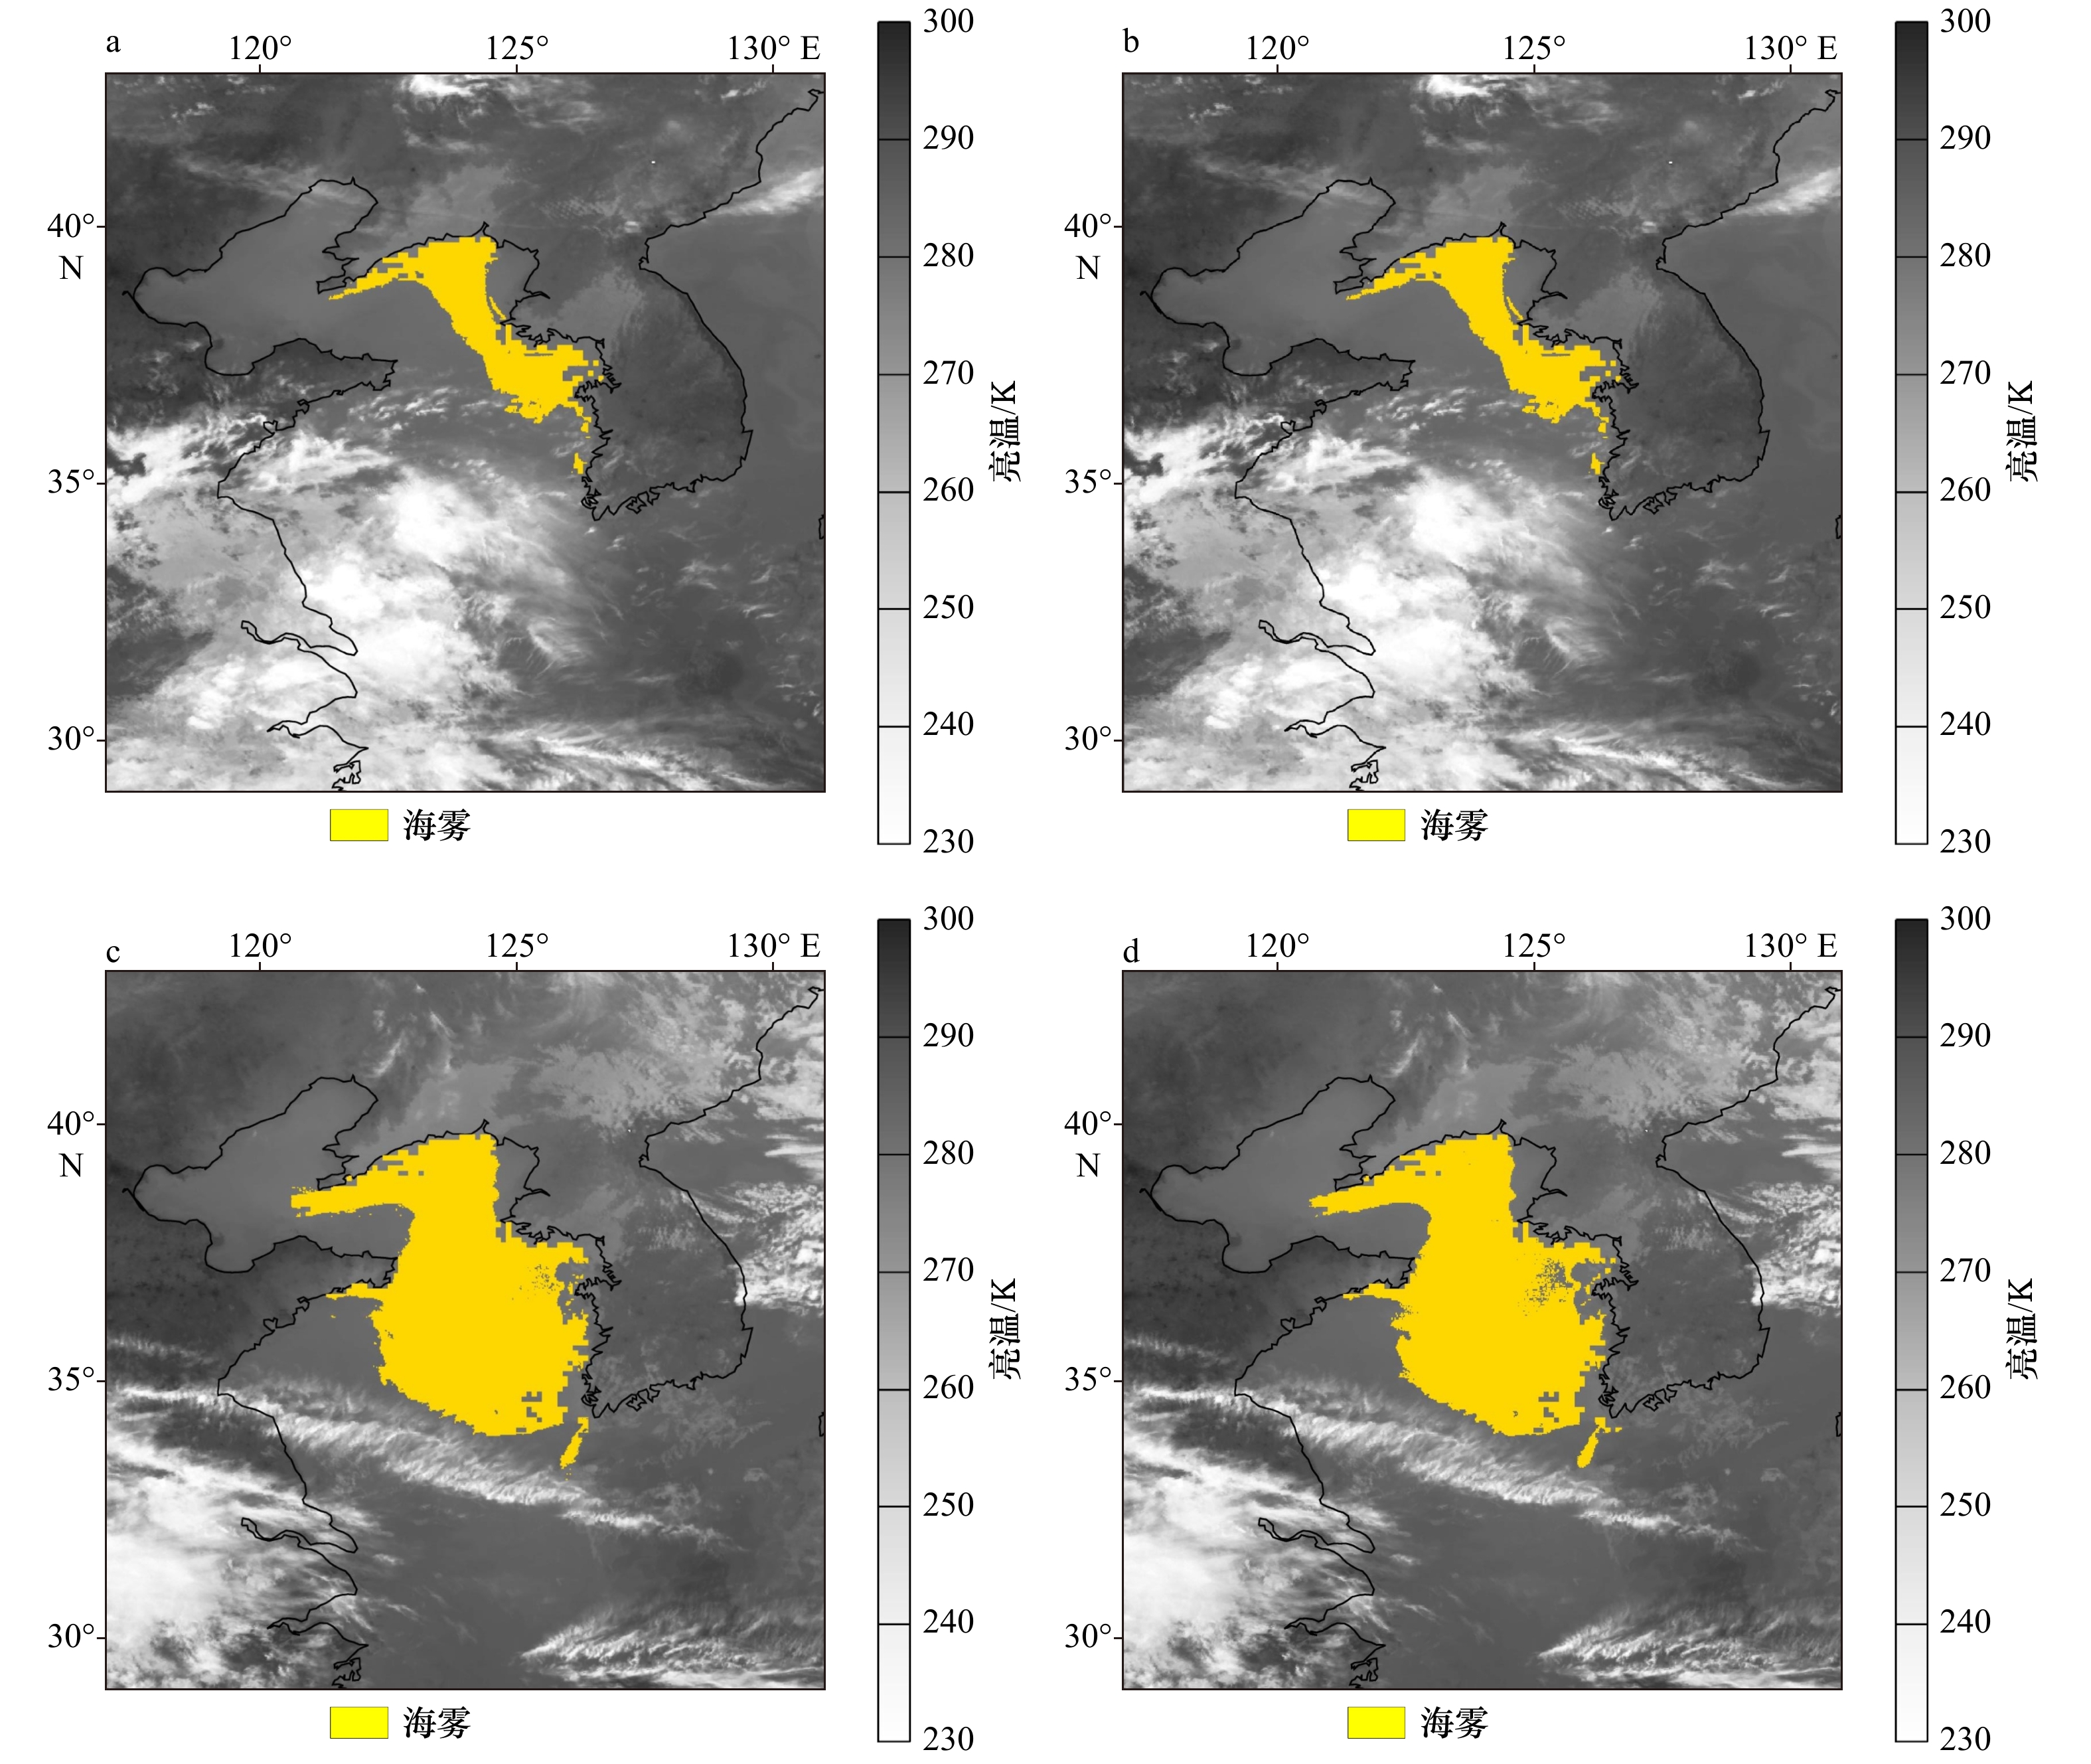
图 11 海雾监测结果
a. 2020年5月1月11:00(UTC)基于H-8卫星数据的海雾监测结果;b. 2020年5月1日11:00(UTC)基于GK-2A卫星数据的海雾监测结果;c. 2020年4月30日11:00(UTC)基于H-8卫星数据的海雾监测结果;d. 2020年4月30日11:00(UTC)基于GK-2A卫星数据的海雾监测结果
Fig. 11 Sea fog monitoring result
a. Sea fog monitoring result based on H-8 at 11:00 (UTC) on May 1, 2020 ; b. sea fog monitoring result based on GK-2A at 11:00 (UTC) on May 1, 2020 ; c. sea fog monitoring result based on H-8 at 11:00 (UTC) on April 30, 2020; d. sea fog monitoring result based on GK-2A at 11:00 (UTC) on April 30, 2020

图 12 2020年4月9日基于H-8卫星数据的海雾监测结果
Fig. 12 Sea fog monitoring result based on data of H-8 on April 29, 2020

图 13 2020年4月9日基于GK-2A数据的海雾监测结果
Fig. 13 Sea fog monitoring result based on data of GK-2A on April 29, 2020
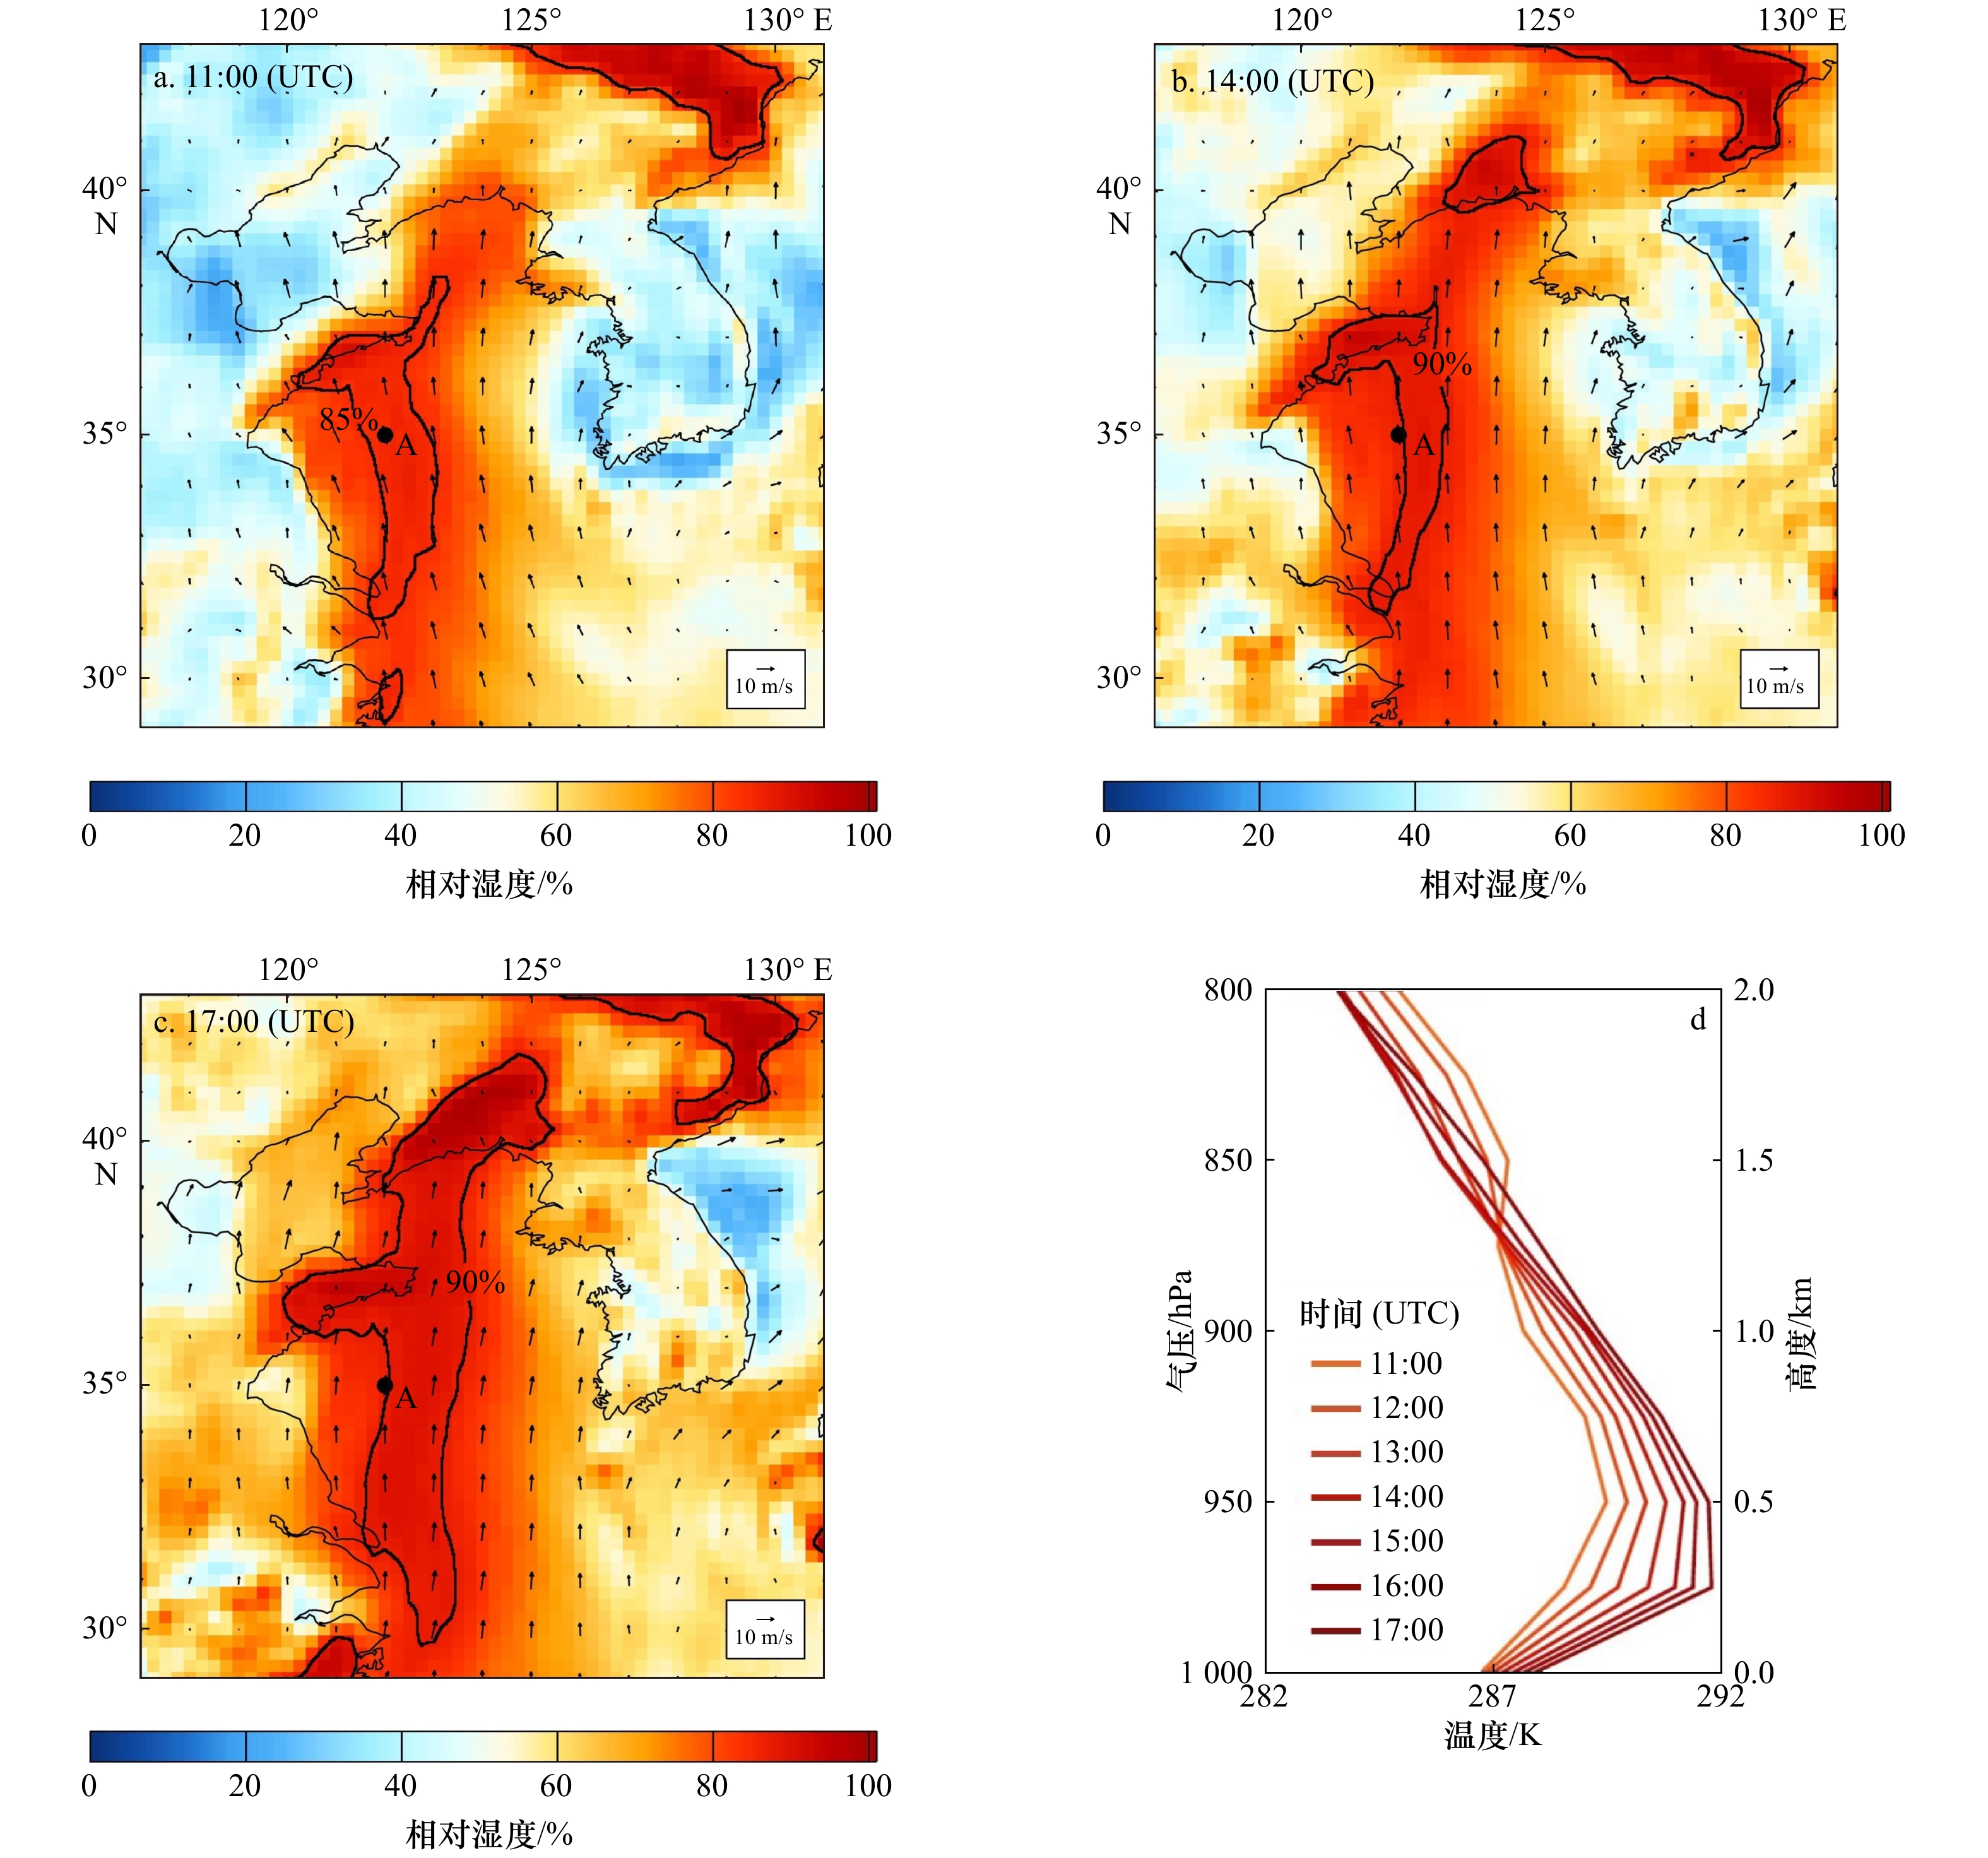
图 14 2020年4月29日黄、渤海域在1 000 hPa的风场、湿度场
a.11:00 (UTC) 的风场、湿度场;b. 14:00 (UTC) 的风场、湿度场;c. 17:00 (UTC) 的风场、湿度场;d. 点A(35ºN,122ºE)处11‒17时(UTC)的温度廓线分布
Fig. 14 Wind field and humidity field at 1 000 hPa of the Yellow Sea and Bohai Sea on April 29, 2020
a.Wind field and humidity field at 11:00 (UTC); b. wind field and humidity field at 14:00 (UTC); c. wind field and humidity field at 17:00 (UTC); d. temperature profile of sea fog occurrence and growth stage on April 29, 2020 at A (35ºN, 122ºE)
表 1 H-8及GK-2A波段特征
Tab. 1 Band characteristics of H-8 and GK-2A
通道 H-8 GK-2A 带宽/μm 中心波长/μm 星下点分辨率/km 带宽/μm 中心波长/μm 星下点分辨率/km 1 0.43~0.48 0.47 1 0.45~0.49 0.48 1 2 0.50~0.52 0.51 1 0.49~0.52 0.51 1 3 0.63~0.66 0.64 0.5 0.63~0.68 0.64 0.5 4 0.85~0.87 0.86 1 0.85~0.88 0.86 1 5 1.60~1.62 1.61 2 1.37~1.38 1.37 2 6 2.25~2.27 2.26 2 1.59~1.63 1.61 2 7 3.74~3.96 3.89 2 3.74~3.93 3.87 2 8 6.06~6.43 6.24 2 5.79~6.63 6.40 2 9 6.89~7.01 6.94 2 6.74~7.21 7.04 2 10 7.26~7.43 7.35 2 7.20-7.42 7.24 2 11 8.44~8.76 8.59 2 8.41~8.77 8.47 2 12 9.54~9.72 9.64 2 9.43~9.81 9.50 2 13 10.3~10.6 10.41 2 10.12~10.59 10.37 2 14 11.1~11.3 11.24 2 10.90~11.56 11.35 2 15 12.2~12.5 12.38 2 11.81~12.92 12.34 2 16 13.2~13.4 13.28 2 13.02~13.57 13.24 2  下载: 导出CSV
表 2 用于海雾红外辐射特性分析的卫星遥感影像数据
Tab. 2 Satellite remote sensing image data used for infrared radiation characteristics determination of sea fog
日期 H-8观测时间(UTC) 区域 1 2018年3月23日 18:00, 18:30, 19:00 黄海海域 2018年3月24日 11:00‒12:30 (间隔10 min) 黄海海域 2018年3月24日 13:00‒19:00 (间隔30 min) 黄海海域 2018年3月25日 11:00‒19:00 (间隔10 min) 黄海海域 2018年3月26日 11:00‒19:00 (间隔30 min) 黄海海域 2 2018年4月18日 17:00, 18:00, 19:00 黄海南部和东海北部海域 3 2018年5月8日 13:00‒19:00 (间隔30 min) 黄海中南部、山东南部沿海、辽宁东南部沿海 2018年5月9日 11:00‒19:00 (间隔30 min) 黄海中南部、山东南部沿海、辽宁东南部沿海 2018年5月10日 11:00‒15:00 (间隔30 min) 黄海中南部、山东南部沿海、辽宁东南部沿海 4 2018年6月19日 21:00 渤海、黄海中部和北部海域 5 2019年2月24日 18:00 黄海西部海域 6 2019年4月7日 11:00‒17:00 (间隔30 min) 黄海南部海域、浙江沿海及东海海域、福建及台湾海峡 2019年4月7日 17:20‒19:00 (间隔10 min) 黄海南部海域、浙江沿海及东海海域、福建及台湾海峡
下载: 导出CSV
表 3 用于算法验证和结果分析的卫星遥感影像数据
Tab. 3 Satellite remote sensing image data used for algorithm validation and result analysis
日期 H-8观测时间(UTC) GK-2A观测时间 (UTC) 区域 1 2020年2月18日 18:00, 18:30, 19:00, 19:30 18:00, 18:30, 19:00, 19:30 渤海中部、西北部及陆地 2 2020年4月29日 12:30‒17:00 (间隔30 min)* 12:30‒17:00 (间隔30 min)* 辽东半岛东部沿海、渤海北部、黄海大部海域 2020年4月30日 12:00‒17:00 (间隔60 min) 12:00‒17:00(间隔60 min) 辽东半岛东部沿海、渤海北部、黄海大部海域 2020年5月1日 12:00‒14:00 (间隔60 min) 12:00‒14:00 (间隔60 min) 辽东半岛东部沿海、渤海北部、黄海大部海域 3 2020年5月16日 11:00 11:00 黄海中部和南部海域 4 2020年5月23日 12:00 12:00 黄海北部和南部、东海北部 5 2020年5月26日 19:00 19:00 渤海东北部、黄海北部 6 2020年6月3日 12:00 12:00 黄海北部及东南部海域 注:*代表当此时段用于海雾发生发展的跟踪分析时,时间间隔10 min。
下载: 导出CSV
-
[1] 王彬华. 海雾[M]. 北京: 海洋出版社, 1983.Wang Binhua. Sea Fog[M]. Beijing: China Ocean Press, 1983. [2] 黄辉军, 黄健, 毛伟康, 等. 茂名地区海雾含水量的演变特征及其与大气水平能见度的关系[J]. 海洋学报, 2010, 32(2): 40−53.Huang Huijun, Huang Jian, Mao Weikang, et al. Characteristics of liquid water content of sea fog in Maoming area and its relationship with atmospheric horizontal visibility[J]. Haiyang Xuebao, 2010, 32(2): 40−53. [3] 周发琇, 王鑫, 鲍献文. 黄海春季海雾形成的气候特征[J]. 海洋学报, 2004, 26(3): 28−37.Zhou Faxiu, Wang Xin, Bao Xianwen. Climatic characteristics of sea fog formation of the Huanghai Sea in spring[J]. Haiyang Xuebao, 2004, 26(3): 28−37. [4] 肖艳芳, 张杰, 崔廷伟, 等. 海雾卫星遥感监测研究进展[J]. 海洋科学, 2017, 41(12): 146−154. doi: 10.11759/hykx20170523001Xiao Yanfang, Zhang Jie, Cui Tingwei, et al. Review of sea fog detection from satellite remote sensing data[J]. Marine Sciences, 2017, 41(12): 146−154. doi: 10.11759/hykx20170523001 [5] 张苏平, 鲍献文. 近十年中国海雾研究进展[J]. 中国海洋大学学报(自然科学版), 2008, 38(3): 359−366.Zhang Suping, Bao Xianwen. The main advances in sea fog research in China[J]. Periodical of Ocean University of China, 2008, 38(3): 359−366. [6] Eyre J R, Brownscombe J L, Allam R J. Detection of fog at night using advanced very high resolution radiometer (AVHRR) imagery[J]. Meteorological Magazine, 1984, 113(1346): 266−271. [7] Hunt G E. Radiative properties of terrestrial clouds at visible and infra-red thermal window wavelengths[J]. Quarterly Journal of the Royal Meteorological Society, 1973, 99(420): 346−369. [8] Dentremont R P. Low- and midlevel cloud analysis using nighttime multispectral imagery[J]. Journal of Applied Meteorology and Climatology, 1986, 25(12): 1853−1869. doi: 10.1175/1520-0450(1986)025<1853:LAMCAU>2.0.CO;2 [9] Turner J, Allam R J, Maine D R. A case-study of the detection of fog at night using channels 3 and 4 on the Advanced Very High-Resolution Radiometer (AVHRR)[J]. Meteorological Magazine, 1986, 115(1370): 285−290. [10] Bendix J. A satellite-based climatology of fog and low-level stratus in Germany and adjacent areas[J]. Atmospheric Research, 2002, 64(1): 3−18. [11] Zhang Suping, Yi Li. A comprehensive dynamic threshold algorithm for daytime sea fog retrieval over the Chinese adjacent seas[J]. Pure and Applied Geophysics, 2013, 170(11): 1931−1944. doi: 10.1007/s00024-013-0641-6 [12] 邓玉娇, 王捷纯, 曹静. 基于MODIS遥感资料监测南海白天雾[J]. 热带气象学报, 2013, 29(6): 1046−1050.Deng Yujiao, Wang Jiechun, Cao Jing. Detection of daytime fog in south China sea using MODIS data[J]. Journal of Tropical Meteorology, 2013, 29(6): 1046−1050. [13] Bendix J, Bachmann M. Operational detection of fog in the Alpine region by means of AVHRR imagery of NOAA satellites[C]//Proc. 5 m AVHRR Data Users’ Meeting. Tromsø: European Organisation for the Exploitation of Meteorological Satellites, 1991: 307−312. [14] Bendix J, Thies B, Cermak J, et al. Ground fog detection from space based on MODIS daytime data—A feasibility study[J]. Weather and Forecasting, 2005, 20(6): 989−1005. doi: 10.1175/WAF886.1 [15] Bendix J, Thies B, Nauss T, et al. A feasibility study of daytime fog and low stratus detection with TERRA/AQUA-MODIS over land[J]. Meteorological Applications, 2006, 13(2): 111−126. doi: 10.1017/S1350482706002180 [16] Ahmed R, Dey S, Mohan M. A study to improve night time fog detection in the Indo-Gangetic Basin using satellite data and to investigate the connection to aerosols[J]. Meteorological Applications, 2015, 22(4): 689−693. doi: 10.1002/met.1468 [17] Hu Shensen, Ma Shuo, Yan Wei, et al. A new multichannel threshold algorithm based on radiative transfer characteristics for detecting fog/low stratus using night-time NPP/VIIRS data[J]. International Journal of Remote Sensing, 2017, 38(21): 5919−5933. doi: 10.1080/01431161.2016.1265691 [18] 张春桂, 蔡义勇, 张加春. MODIS遥感数据在我国台湾海峡海雾监测中的应用[J]. 应用气象学报, 2009, 20(1): 8−16. doi: 10.3969/j.issn.1001-7313.2009.01.002Zhang Chungui, Cai Yiyong, Zhang Jiachun. The application of monitoring sea fog in Taiwan strait using MODIS remote sensing data[J]. Journal of Applied Meteorological Science, 2009, 20(1): 8−16. doi: 10.3969/j.issn.1001-7313.2009.01.002 [19] 张春桂, 何金德, 马治国. 福建沿海海雾的卫星遥感监测[J]. 中国农业气象, 2013, 34(3): 366−373. doi: 10.3969/j.issn.1000-6362.2013.03.018Zhang Chungui, He Jinde, Ma Zhiguo. Remote sensing monitor of sea fog in Fujian coastal region[J]. Chinese Journal of Agrometeorology, 2013, 34(3): 366−373. doi: 10.3969/j.issn.1000-6362.2013.03.018 [20] 马慧云, 李德仁, 刘良明, 等. 基于MODIS卫星数据的平流雾检测研究[J]. 武汉大学学报: 信息科学版, 2005, 30(2): 143−145.Ma Huiyun, Li Deren, Liu Liangming, et al. Fog detection based on EOS MODIS data[J]. Geomatics and Information Science of Wuhan University, 2005, 30(2): 143−145. [21] 马慧云, 李德仁, 刘良明, 等. 基于AVHRR、MODIS和MVRIS数据的辐射雾变化检测与分析[J]. 武汉大学学报: 信息科学版, 2007, 32(4): 297−300.Ma Huiyun, Li Deren, Liu Liangming, et al. Fog dynamic change detection based on AVHRR, MODIS and MVIRS data[J]. Geomatics and Information Science of Wuhan University, 2007, 32(4): 297−300. [22] 张伟康, 马慧云, 邹峥嵘, 等. 基于SBDART辐射传输模型的夜间辐射雾自动检测及时间序列分析[J]. 国土资源遥感, 2014, 26(2): 80−86.Zhang Weikang, Ma Huiyun, Zou Zhengrong, et al. Automatic detection of night time radiation fog based on SBDART radiative transfer model and the analysis of time series[J]. Remote Sensing for Land & Resources, 2014, 26(2): 80−86. [23] 何月, 张小伟, 蔡菊珍, 等. 基于MTSAT卫星遥感监测的浙江省及周边海区大雾分布特征[J]. 气象学报, 2015, 73(1): 200−210.He Yue, Zhang Xiaowei, Cai Juzhen, et al. Distribution characteristics of the fog derived from the MTSAT satellite data in Zhejiang Province and its adjacent sea area[J]. Acta Meteorologica Sinica, 2015, 73(1): 200−210. [24] 何月, 张小伟, 杜惠良, 等. 利用静止气象卫星监测浙江海上大雾[J]. 遥感技术与应用, 2015, 30(3): 599−606.He Yue, Zhang Xiaowei, Du Huiliang, et al. Monitoring sea fog of Zhejiang from geostationary meteorological satellite data[J]. Remote Sensing Technology and Application, 2015, 30(3): 599−606. [25] Li Yi, Thies B, Zhang Suping, et al. Optical thickness and effective radius retrievals of low stratus and fog from MTSAT daytime data as a prerequisite for Yellow Sea fog detection[J]. Remote Sensing, 2016, 8(1): 8. [26] Heo K Y, Park S, Ha K J, et al. Algorithm for sea fog monitoring with the use of information technologies[J]. Meteorological Applications, 2014, 21(2): 350−359. doi: 10.1002/met.1344 [27] 田永杰, 邓玉娇, 陈武喝, 等. 基于FY-2E数据白天海雾检测算法的改进[J]. 干旱气象, 2016, 34(4): 738−742, 751.Tian Yongjie, Deng Yujiao, Chen Wuhe, et al. Algorithm improvement of sea fog detection in the daytime based on FY-2E data[J]. Journal of Arid Meteorology, 2016, 34(4): 738−742, 751. [28] Yuan Yibo, Qiu Zhongfeng, Sun Deyong, et al. Daytime sea fog retrieval based on GOCI data: a case study over the Yellow Sea[J]. Optics Express, 2016, 24(2): 787−801. doi: 10.1364/OE.24.000787 [29] 王峥, 滕骏华, 蔡文博, 等. 基于GOCI影像的黄海海雾提取方法研究[J]. 海洋环境科学, 2018, 37(6): 941−946. doi: 10.12111/j.cnki.mes20180621Wang Zheng, Teng Junhua, Cai Wenbo, et al. Yellow Sea fog extraction method based on GOCI image[J]. Marine Environmental Science, 2018, 37(6): 941−946. doi: 10.12111/j.cnki.mes20180621 [30] Gao Shanhong, Wu Wei, Zhu Leilei, et al. Detection of nighttime sea fog/stratus over the Huanghai Sea using MTSAT-1R IR data[J]. Acta Oceanologica Sinica, 2009, 28(2): 23−35. [31] 张培, 吴东. 基于Himawari-8数据的日间海雾检测方法[J]. 大气与环境光学学报, 2019, 14(3): 211−220.Zhang Pei, Wu Dong. Daytime sea fog detection method using Himawari-8 data[J]. Journal of Atmospheric and Environmental Optics, 2019, 14(3): 211−220. [32] 苏纪兰. 中国近海的环流动力机制研究[J]. 海洋学报, 2001, 23(4): 1−16.Su Jilan. A review of circulation dynamics of the coastal oceans near China[J]. Haiyang Xuebao, 2001, 23(4): 1−16. [33] 吴晓京, 李三妹, 廖蜜, 等. 基于20年卫星遥感资料的黄海、渤海海雾分布季节特征分析[J]. 海洋学报, 2015, 37(1): 63−72.Wu Xiaojing, Li Sanmei, Liao Mi, et al. Analyses of seasonal feature of sea fog over the Yellow Sea and Bohai Sea based on the recent 20 years of satellite remote sensing data[J]. Haiyang Xuebao, 2015, 37(1): 63−72. [34] 金巍, 曲岩, 卞韬, 等. 渤海北部沿海近岸雾的特征分析[J]. 气象与环境学报, 2012, 28(2): 40−43. doi: 10.3969/j.issn.1673-503X.2012.02.008Jin Wei, Qu Yan, Bian Tao, et al. Characteristics of sea fog along the north coast of the Bohai Sea in China[J]. Journal of Meteorology and Environment, 2012, 28(2): 40−43. doi: 10.3969/j.issn.1673-503X.2012.02.008 -


计量
- 文章访问数: 861
- HTML全文浏览量: 606
- PDF下载量: 105
- 被引次数: 0
