

Retrieval of sea surface salinity in the Gulf of Mexico based on random forest method
-
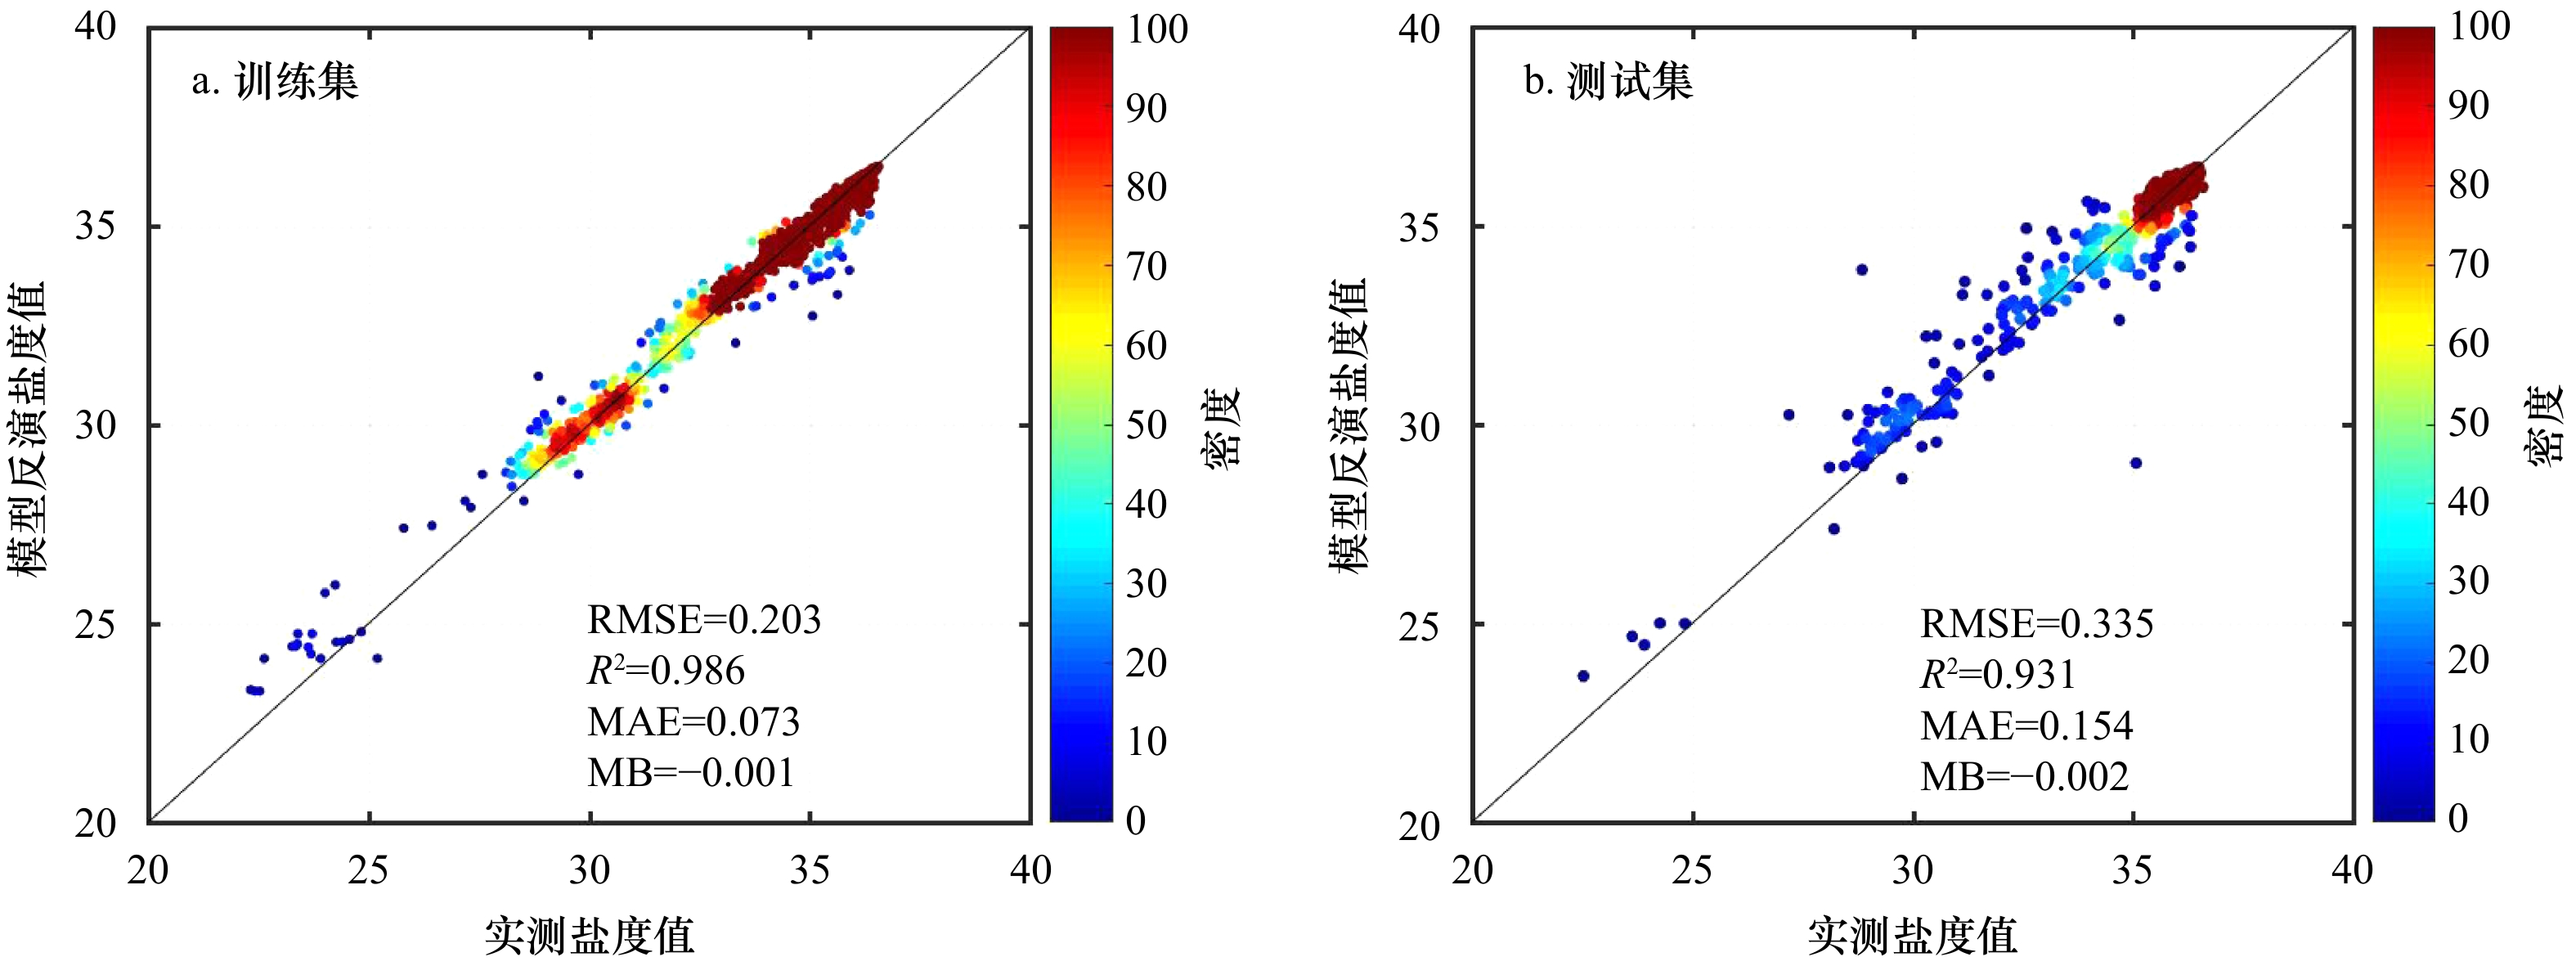
摘要: 盐度是表征物理和生物地球化学过程的重要参数之一,光学遥感可满足较高分辨率的监测需要并避免射频干扰问题,为沿海水域的海表盐度研究提供可行的途径。本文基于MODIS-Aqua的412 nm、443 nm、488 nm、555 nm和667 nm波段的遥感反射率(Rrs412、Rrs443、Rrs488、Rrs555、Rrs667)、海表温度以及实测的海表盐度数据构建随机森林模型,基于模型结果分析墨西哥湾海表盐度时空异质性及海表盐度与影响因子(海表温度和遥感反射率)之间的相关关系。研究结果表明:(1)随机森林模型能较准确地反演墨西哥湾海表盐度,其均方根误差为0.335,决定系数为0.931;(2)湾区海表盐度空间分布呈近岸−河口低、离岸高,环状向内增值的态势,其变化受河流流量、风力以及环流的影响;(3)海表温度与海表盐度存在较强的相关性,海表温度对海表盐度的反演影响显著;(4)海表温度、遥感反射率与海表盐度的相关性呈现空间异质性。Abstract: Salinity is an important parameter to characterize physical and biogeo-chemical processes. Optical satellite images with high resolution can avoid radio frequency interference, and provide a feasible way to monitor sea surface salinity (SSS) in coastal regions. Using an extensive dataset of ship-based SSS and MODIS estimated remote sensing reflectance (Rrs) at 412 nm, 443 nm, 488 nm, 555 nm and 667 nm and sea surface temperature (SST) a random forest (RF) model has been utilized to retrieve the SSS. Based on the predicted SSS, we analyze the spatiotemporal heterogeneity of SSS in the Gulf of Mexico and contribution of each factor with correlations coefficient. The results show that: (1) the RF model can accurately estimate the SSS in the Gulf of Mexico (RMSE=0.335, R2=0.931); (2) the spatial distribution pattern of SSS shows a ring-shaped inward value increase, which is affected by river discharge, wind forcing and circulation; (3) there is a strong correlation between SSS and SST, and SST significantly impact in retrieving SSS; (4) the correlation between SST, Rrs and SSS appears spatial heterogeneity.
-
Key words:
- sea surface salinity /
- random forest /
- spatial-temporal heterogeneity /
- Gulf of Mexico
-
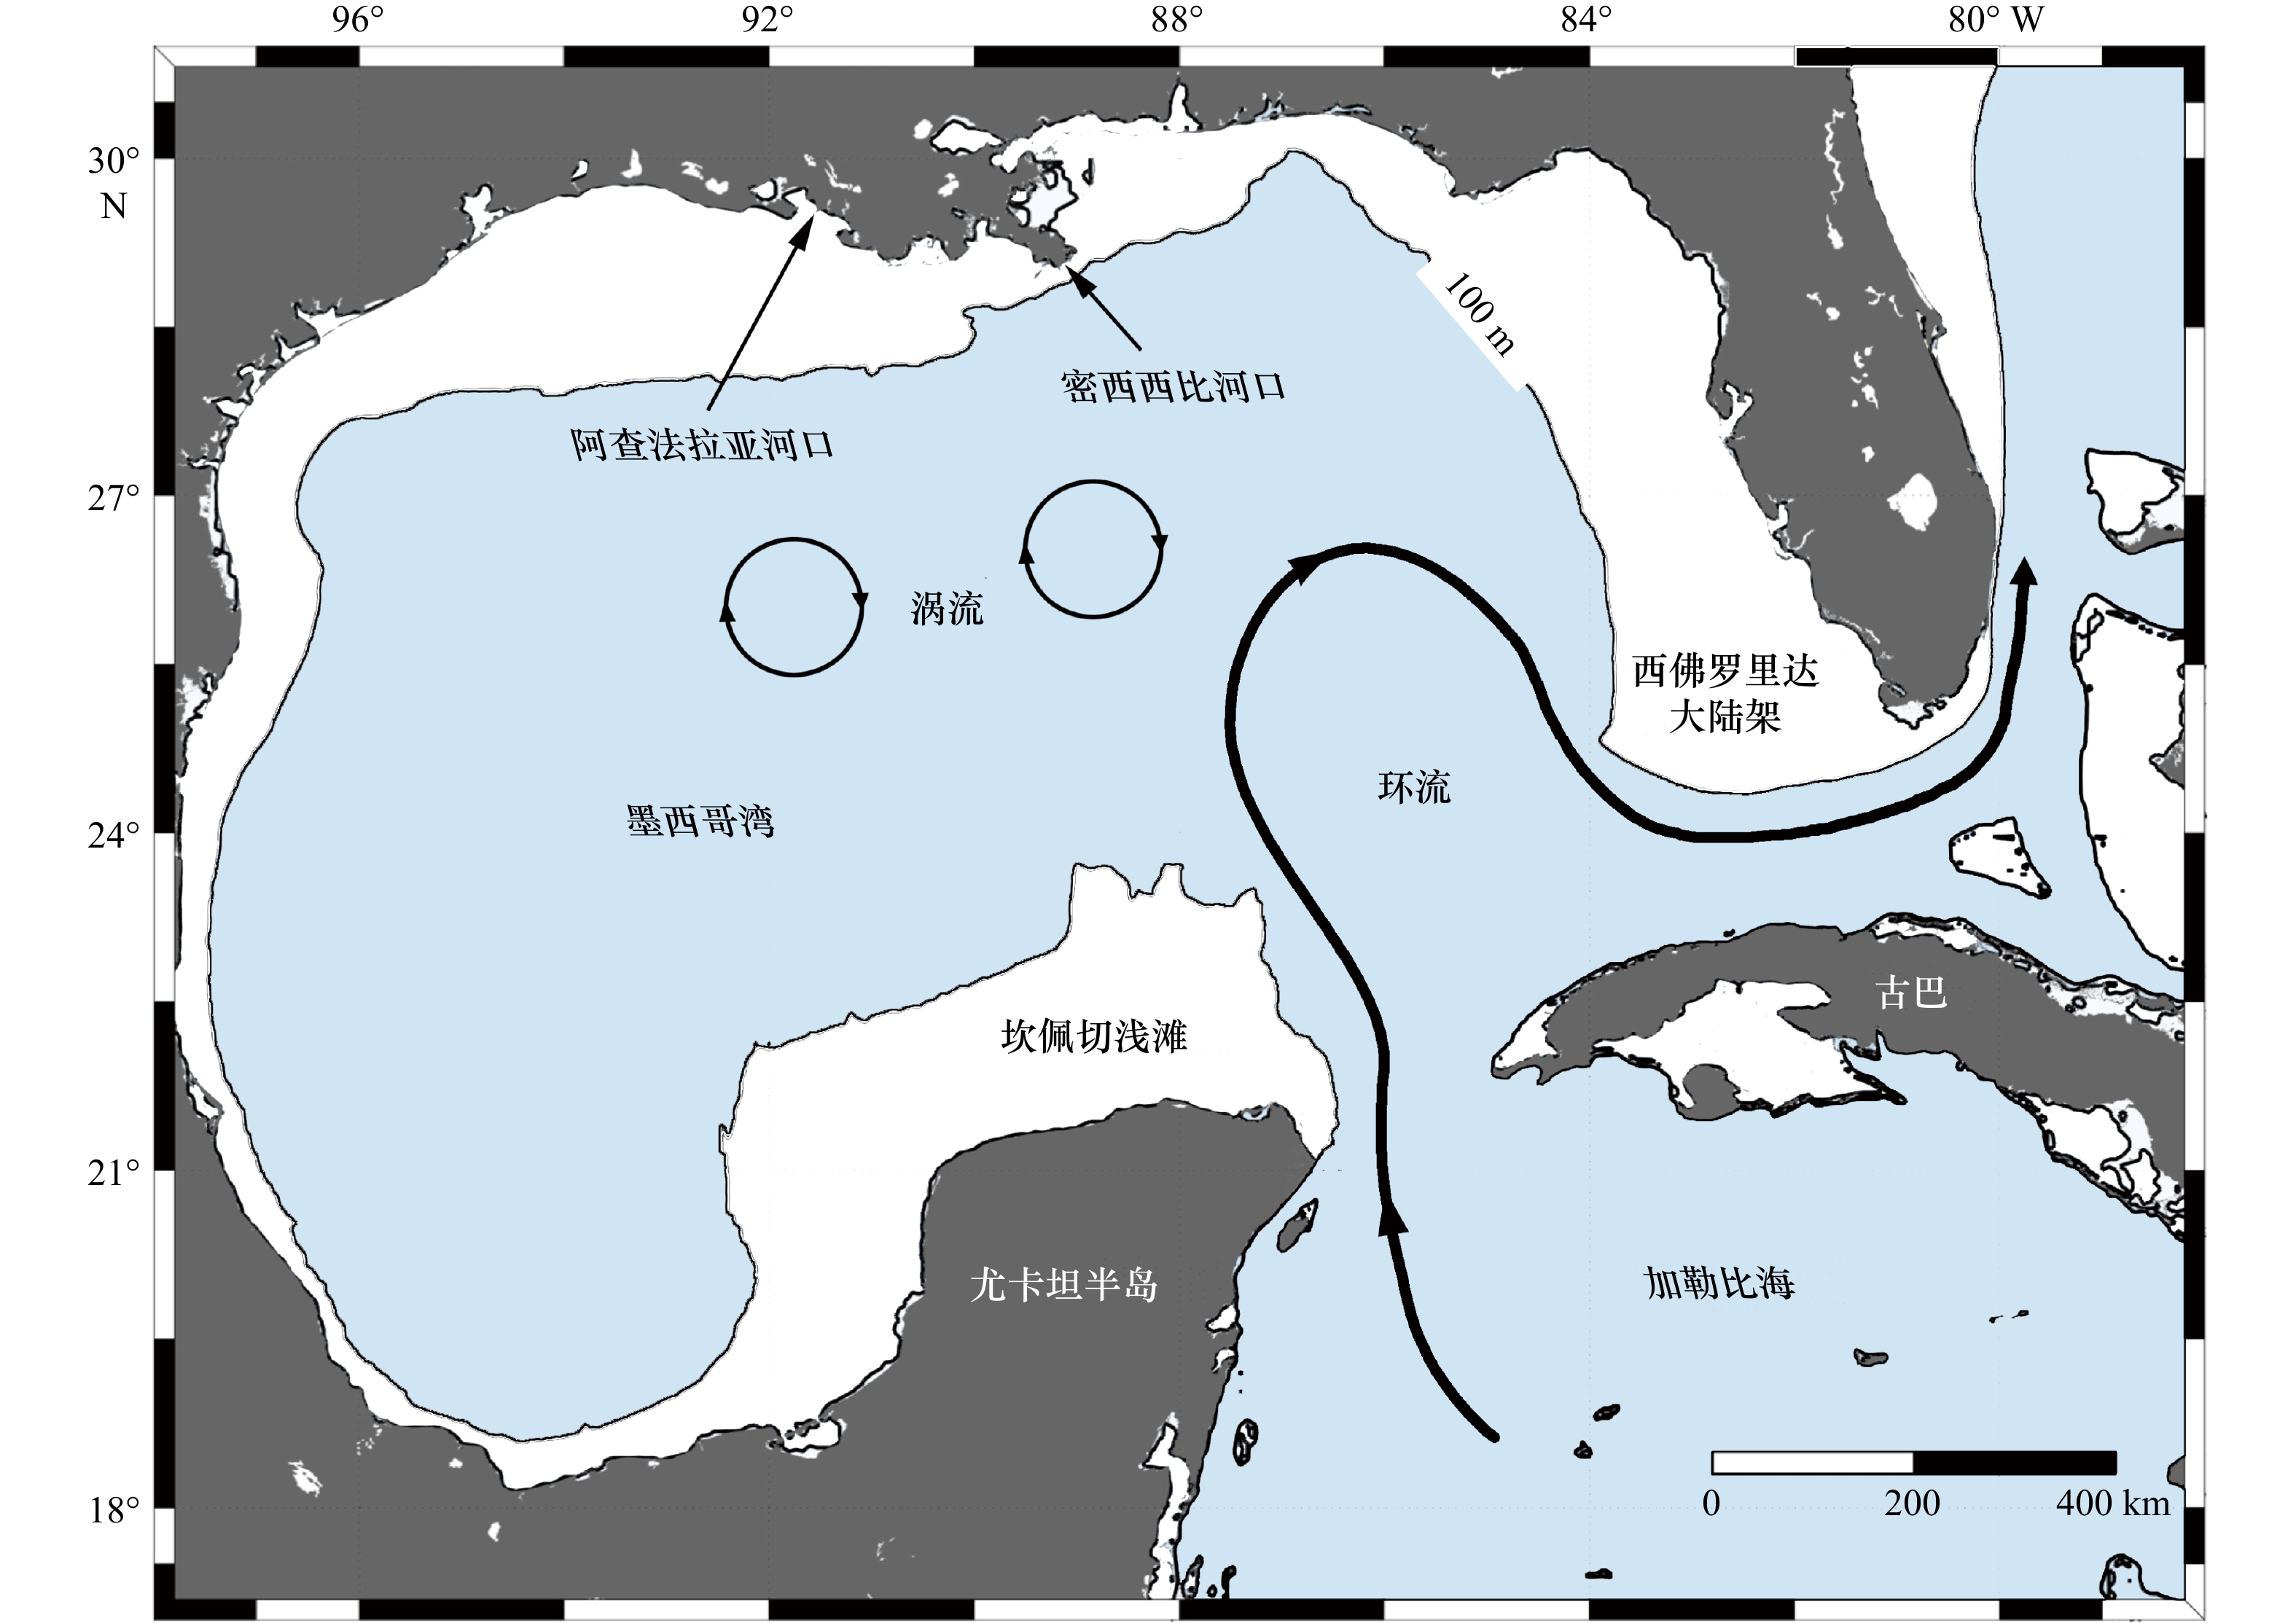
图 1 研究区概况
黑色曲线代表100 m等深线;水深大于100 m区域用浅蓝色表示;黑色带箭头曲线代表环流;圆环代表环流扩张时引起的涡流
Fig. 1 Overview of the study area
The black curve is for the 100 m isobath; areas with water depths greater than 100 m are shaded in light blue; the curve with black arrow is for circulation; the ring is for the eddy current caused by circulation expansion
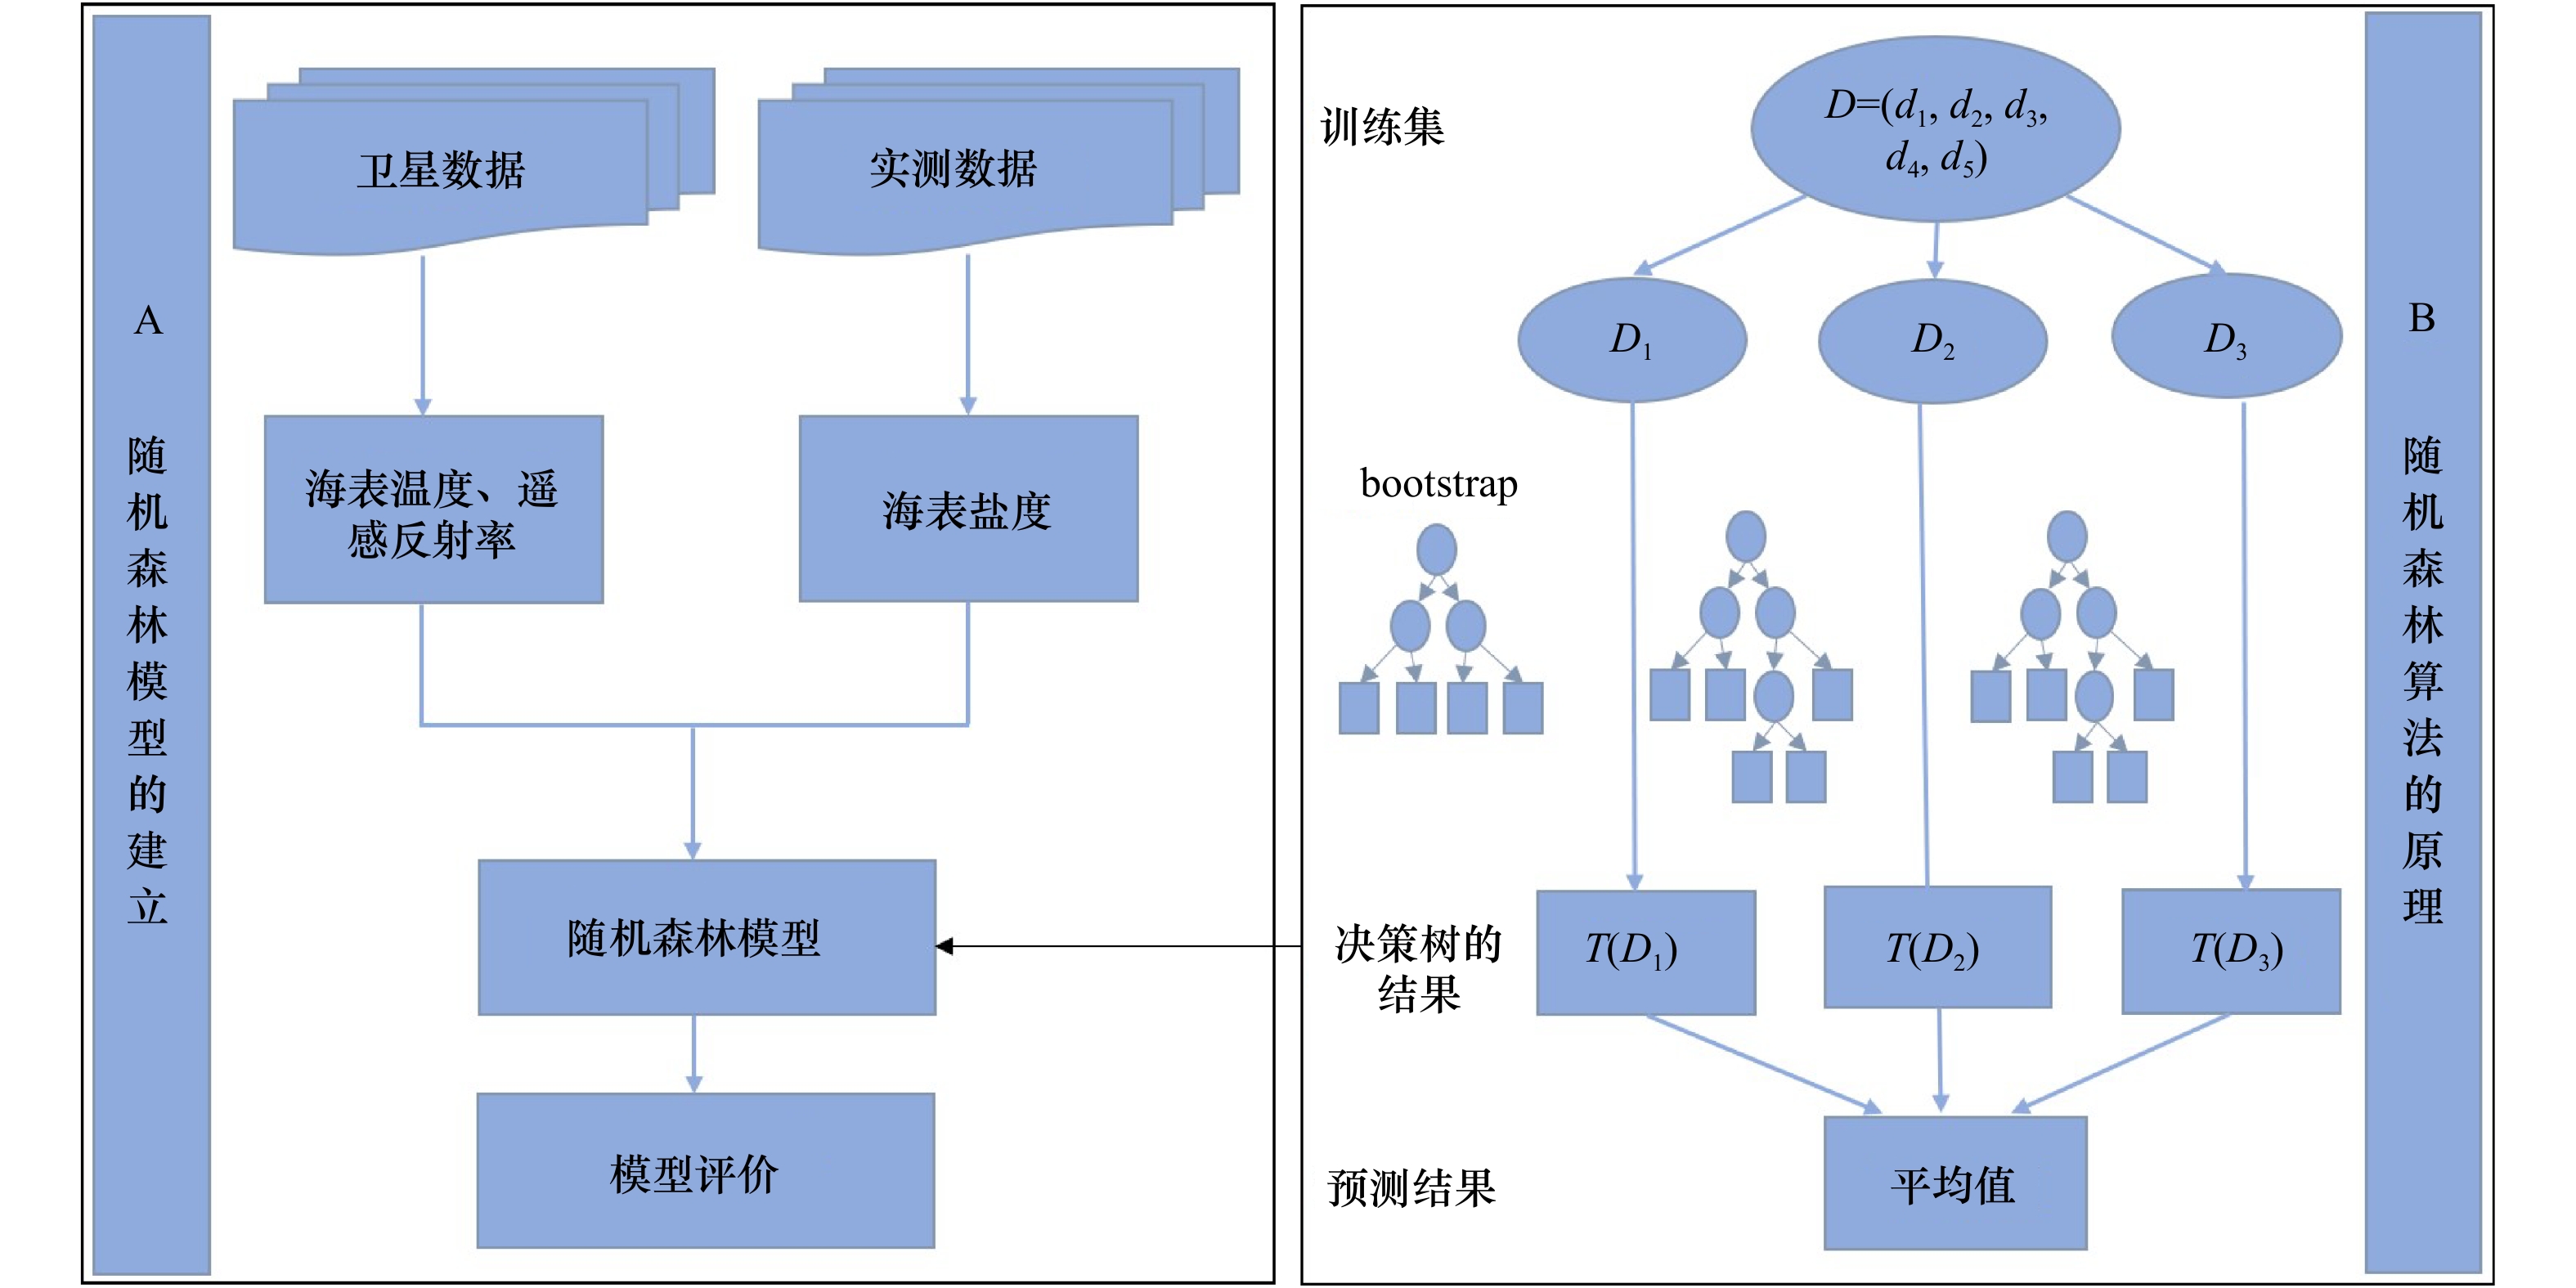
图 3 基于随机森林算法的海表盐度反演模型构建流程图
Fig. 3 Flow chart of sea surface salinity retrieval model based on random forest algorithm
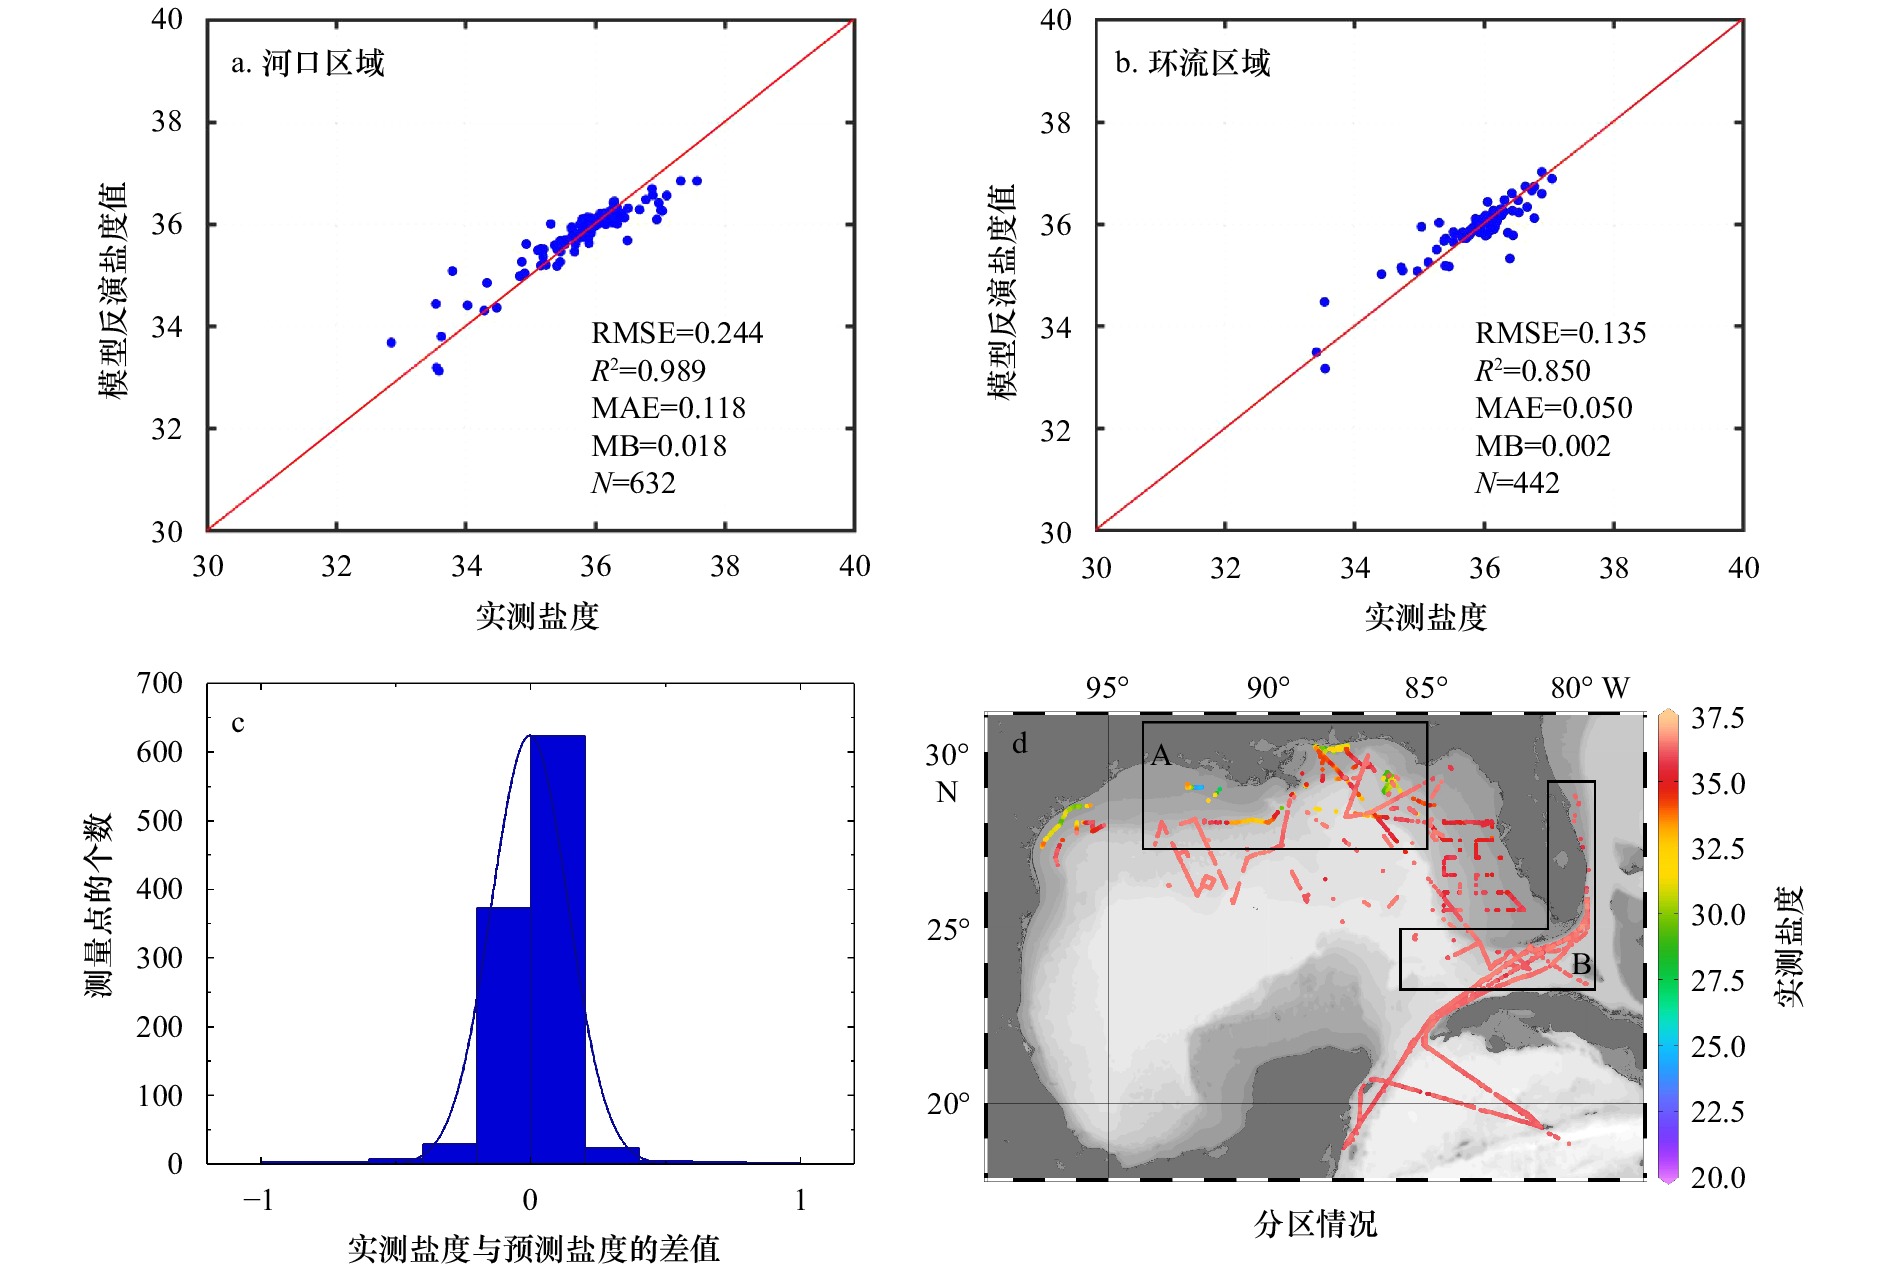
图 5 随机森林模型在河口区域与环流区域的性能对比
Fig. 5 Random forest model performance comparison in estuary region and circulation region
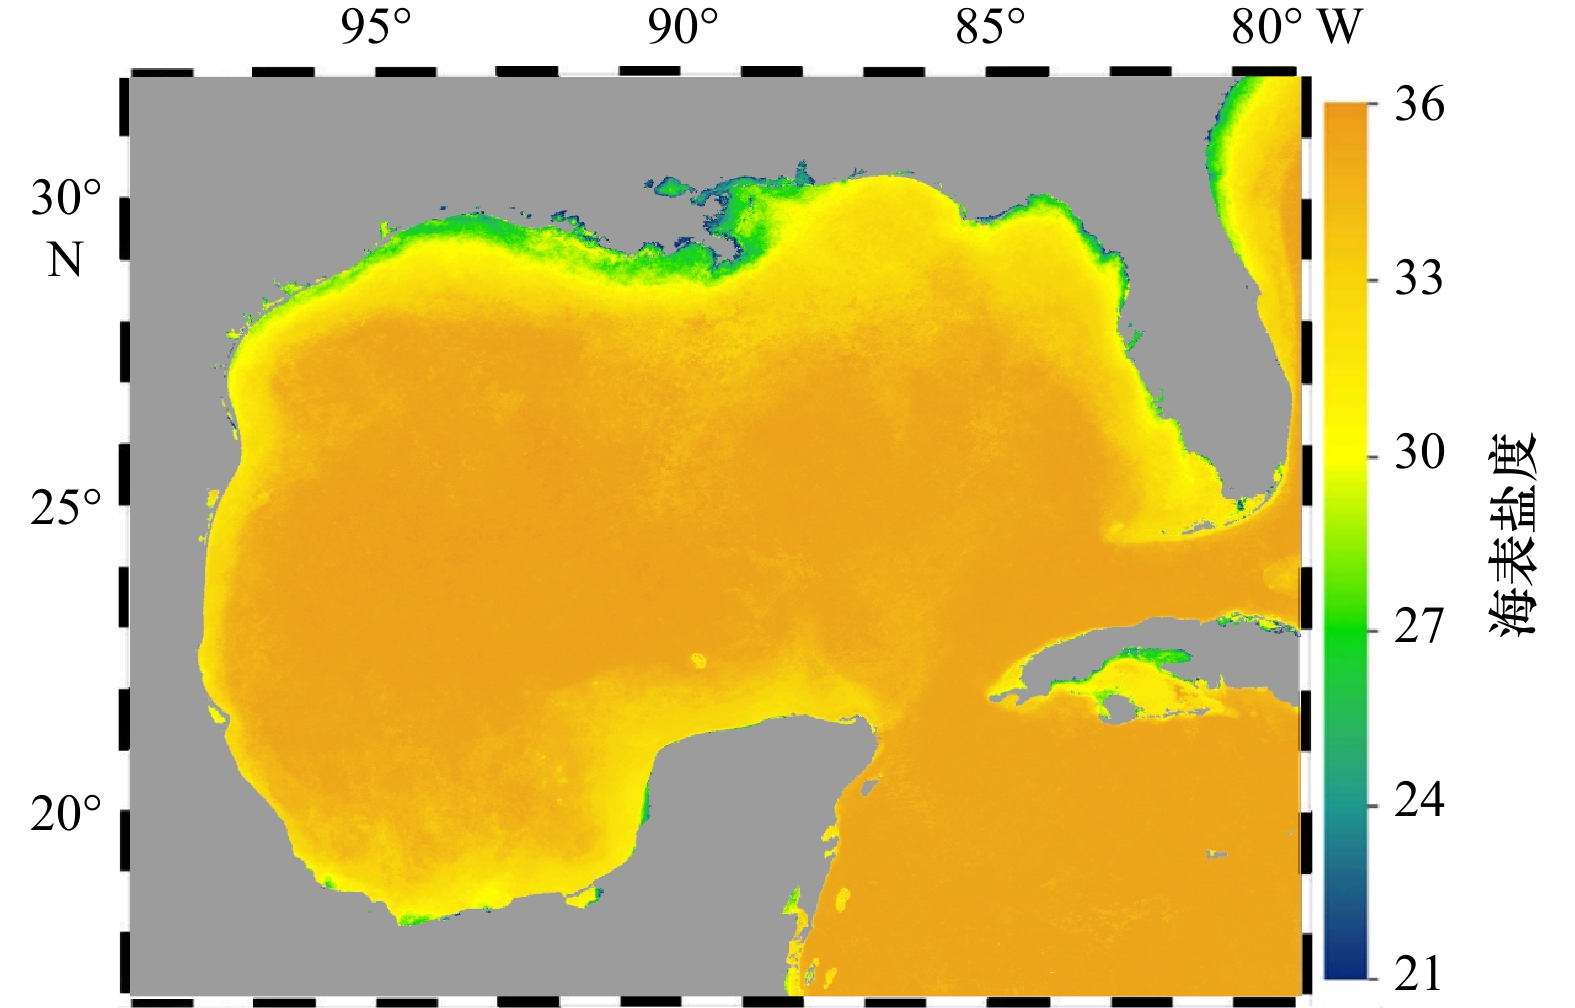
图 7 随机森林模型生成的2018年墨西哥湾年平均海表盐度反演图
灰色代表陆地
Fig. 7 Annual mean sea surface salinity generated by the random forest model in the Gulf of Mexio in 2018
Land are shaded in grey
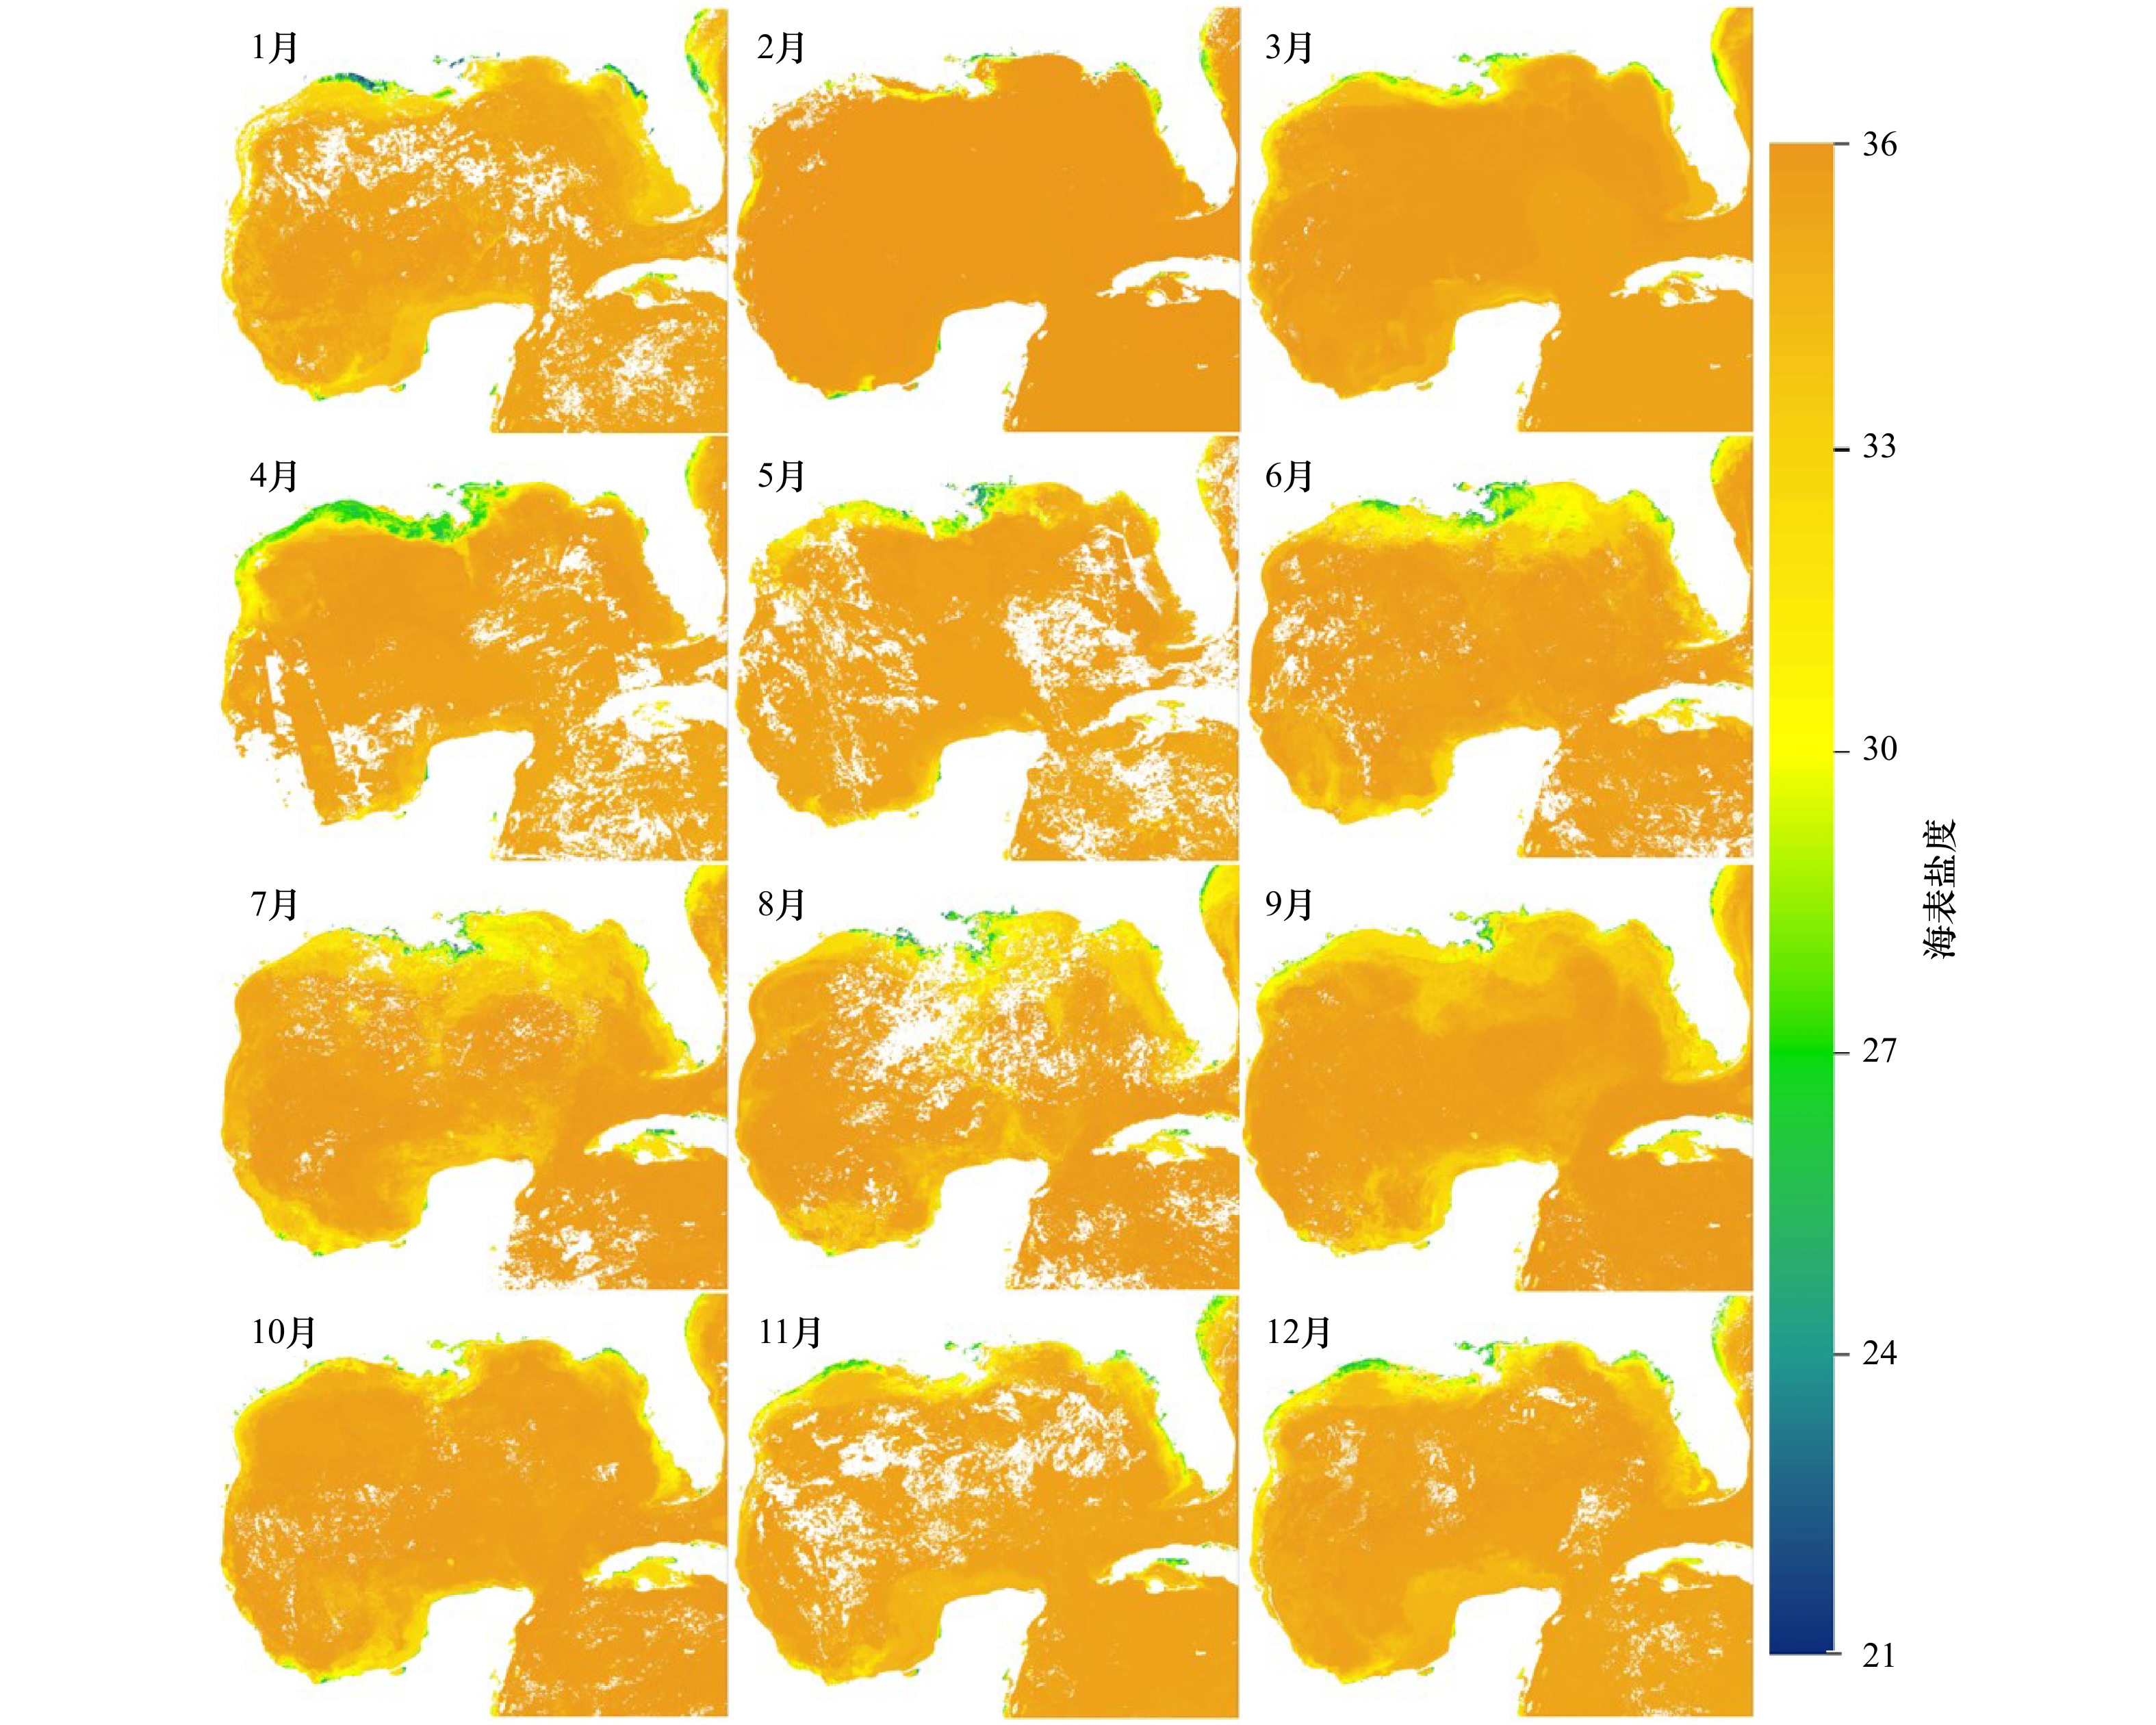
图 8 随机森林模型生成的2018年墨西哥湾月平均海表盐度反演图
Fig. 8 Monthly mean sea surface salinity generated by the random forest model in the Gulf of Mexio in 2018
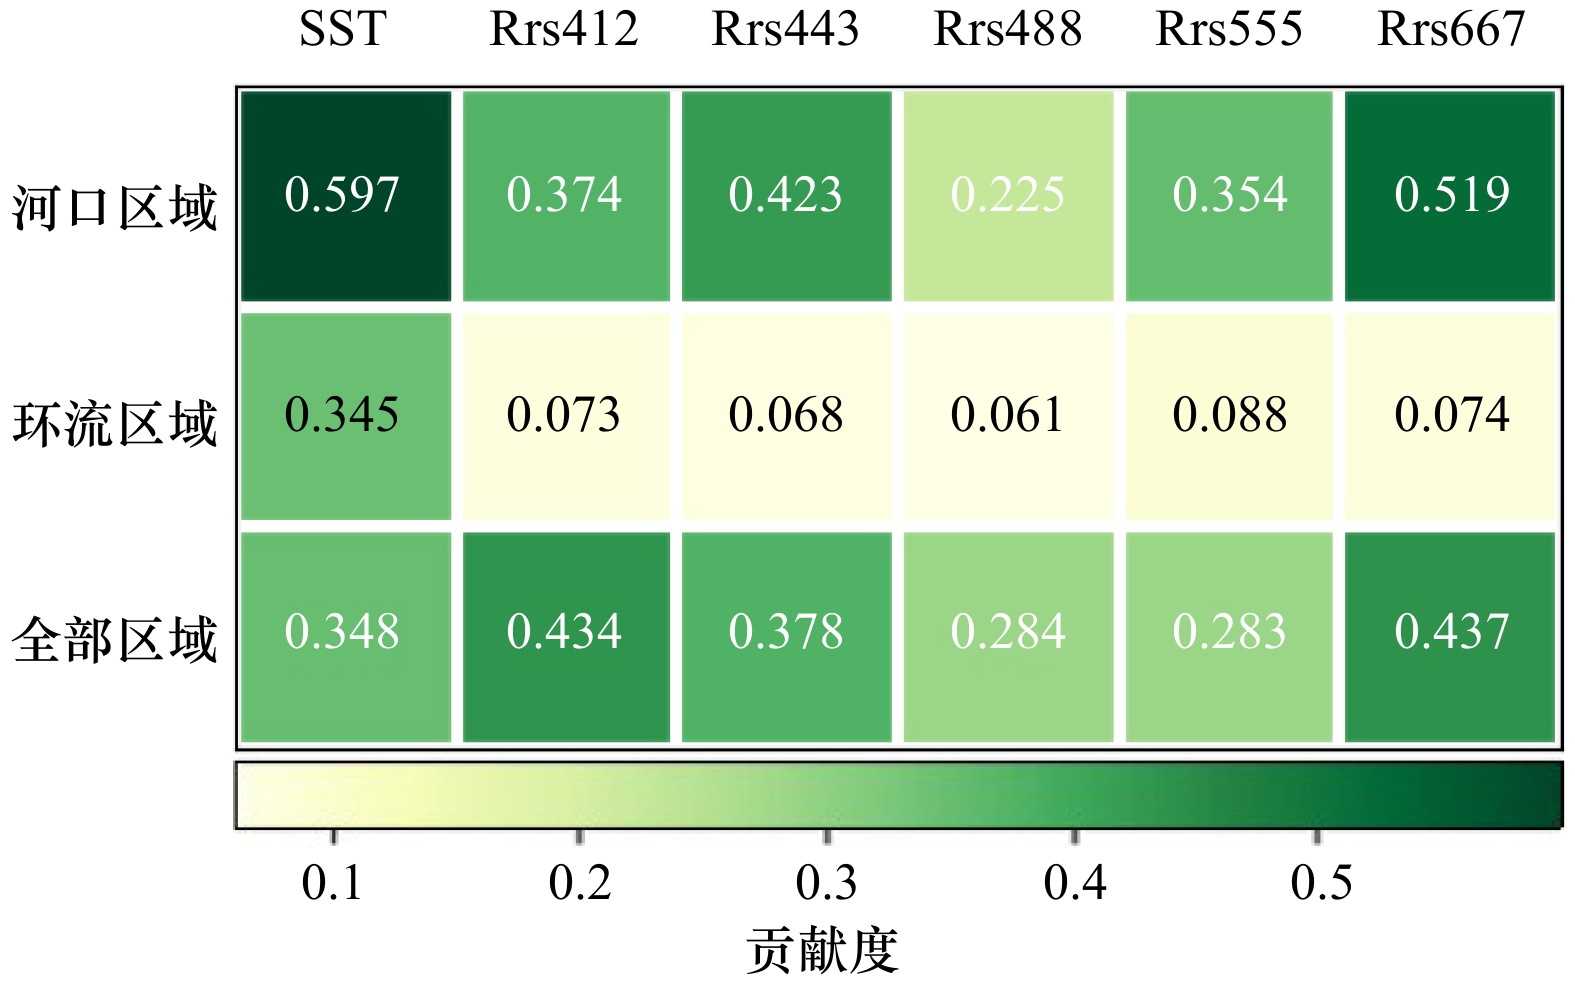
图 10 不同地理分区海表盐度影响因子的贡献度
Fig. 10 Contribution of each factor to sea surface salinity in different geographical regions
表 1 实测海表盐度数据来源航次信息
Tab. 1 The source and voyage information of field sea surface salinity
航次名称 船名 时间范围 观测点个数 EQ17 M/V Celebrity Equinox 2018年1月1−6日 2 179 AS17 M/V Allure of the Seas 2018年1月4−7日 1 198 GU1801_Leg1 R/V Gordon Gunter 2018年1月14−22日 4 178 GU1801_Leg2 R/V Gordon Gunter 2018年1月26日至2月9日 7 421 GU1801_Leg3 R/V Gordon Gunter 2018年2月12−27日 5 428 GU1801_Leg4 R/V Gordon Gunter 2018年3月1−16日 7 941 GU1802 R/V Gordon Gunter 2018年6月24日至7月9日 7 609 GU1803−transit R/V Gordon Gunter 2018年7月11−14日 1 340 GU1803_Leg1 R/V Gordon Gunter 2018年7月20日至8月3日 7 196 GU1803_Leg2 R/V Gordon Gunter 2018年8月6−19日 4 727 GU1804 R/V Gordon Gunter 2018年8月23−31日 4 445 GU1805_Leg1 R/V Gordon Gunter 2018年9月2−9日 3 563 GU1805_Leg2 R/V Gordon Gunter 2018年9月11−30日 9 656 EQ18 M/V Celebrity Equinox 2018年6月1日至12月22日 872 GU1806 R/V Gordon Gunter 2018年11月10日至1月4日 10 127 观测点总数 77 883 用于模型的开发与验证的点数 7 963  下载: 导出CSV
表 2 实测数据与卫星数据统计信息
Tab. 2 Statistics of measured data and satellite data
变量 实测盐度 海表温度/℃ Rrs412/sr−1 Rrs443/sr−1 Rrs488/sr−1 Rrs555/sr−1 Rrs667/sr−1 最大值 36.587 32.525 0.030 18 0.036 44 0.045 42 0.031 41 0.010 12 最小值 22.328 18.270 −0.001 74 −0.000 42 0.000 85 −0.000 11 −0.000 65 中位数 36.147 26.475 0.008 00 0.007 00 0.005 41 0.001 46 0.000 15 平均值 35.554 26.514 0.007 51 0.006 71 0.005 35 0.001 68 0.000 21
下载: 导出CSV
-
[1] Devlin M J, Petus C, Da Silva, et al. Water quality and river plume monitoring in the Great Barrier Reef: an overview of methods based on ocean colour satellite data[J]. Remote Sensing, 2015, 7(10): 12909−12941. doi: 10.3390/rs71012909 [2] Horner-Devine A R, Hetland R D, MacDonald D G. Mixing and transport in coastal river plumes[J]. Annual Review of Fluid Mechanics, 2015, 47: 569−594. doi: 10.1146/annurev-fluid-010313-141408 [3] 白雨, 赵亮, 刘境舟. 生态因子在黄海绿潮生消过程中的作用[J]. 海洋学报, 2019, 41(8): 97−105.Bai Yu, Zhao Liang, Liu Jingzhou. The role of ecological factors in the progress of the green tide in the Yellow Sea[J]. Haiyang Xuebao, 2019, 41(8): 97−105. [4] 韦钦胜, 王保栋, 陈建芳, 等. 长江口外缺氧区生消过程和机制的再认知[J]. 中国科学: 地球科学, 2015, 58(4): 628−648. doi: 10.1007/s11430-014-5007-0Wei Qinsheng, Wang Baodong, Chen Jianfang, et al. Recognition on the forming-vanishing process and underlying mechanisms of the hypoxia off the Yangtze River estuary[J]. Science China: Earth Sciences, 2015, 58(4): 628−648. doi: 10.1007/s11430-014-5007-0 [5] Cannizzaro J P, Carlson Jr P R, Yarbro L A, et al. Optical variability along a river plume gradient: implications for management and remote sensing[J]. Estuarine, Coastal and Shelf Science, 2013, 131: 149−161. doi: 10.1016/j.ecss.2013.07.012 [6] 周博天. 海面盐度多源遥感协同反演方法研究[D]. 北京: 中国地质大学(北京), 2013.Zhou Botian. The study of sea surface salinity model based on multi-source remote sensing coordinated retrieval[D]. Beijing: China University of Geosciences (Beijing), 2013. [7] Vandermeulen R A, Arnone R, Ladner S, et al. Estimating sea surface salinity in coastal waters of the Gulf of Mexico using visible channels on SNPP-VIIRS[C]//Proceedings of SPIE 9111, Ocean Sensing and Monitoring VI. Baltimore, Maryland, United States: SPIE, 2014: 911109. [8] Liu Rongjie, Zhang Jie, Yao Haiyan, et al. Hourly changes in sea surface salinity in coastal waters recorded by Geostationary Ocean Color Imager[J]. Estuarine, Coastal and Shelf Science, 2017, 196: 227−236. doi: 10.1016/j.ecss.2017.07.004 [9] Geiger E F, Grossi M D, Trembanis A C, et al. Satellite-derived coastal ocean and estuarine salinity in the Mid-Atlantic[J]. Continental Shelf Research, 2013, 63(S1): S235−S242. [10] Kim D W, Park Y J, Jeong J Y, et al. Estimation of hourly sea surface salinity in the East China sea using geostationary ocean color imager measurements[J]. Remote Sensing, 2020, 12(5): 755. doi: 10.3390/rs12050755 [11] Ahn Y H, Shanmugam P, Moon J E, et al. Satellite remote sensing of a low-salinity water plume in the East China Sea[J]. Annales Geophysicae, 2008, 26(7): 2019−2035. doi: 10.5194/angeo-26-2019-2008 [12] Qing Song, Zhang Jie, Cui Tingwei, et al. Retrieval of sea surface salinity with MERIS and MODIS data in the Bohai Sea[J]. Remote Sensing of Environment, 2013, 136: 117−125. doi: 10.1016/j.rse.2013.04.016 [13] 张文. 基于智能计算的水体悬浮物遥感反演研究——以长江中游为例[D]. 北京: 中国科学院研究生院, 2012.Zhang Wen. Remote sensing retrieval of suspended matters based on intelligent calculation—a case study of middle Yangtze River[D]. Beijing: University of Chinese Academy of Sciences, 2012. [14] Chen Shuangling, Hu Chuanmin. Estimating sea surface salinity in the northern Gulf of Mexico from satellite ocean color measurements[J]. Remote Sensing of Environment, 2017, 201: 115−132. doi: 10.1016/j.rse.2017.09.004 [15] 王奕森, 夏树涛. 集成学习之随机森林算法综述[J]. 信息通信技术, 2018, 12(1): 49−55. doi: 10.3969/j.issn.1674-1285.2018.01.009Wang Yisen, Xia Shutao. A survey of random forests algorithms[J]. Information and Communications Technologies, 2018, 12(1): 49−55. doi: 10.3969/j.issn.1674-1285.2018.01.009 [16] Rabalais N N, Turner R E, Wiseman Jr W J. Gulf of Mexico Hypoxia, A. K. A. “The dead zone”[J]. Annual Review of Ecology and Systematics, 2002, 33(1): 235−263. doi: 10.1146/annurev.ecolsys.33.010802.150513 [17] Otis D B, Le Hénaff M, Kourafalou V H, et al. Mississippi River and Campeche bank (Gulf of Mexico) episodes of cross-shelf export of coastal waters observed with satellites[J]. Remote Sensing, 2019, 11(6): 723. doi: 10.3390/rs11060723 [18] Fu Zhiyi, Hu Linshu, Chen Zhende, et al. Estimating spatial and temporal variation in ocean surface pCO2 in the Gulf of Mexico using remote sensing and machine learning techniques[J]. Science of the Total Environment, 2020, 745: 140965. doi: 10.1016/j.scitotenv.2020.140965 [19] Breiman L. Random forests[J]. Machine Learning, 2001, 45(1): 5−32. doi: 10.1023/A:1010933404324 [20] Ho T K. The random subspace method for constructing decision forests[J]. IEEE Transactions on Pattern Analysis and Machine Intelligence, 1998, 20(8): 832−844. doi: 10.1109/34.709601 [21] Breiman L. Bagging predictors[J]. Machine Learning, 1996, 24(2): 123−140. [22] 方馨蕊, 温兆飞, 陈吉龙, 等. 随机森林回归模型的悬浮泥沙浓度遥感估算[J]. 遥感学报, 2019, 23(4): 756−772.Fang Xinrui, Wen Zhaofei, Chen Jilong, et al. Remote sensing estimation of suspended sediment concentration based on Random Forest Regression Model[J]. Journal of Remote Sensing, 2019, 23(4): 756−772. [23] Vazquez J, Gierach M M, Leben R R, et al. Initial results on the variability of sea surface salinity from Aquarius/SAC-D in the Gulf of Mexico[C]//American Geophysical Union, Fall Meeting 2012. San Francisco, CA: AGU, 2012. [24] Wiseman W J, Rabalais N N, Turner R E, et al. Seasonal and interannual variability within the Louisiana coastal current: stratification and hypoxia[J]. Journal of Marine Systems, 1997, 12(1/4): 237−248. [25] Fournier S, Lee T, Gierach M M. Seasonal and interannual variations of sea surface salinity associated with the Mississippi River plume observed by SMOS and Aquarius[J]. Remote Sensing of Environment, 2016, 180: 431−439. doi: 10.1016/j.rse.2016.02.050 [26] Fu Zhiyi, Wu Fangfang, Zhang Zhengliang, et al. Sea surface salinity estimation and spatial-temporal heterogeneity analysis in the gulf of Mexico[J]. Remote Sensing, 2021, 13(5): 881. doi: 10.3390/rs13050881 [27] Binding C E, Bowers D G. Measuring the salinity of the Clyde Sea from remotely sensed ocean colour[J]. Estuarine, Coastal and Shelf Science, 2003, 57(4): 605−611. doi: 10.1016/S0272-7714(02)00399-2 [28] Wouthuyzen S, Tarigan S, Kusmanto E, et al. Measuring sea surface salinity of the Jakarta bay using remotely sensed of ocean color data acquired by modis sensor[J]. Marine Research in Indonesia, 2011, 36(2): 51−70. [29] Darecki M, Stramski D. An evaluation of MODIS and SeaWiFS bio-optical algorithms in the Baltic Sea[J]. Remote Sensing of Environment, 2004, 89(3): 326−350. doi: 10.1016/j.rse.2003.10.012 [30] 王林, 赵冬至, 杨建洪, 等. 大洋河河口海域有色溶解性有机物的光学特性及遥感反演模型[J]. 海洋学报, 2011, 33(1): 45−51.Wang Lin, Zhao Dongzhi, Yang Jianhong, et al. The optical properties and remote sensing retrieval model of chromophoric dissolved organic matter in the Dayang Estuary[J]. Haiyang Xuebao, 2011, 33(1): 45−51. [31] Johannessen S C, Miller W L, Cullen J J. Calculation of UV attenuation and colored dissolved organic matter absorption spectra from measurements of ocean color[J]. Journal of Geophysical Research: Oceans, 2003, 108(C9): 3301. doi: 10.1029/2000JC000514 -


计量
- 文章访问数: 716
- HTML全文浏览量: 228
- PDF下载量: 54
- 被引次数: 0
