

The effect of snow density evolution on modelled snow depth in the Arctic
-
摘要: 积雪具有复杂的时空分布,在高纬度地区的气−冰−海耦合系统中扮演了重要的角色。准确的积雪质量平衡计算可以帮助我们更好地理解海冰演变过程以及极区冰雪与大气之间的相互作用。雪密度是影响积雪质量平衡众多因素中的重要因子。现有的一维高分辨率冰雪热力学模型(如HIGHTSI)中,使用常数块体雪密度均值将降雪雪水当量转化为积雪深度。本文参考拉格朗日冰上积雪模型(SnowModel-LG)模式对积雪分层压实的处理,简化为新、旧两个雪层,并在质量守恒条件下同时考虑新、旧雪层深度对压实增密的响应,将该物理过程加入HIGHTSI模式中。利用ERA-Interim再分析数据作为大气强迫,针对北极15个冰质量平衡浮标沿其漂移轨迹模拟了降雪积累期海冰表面雪密度变化对积雪深度变化的影响,在原HIGHTSI设置下分别采用定常块体雪密度均值330 kg/m3(T1试验)、接近实际的常数新雪密度200 kg/m3(T2试验)以及改进后框架下新、旧雪层随时间压实增密的雪密度(T3试验)计算积雪深度,并将模拟结果与浮标观测进行对比。结果表明,本文改进的算法对雪密度变化的处理更为合理,且能较好地再现积雪深度的变化;考虑新、旧雪层深度对压实增密的响应能较好地避免以较低的降雪密度持续过度积累,以浮标观测为标准,分层积雪密度压实计算得到的平均绝对误差相对T2减小了5 cm。Abstract: Due to its high surface albedo, snow plays an important role in the air-ice-ocean interaction in high-latitude regions. Accurate snow mass balance calculations are needed to understand the evolution of sea ice and interaction between snow-ice and atmosphere better. One of the factors affecting snow mass balance is snow density. Constant mean snow bulk density is used to convert snow water equivalent to snow depth in the present 1-D high-resolution thermodynamic snow-ice model (such as HIGHTSI). Simplified to 2 snow layers, being fresh and old, algorithm reference to Lagrangian snow-evolution model (SnowModel-LG) used to treat layered snow compaction is introduced into HIGHTSI to reproduce the physical process of compacting in both the fresh and old layer and affecting the snow depth following the principle of mass conservation. Forced by ERA-Interim reanalysis data, modified HIGHTSI was applied to investigate the impact of snow density on snow depth along drift trajectories of 15 sea ice mass balance buoys (IMB) during snow accumulation period and assess the model results against observation. In contrast to the previous bulk snow density setting, with a constant density of 330 kg/m3 (T1) or 200 kg/m3 (T2), our new algorithm calculates snow depth by considering both the fresh and old snow densifying over time (T3). The simulations indicate that the improved algorithm is more reasonable to deal with the density evolution, and can reproduced the snow depth well. The overaccumulation caused by heaping continuously at the lower density of new snowfall can be avoided by considering the response of both the fresh and old snow depth to compaction. The absolute error calculated by layered snow compaction is reduced by 5 cm by setting the observation as a reference of both the fresh and old snow depth to compaction. The absolute error calculated by layered snow compaction in T2 is reduced by 5 cm by setting the observation as a reference.
-
Key words:
- Arctic /
- snow depth /
- snow density /
- 1-D high-resolution thermodynamic snow-ice model
-
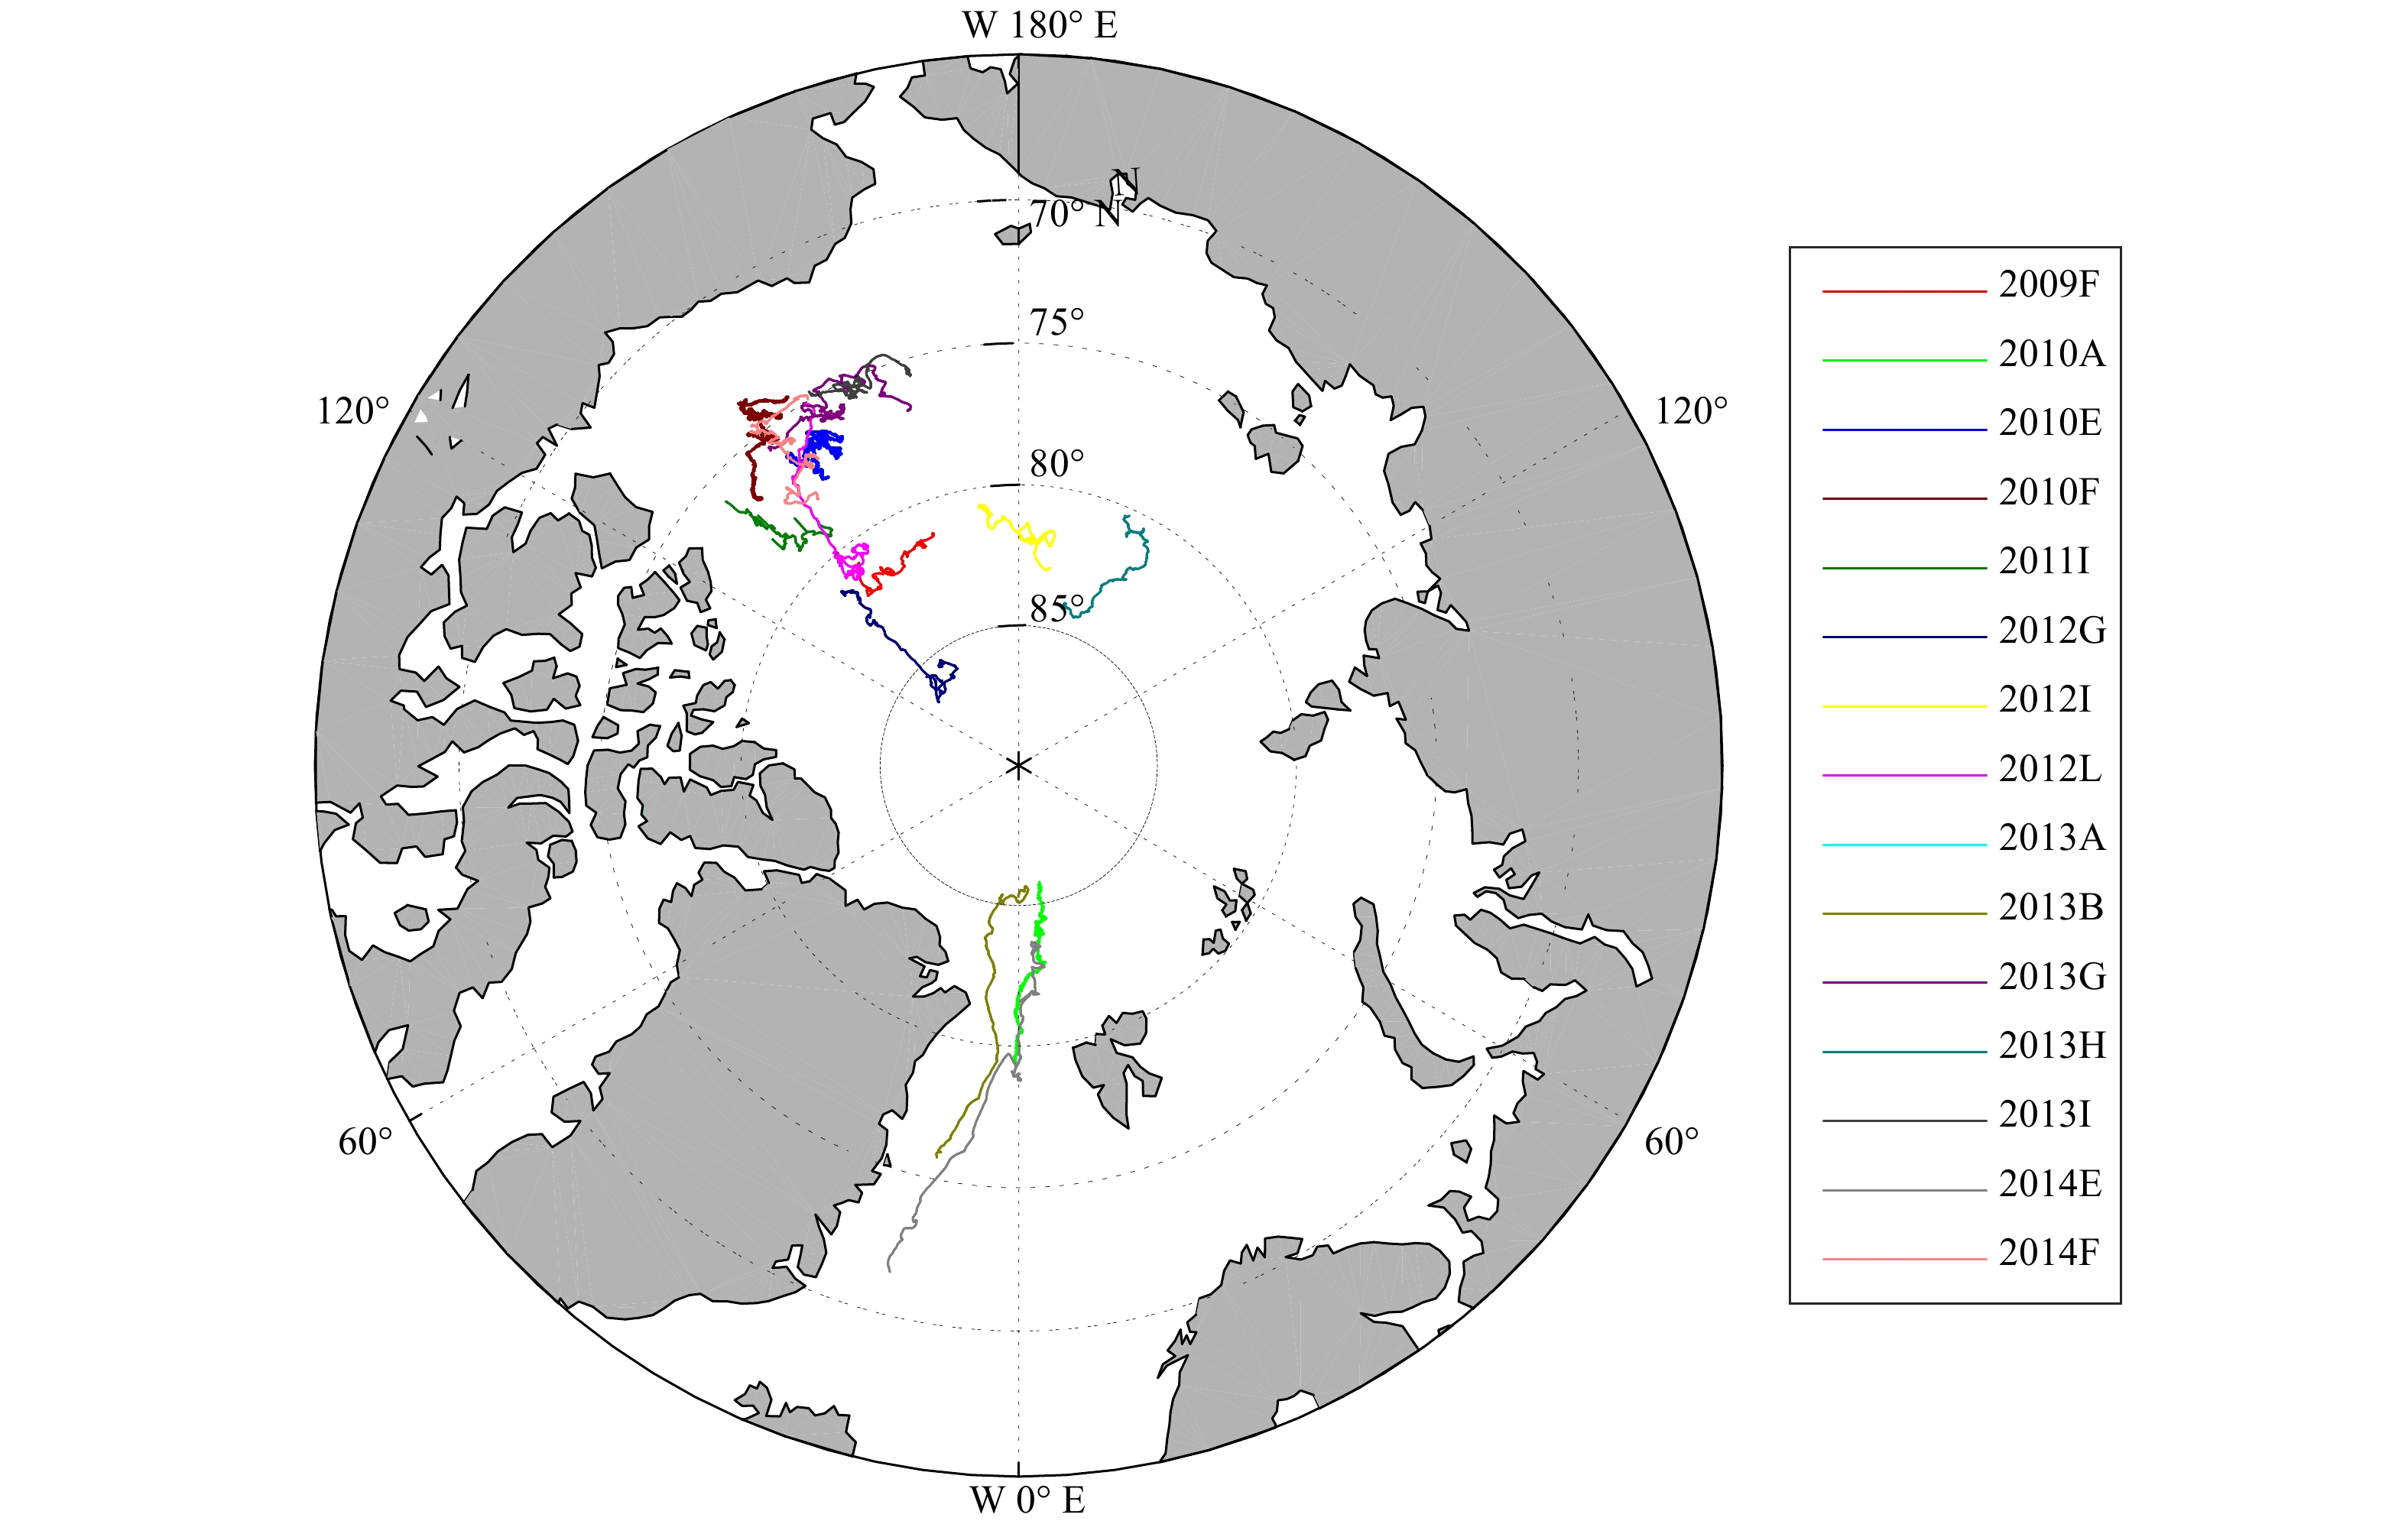
图 1 本文模拟时段内15个IMB的漂移轨迹
Fig. 1 Drift trajectories of 15 IMB during the simulation period
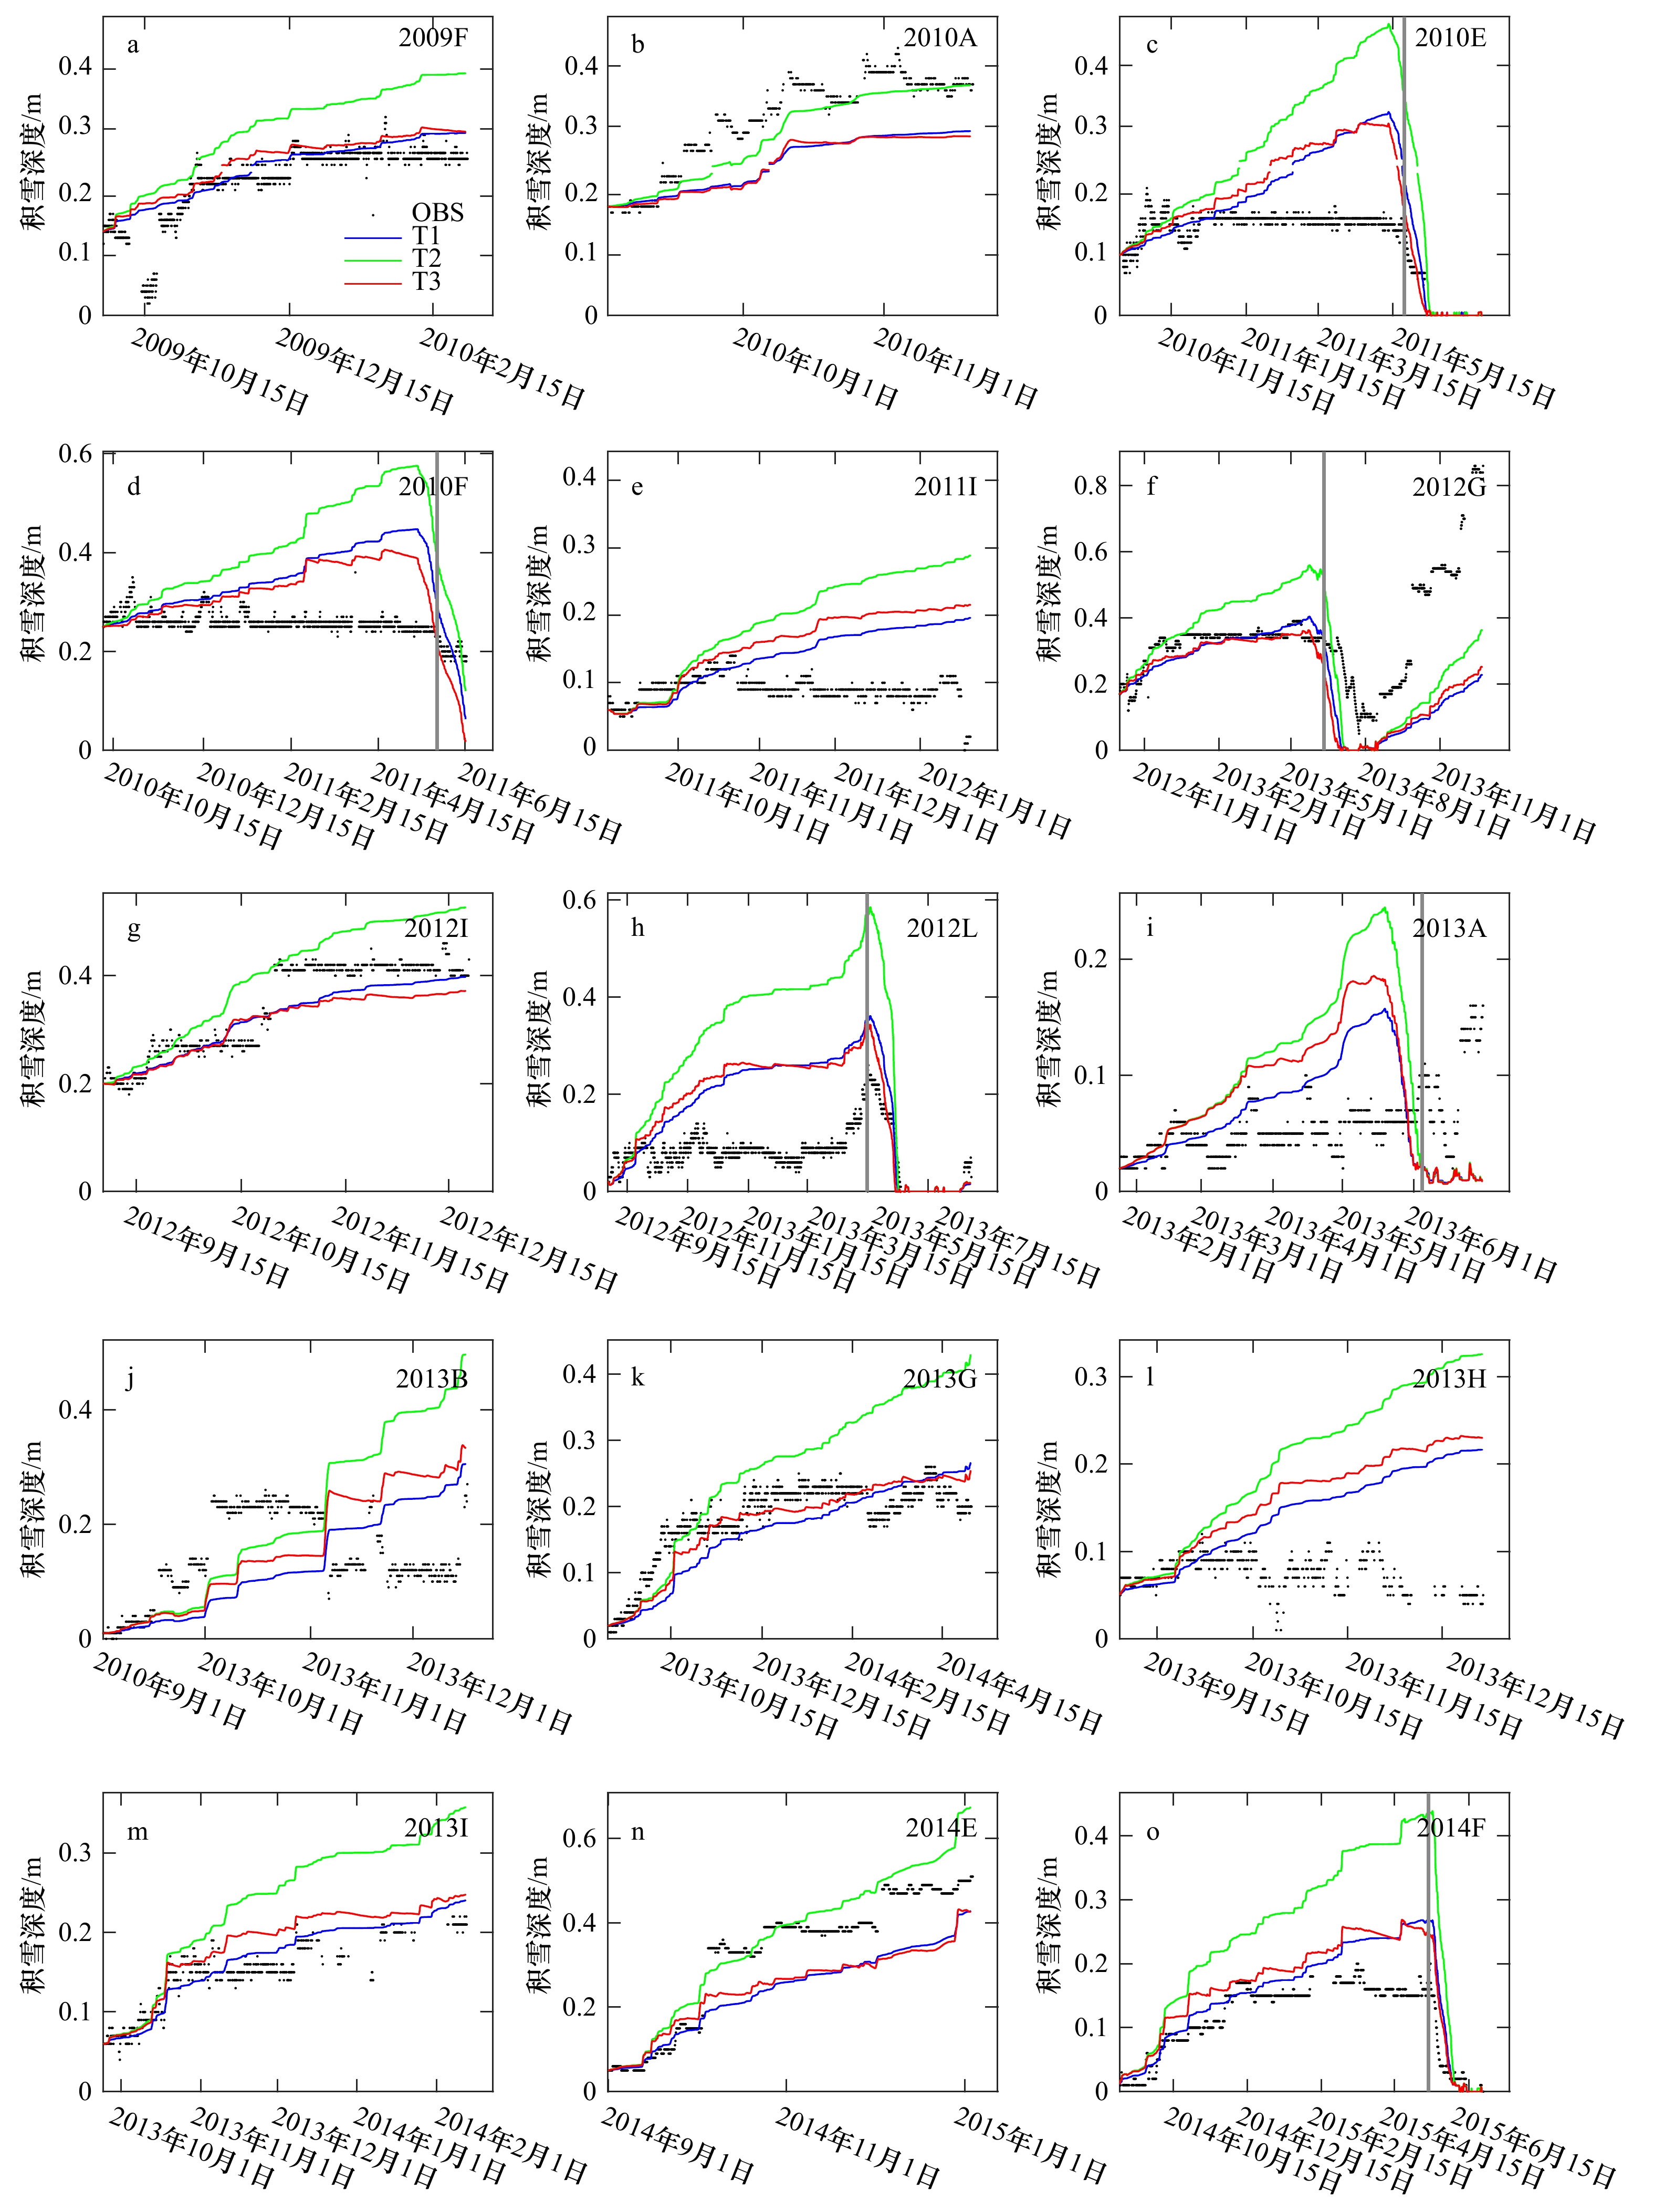
图 2 15个浮标轨迹积累期HIGHTSI各试验模拟积雪深度与IMB实测积雪深度(黑色散点)对比(灰色竖线表示浮标实测融化开始时间)
Fig. 2 Comparison of modelled snow depth against measured (black scattered points) along 15 IMB trajectories during the accumulation period (the measured melt onset is represented by the gray normal line)
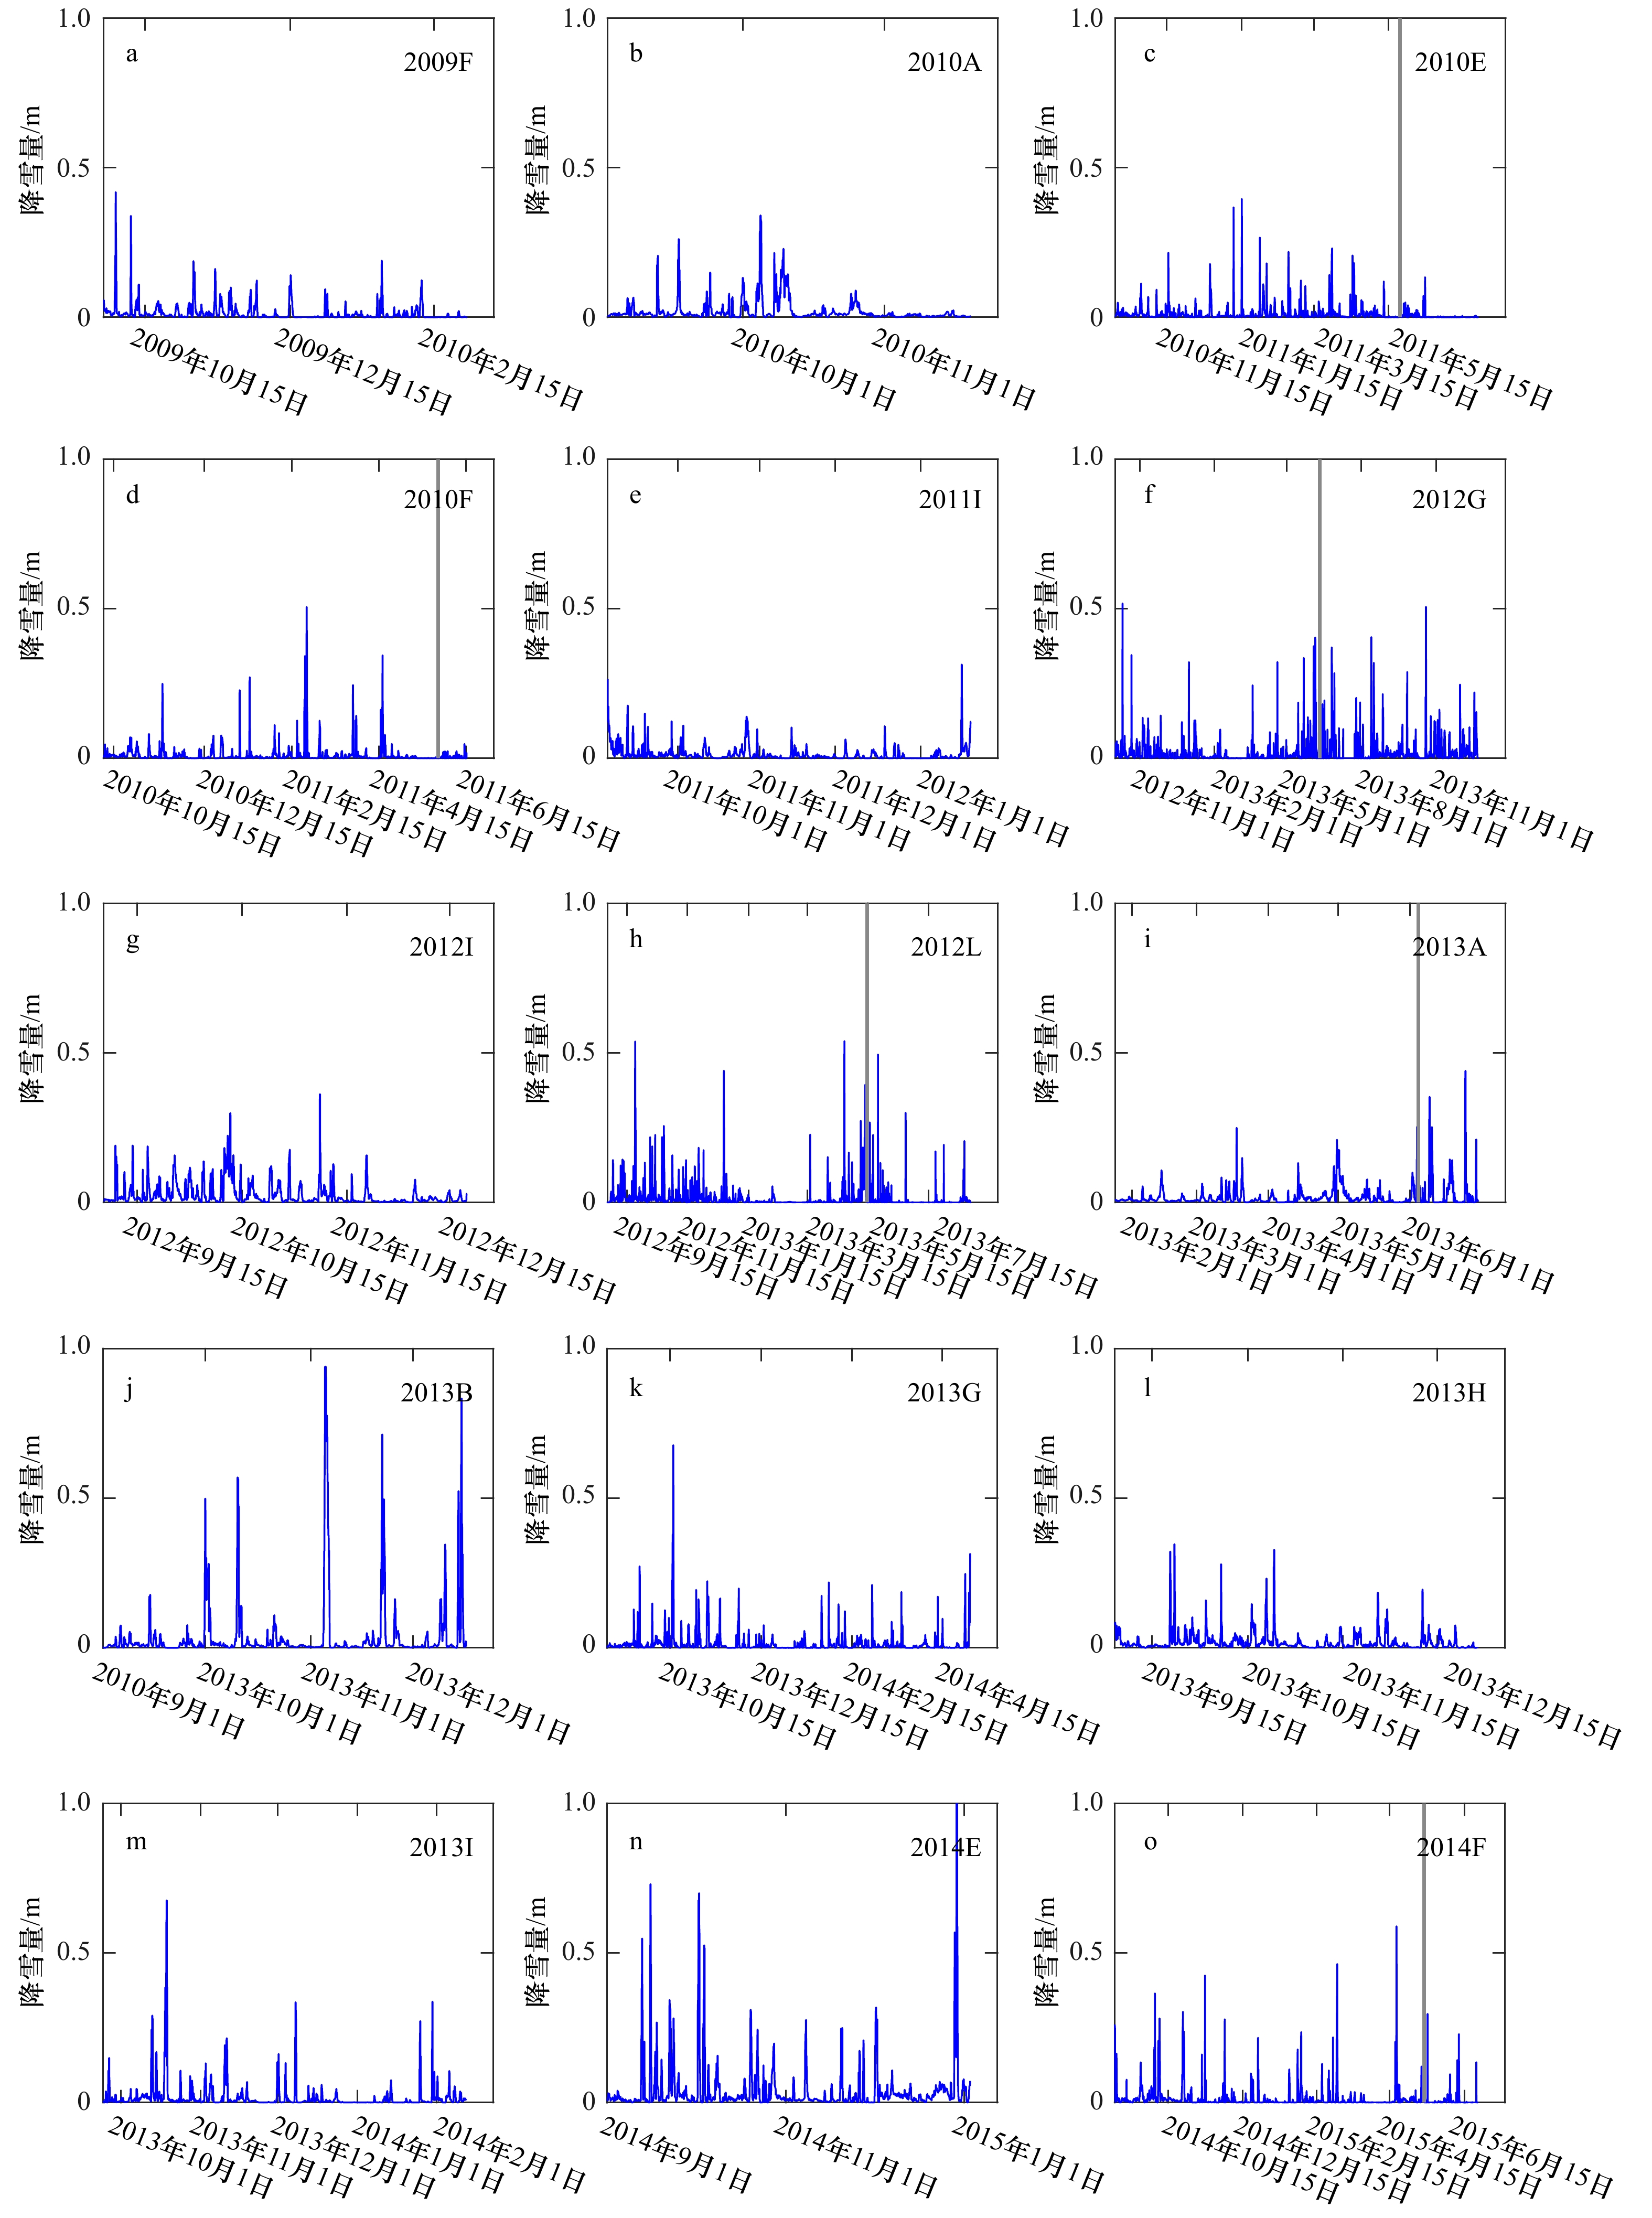
图 3 积雪积累期15个浮标轨迹上ERA-Interim再分析降雪量强迫数据(灰色竖线表示浮标实测融化开始时间)
Fig. 3 Snowfall as model input from ERA-Interim reanalysis data along 15 IMB trajectories during the accumulation period (the measured melt onset is represented by the gray normal line)

图 4 试验T3中15个浮标轨迹积累期A、B雪层密度随时间演变(灰色竖线表示浮标实测融化开始时间)
Fig. 4 Evolution of snow density of A and B layer and bulk density along 15 buoys trajectories during the accumulation period (the measured melt onset is represented by the gray normal line)
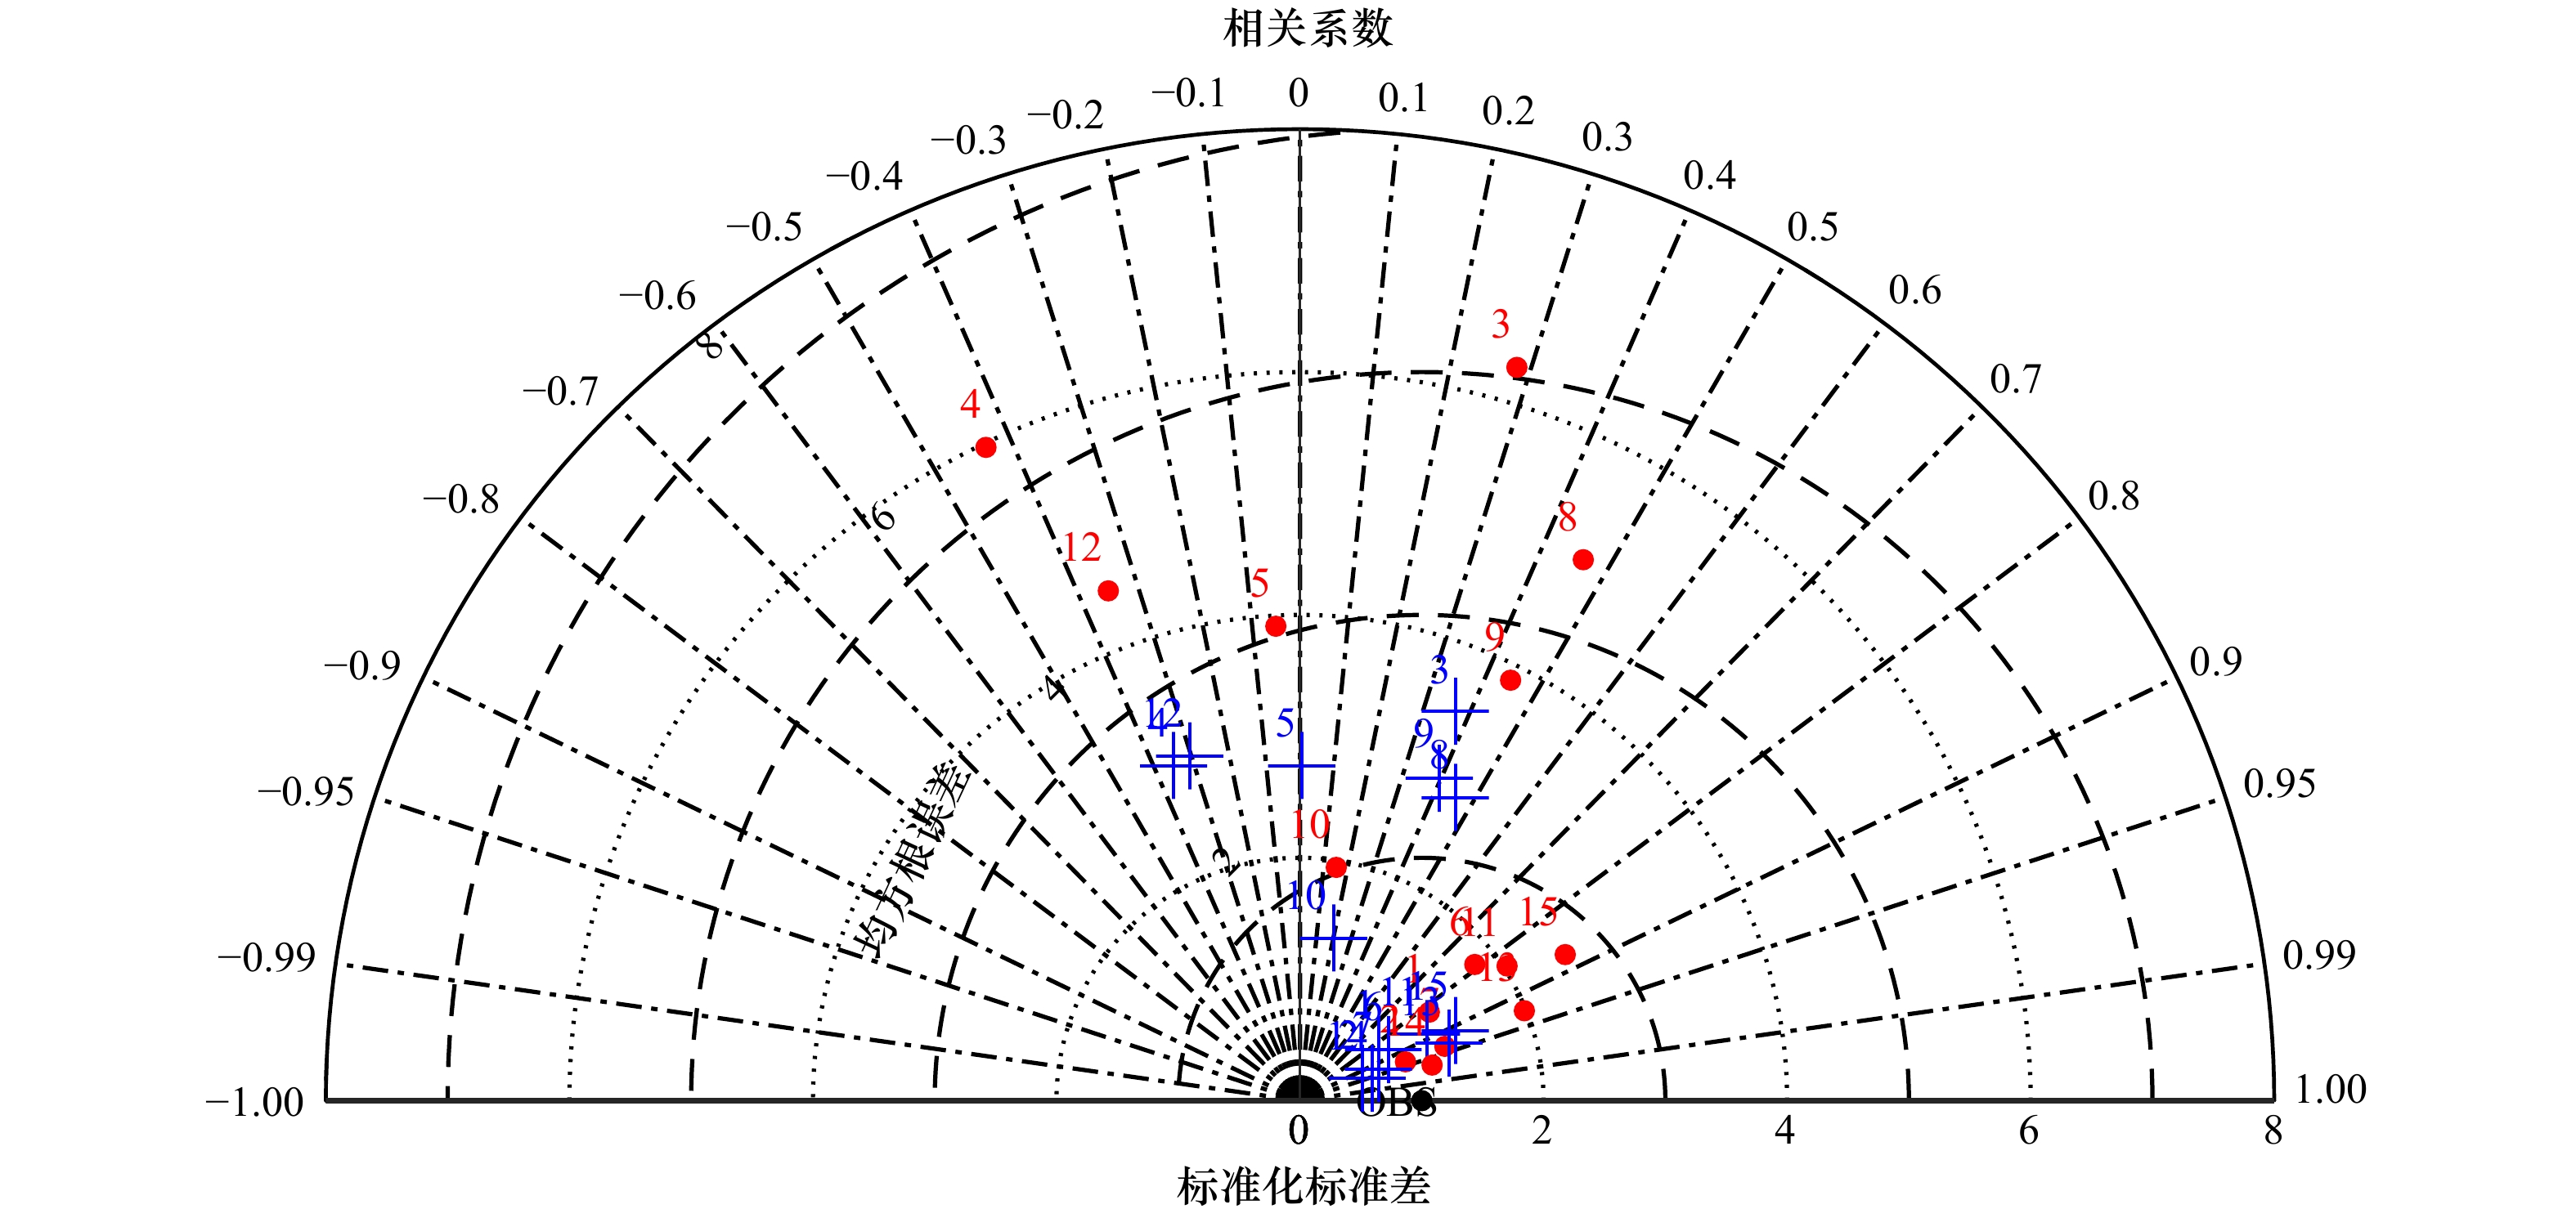
图 5 试验 T2 和 T3 模拟结果及相对于实测的泰勒图
1至15序号依次代表15个浮标(序号与浮标名称对应关系列于表4中),红色点标记代表试验T2统计结果,蓝色十字代表试验T3统计结果,黑点OBS为一个相对的观测基准(标准差=1,均方根误差=0,自相关系数=1),实线圆半径上的数字为标准化标准差,实线半圆周上的数字表示相对实测的相关系数,以黑点OBS观测为圆心的虚线圆周表示均方根误差大小
Fig. 5 Taylor diagram of T2 and T3 results relative to the observation
No. 1-15, in turn, on behalf of the 15 buoys (numbers on the corresponding relationship between the name of buoys in Table 4). Red dots for T2, while blue cross for T3 and the black spot ‘OBS’ for a relative observation datum, which STD = 1, RMSD = 0 and COR = 1. The values on the solid round radius for normalized STD, the solid line half a circle for correlation coefficients, the dotted circle centered on the black spot ‘OBS’ for root mean square errors
表 1 15个浮标模拟起止日期、位置、积雪深度
Tab. 1 The starting and ending data, position, and snow depth of 15 buoys during the simulation period
浮标 模拟起始状态 模拟终止状态 日期 GPS地点 积雪深度/cm 日期 GPS地点 积雪深度/cm 2009F 2009年9月29日 81.18°N,159.62°W 14 2010年3月1日 80.77°N,141.47°W 25 2010A 2010年9月1日 85.77°N,10.26°E 18 2010年11月20日 79.26°N,0.58°W 37 2010E 2010年10月7日 77.54°N,145.39°W 10 2011年7月29日 76.30°N,149.03°W 0 2010F 2010年10月8日 76.71°N,135.22°W 25 2011年6月16日 74.20°N,151.02°W 19 2011I 2011年9月3日 78.55°N,139.99°E 6 2012年1月20日 75.92°N,131.75°W 2 2012G 2012年10月1日 85.34°N,142.89°W 17 2013年12月1日 80.65°N,118.61°W 70 2012I 2013年9月6日 82.87°N,170.61°E 20 2012年12月21日 81.02°N,173.72°W 43 2012L 2012年8月27日 80.89°N,138.02°W 2 2013年8月28日 74.04°N,145.97°W 3 2013A 2013年1月24日 76.39°N,82.89°W 2 2013年6月30日 76.39°N,82.89°W 16 2013B 2013年9月1日 85.30°N,0.12°W 1 2013年12月17日 75.74°N,11.87°W 20 2013G 2013年9月4日 75.69°N,141.46°W 2 2014年5月5日 76.76°N,162.93°W 20 2013H 2013年9月3日 80.26°N,155.90°E 5 2013年12月29日 84.20°N,164.41°E 5 2013I 2013年9月24日 74.74°N,150.43°W 6 2014年2月12日 75.27°N,164.10°W 21 2014E 2014年9月1日 83.51°N,6.09°E 5 2015年1月3日 71.46°N,14.41°W 45 2014F 2014年9月3日 78.06°N,142.46°W 1 2015年6月27日 75.66°N,148.15°W 26  下载: 导出CSV
表 2 HIGHTSI雪密度数值试验的设置
Tab. 2 Configurations of HIGHTSI numerical tests
试验 新降雪密度/(kg∙m−3) 雪深度是否
随时间变化积雪深度对
压实增密的响应T1 330 否 否 T2 200 否 否 T3 200 是 是
下载: 导出CSV
表 3 15个浮标实测积雪深度平均值及各试验的偏差统计结果比较
Tab. 3 Comparison of statistical snow depth results of 3 tests against the measurement
15个浮标实测平均值 试验T1 试验T2 试验T3 平均积雪深度±标准差/cm 19±11 21±10 29±14 22±9 平均差/cm – 3 11 3 平均绝对差/cm – 6±5 12±10 6±5 均方根差/cm – 8 10 7
下载: 导出CSV
表 4 雪积累期各浮标实测积雪深度平均值及标准差、模拟积雪深度以及误差统计结果
Tab. 4 Statistical results including mean, standard deviation, and error of 3 tests against observation during the accumulation period
浮标 序号 实测 T1 T2 T3 AVG±
STD/cmAVG±
STD/cmERR
/cmRMSD
/cmCOR AVG±
STD/cmERR
/cmRMSD
/cmCOR AVG±
STD/cmERR
/cmRMSD
/cmCOR 2009F 1 22±5 24±4 2 3 0.82 30±7 8 4 0.82 25±4 3 3 0.84 2010A 2 31±7 25±4 –7 4 0.94 29±7 –2 3 0.93 24±4 –7 4 0.95 2010E 3 15±2 21±7 6 6 0.29 28±11 13 11 0.28 22±6 7 6 0.37 2010F 4 26±2 35±6 9 7 –0.42 42±10 16 11 –0.43 33±5 7 6 –0.35 2011I 5 9±2 14±5 5 5 –0.05 19±8 10 8 –0.05 16±5 7 6 –0.01 2012G 6 32±6 31±6 –1 4 0.80 41±10 9 7 0.79 30±5 –2 3 0.86 2012I 7 34±9 32±6 –2 3 0.94 40±11 6 4 0.94 31±6 –3 4 0.93 2012L 8 8±3 21±8 12 7 0.46 33±14 24 13 0.46 21±8 13 7 0.45 2013A 9 5±2 8±4 3 4 0.41 12±7 7 6 0.45 10±5 5 5 0.39 2013B 10 14±7 13±9 –2 11 0.15 21±15 6 15 0.15 16±10 1 11 0.20 2013G 11 18±6 16±7 –2 4 0.84 26±12 7 8 0.84 18±7 –1 3 0.89 2013H 12 8±2 14±5 5 6 –0.35 20±9 10 9 –0.35 16±6 7 6 –0.31 2013I 13 14±4 17±5 1 2 0.93 24±9 7 5 0.93 19±5 3 2 0.93 2014E 14 32±15 24±10 –9 6 0.97 36±17 4 5 0.97 25±9 –8 7 0.96 2014F 15 13±5 16±7 4 4 0.88 26±12 14 8 0.88 18±7 5 3 0.91 综合15个 – 19±11 21±10 3 8 0.74 29±14 11 10 0.66 22±9 3 7 0.73 注:AVG±STD:积雪深度平均值±标准差;ERR:相对实测平均差;RMSD:相对实测均方根误差;COR:相对实测相关系数。
下载: 导出CSV
表 5 15 个浮标模拟峰值所在月份、 模拟峰值时段内 3 个数值试验模拟积雪深度结果、 IMB 实测积雪深度结果与 W99 气候态积雪深度对比
Tab. 5 Months when modelled peak occurs, snow depth from 3 numerical tests, and observation results during the peak period against W99 climatology snow depth results
浮标 模拟最大积雪深度所在月份 IMB实测积雪深度/cm T1积雪深度/cm T2积雪深度/cm T3积雪深度/cm W99气候态积雪深度/cm 2009F 3月 25 29 39 30 33 2010A 11月 37 29 37 28 27 2010E 5月 14 32 47 30 33 2010F 5月 24 45 58 39 29 2011I 1月 2 20 29 22 30 2012G 5月 33 40 56 36 39 2012I 12月 43 40 53 37 26 2012L 5月 24 36 58 34 30 2013A 5月 6 16 24 18 53 2013B 12月 20 31 50 33 28 2013G 5月 20 27 43 26 32 2013H 12月 5 22 33 23 26 2013I 2月 21 24 36 25 29 2014E 1月 51 43 67 43 44 2014F 4月 15 27 44 24 34 综合15个 – 23±13 31±8 45±12 30±7 33±7
下载: 导出CSV
-
[1] Kwok R, Rothrock D A. Decline in Arctic sea ice thickness from submarine and ICESat records: 1958−2008[J]. Geophysical Research Letters, 2009, 36(15): L15501. [2] Maslanik J, Stroeve J, Fowler C, et al. Distribution and trends in Arctic sea ice age through spring 2011[J]. Geophysical Research Letters, 2011, 38(13): L13502. [3] Markus T, Stroeve J C, Miller J. Recent changes in Arctic sea ice melt onset, freezeup, and melt season length[J]. Journal of Geophysical Research: Oceans, 2009, 114(C12): C12024. doi: 10.1029/2009JC005436 [4] Bliss A C, Anderson M R. Arctic sea ice melt onset timing from passive microwave-based and surface air temperature-based methods[J]. Journal of Geophysical Research: Atmospheres, 2018, 123(17): 9063−9080. doi: 10.1029/2018JD028676 [5] Webster M A, Rigor I G, Nghiem S V, et al. Interdecadal changes in snow depth on Arctic sea ice[J]. Journal of Geophysical Research: Oceans, 2015, 119(8): 5395−5406. [6] Simmonds I, Burke C, Keay K. Arctic climate change as manifest in cyclone behavior[J]. Journal of Climate, 2008, 21(22): 5777−5796. doi: 10.1175/2008JCLI2366.1 [7] Boisvert L N, Webster M A, Petty A A, et al. Intercomparison of precipitation estimates over the Arctic Ocean and its peripheral seas from reanalyses[J]. Journal of Climate, 2018, 31(20): 8441−8462. doi: 10.1175/JCLI-D-18-0125.1 [8] Webster M, Gerland S, Holland M, et al. Snow in the changing sea-ice systems[J]. Nature Climate Change, 2018, 8(11): 946−953. doi: 10.1038/s41558-018-0286-7 [9] Merkouriadi I, Cheng B, Hudson S R, et al. Effect of frequent winter warming events (storms) and snow on sea-ice growth—a case from the Atlantic sector of the Arctic Ocean during the N-ICE2015 campaign[J]. Annals of Glaciology, 2020, 61(82): 164−170. doi: 10.1017/aog.2020.25 [10] Leppäranta M. A growth model for black ice, snow ice and snow thickness in subarctic basins[J]. Hydrology Research, 1983, 14(2): 59−70. doi: 10.2166/nh.1983.0006 [11] Cheng Bin, Launianen J, Vihma T. Modelling of superimposed ice formation and subsurface melting in the Baltic sea[J]. Geophysica, 2003, 39(1): 31−50. [12] Wang Caixin, Cheng Bin, Wang Keguang, et al. Modelling snow ice and superimposed ice on landfast sea ice in Kongsfjorden, Svalbard[J]. Polar Research, 2015, 34(1): 20828. doi: 10.3402/polar.v34.20828 [13] Merkouriadi I, Cheng Bin, Graham R M, et al. Critical role of snow on sea ice growth in the Atlantic sector of the Arctic Ocean[J]. Geophysical Research Letters, 2017, 44(20): 10479−10485. doi: 10.1002/2017GL075494 [14] Merkouriadi I, Liston G E, Graham R M, et al. Quantifying the potential for snow-ice formation in the Arctic Ocean[J]. Geophysical Research Letters, 2020, 47(4): e2019GL085020. [15] Granskog M A, Rösel A, Dodd P A, et al. Snow contribution to first-year and second-year Arctic sea ice mass balance north of Svalbard[J]. Journal of Geophysical Research: Oceans, 2017, 122(3): 2539−2549. doi: 10.1002/2016JC012398 [16] Ledley T S. Snow on sea ice: Competing effects in shaping climate[J]. Journal of Geophysical Research: Atmospheres, 1991, 96(D9): 17195−17208. doi: 10.1029/91JD01439 [17] Shapiro L H, Johnson J B, Sturm M, et al. Snow mechanics: Review of the state of knowledge and applications[R]. US Army Cold Regions: Research and Engineering Laboratory, 1997. [18] Anderson E A. A point energy and mass balance model of a snow cover[R]. Washington: US Department of Commerce, National Oceanic and Atmospheric Administration, National Weather Service, Office of Hydrology, 1976. [19] Brun E, Martin Ε, Simon V, et al. An energy and mass model of snow cover suitable for operational avalanche forecasting[J]. Journal of Glaciology, 1989, 35(121): 333−342. doi: 10.1017/S0022143000009254 [20] Lehning M, Bartelt P, Brown B, et al. Snowpack model calculations for avalanche warning based upon a new network of weather and snow stations[J]. Cold Regions Science and Technology, 1999, 30(1/3): 145−157. [21] Boone A. Description du schema de neige ISBA-ES (Explicit Snow)[Z/OL]. [2021−03−25]. http://www.umr-cnrm.fr/IMG/pdf/snowdoc_v2.pdf. [22] Huintjes E, Sauter T, Schröter B, et al. Evaluation of a coupled snow and energy balance model for Zhadang Glacier, Tibetan Plateau, using glaciological measurements and time-lapse photography[J]. Arctic Antarctic & Alpine Research, 2015, 47(3): 573−590. [23] Sauter T, Arndt A, Schneider C. COSIPY v1.3-an open-source coupled snowpack and ice surface energy and mass balance model[J]. Geoscientific Model Development, 2020, 13(11): 5645−5662. doi: 10.5194/gmd-13-5645-2020 [24] Liston G E, Itkin P, Stroeve J, et al. A Lagrangian snow-evolution system for sea-ice applications (SnowModel-LG): Part I-model description[J]. Journal of Geophysical Research: Oceans, 2020, 125(10): e2019JC015913. [25] Launiainen J, Cheng Bin. Modelling of ice thermodynamics in natural water bodies[J]. Cold Regions Science and Technology, 1998, 27(3): 153−178. doi: 10.1016/S0165-232X(98)00009-3 [26] Saloranta T M. Modeling the evolution of snow, snow ice and ice in the Baltic Sea[J]. Tellus A: Dynamic Meteorology and Oceanography, 2010, 52(1): 93−108. [27] Cheng Bin, Zhang Zhanhai, Vihma T, et al. Model experiments on snow and ice thermodynamics in the Arctic Ocean with CHINARE 2003 data[J]. Journal of Geophysical Research: Oceans, 2008, 113(C9): C09020. [28] Huwald H, Tremblay L B, Blatter H. Reconciling different observational data sets from Surface Heat Budget of the Arctic Ocean (SHEBA) for model validation purposes[J]. Journal of Geophysical Research: Oceans, 2005, 110(C5): C05009. [29] Zhao Jiechen, Cheng Bin, Vihma T, et al. Observation and thermodynamic modeling of the influence of snow cover on landfast sea ice thickness in Prydz Bay, East Antarctica[J]. Cold Regions Science and Technology, 2019, 168: 102869. doi: 10.1016/j.coldregions.2019.102869 [30] Richter-Menge J A, Perovich D K, Elder B C, et al. Ice mass-balance buoys: A tool for measuring and attributing changes in the thickness of the Arctic sea-ice cover[J]. Annals of Glaciology, 2006, 44: 205−210. doi: 10.3189/172756406781811727 [31] Polashenski C, Perovich D, Richter-Menge J, et al. Seasonal ice mass-balance buoys: Adapting tools to the changing Arctic[J]. Annals of Glaciology, 2011, 52(57): 18−26. doi: 10.3189/172756411795931516 [32] Lei Ruibo, Li Na, Heil P, et al. Multiyear sea ice thermal regimes and oceanic heat flux derived from an ice mass balance buoy in the Arctic Ocean[J]. Journal of Geophysical Research: Oceans, 2014, 119(1): 537−547. [33] Nicolaus M, Hoppmann M, Arndt S, et al. Snow depth and air temperature seasonality on sea ice derived from snow buoy measurements[J]. Frontiers in Marine Science, 2021, 8: 655446. doi: 10.3389/fmars.2021.655446 [34] Warren S G, Rigor I G, Untersteiner N, et al. Snow depth on Arctic sea ice[J]. Journal of Climate, 1999, 12(6): 1814−1829. doi: 10.1175/1520-0442(1999)012<1814:SDOASI>2.0.CO;2 [35] Cheng Bin, Mäkynen M, Similä M, et al. Modelling snow and ice thickness in the coastal Kara Sea, Russian Arctic[J]. Annals of Glaciology, 2013, 54(62): 105−113. doi: 10.3189/2013AoG62A180 [36] Li Shutong, Dou Tingfeng, Xiao Cunde. A preliminary investigation of Arctic sea ice negative freeboard from in-situ observations and radar altimetry[J]. Journal of Ocean University of China, 2021, 20(2): 307−314. doi: 10.1007/s11802-021-4380-5 [37] Maksym T, Jeffries M O. A one-dimensional percolation model of flooding and snow ice formation on Antarctic sea ice[J]. Journal of Geophysical Research: Oceans, 2000, 105(C11): 26313−26331. doi: 10.1029/2000JC900130 [38] Cheng Bin, Vihma T, Rontu L, et al. Evolution of snow and ice temperature, thickness and energy balance in Lake Orajärvi, northern Finland[J]. Tellus A: Dynamic Meteorology and Oceanography, 2014, 66(1): 21564. doi: 10.3402/tellusa.v66.21564 [39] Liston G E, Sturm M. A snow-transport model for complex terrain[J]. Journal of Glaciology, 1998, 44(148): 498−516. doi: 10.1017/S0022143000002021 [40] Liston G E, Haehnel R B, Sturm M, et al. Simulating complex snow distributions in windy environments using SnowTran-3D[J]. Journal of Glaciology, 2007, 53(181): 241−256. doi: 10.3189/172756507782202865 [41] Aleksandrov Y I, Bryazgin N N, Førland E J, et al. Seasonal, interannual and long-term variability of precipitation and snow depth in the region of the Barents and Kara seas[J]. Polar Research, 2005, 24(1/2): 69−85. [42] Rösel A, Itkin P, King J, et al. Thin sea ice, thick snow, and widespread negative freeboard observed during N-ICE2015 north of svalbard[J]. Journal of Geophysical Research: Oceans, 2018, 123(2): 1156−1176. doi: 10.1002/2017JC012865 -

计量
- 文章访问数: 407
- HTML全文浏览量: 175
- PDF下载量: 60
- 被引次数: 0
