

Regulation of El Niño event on riverine COD export: Evidence from high frequency time-series buoy monitoring
-
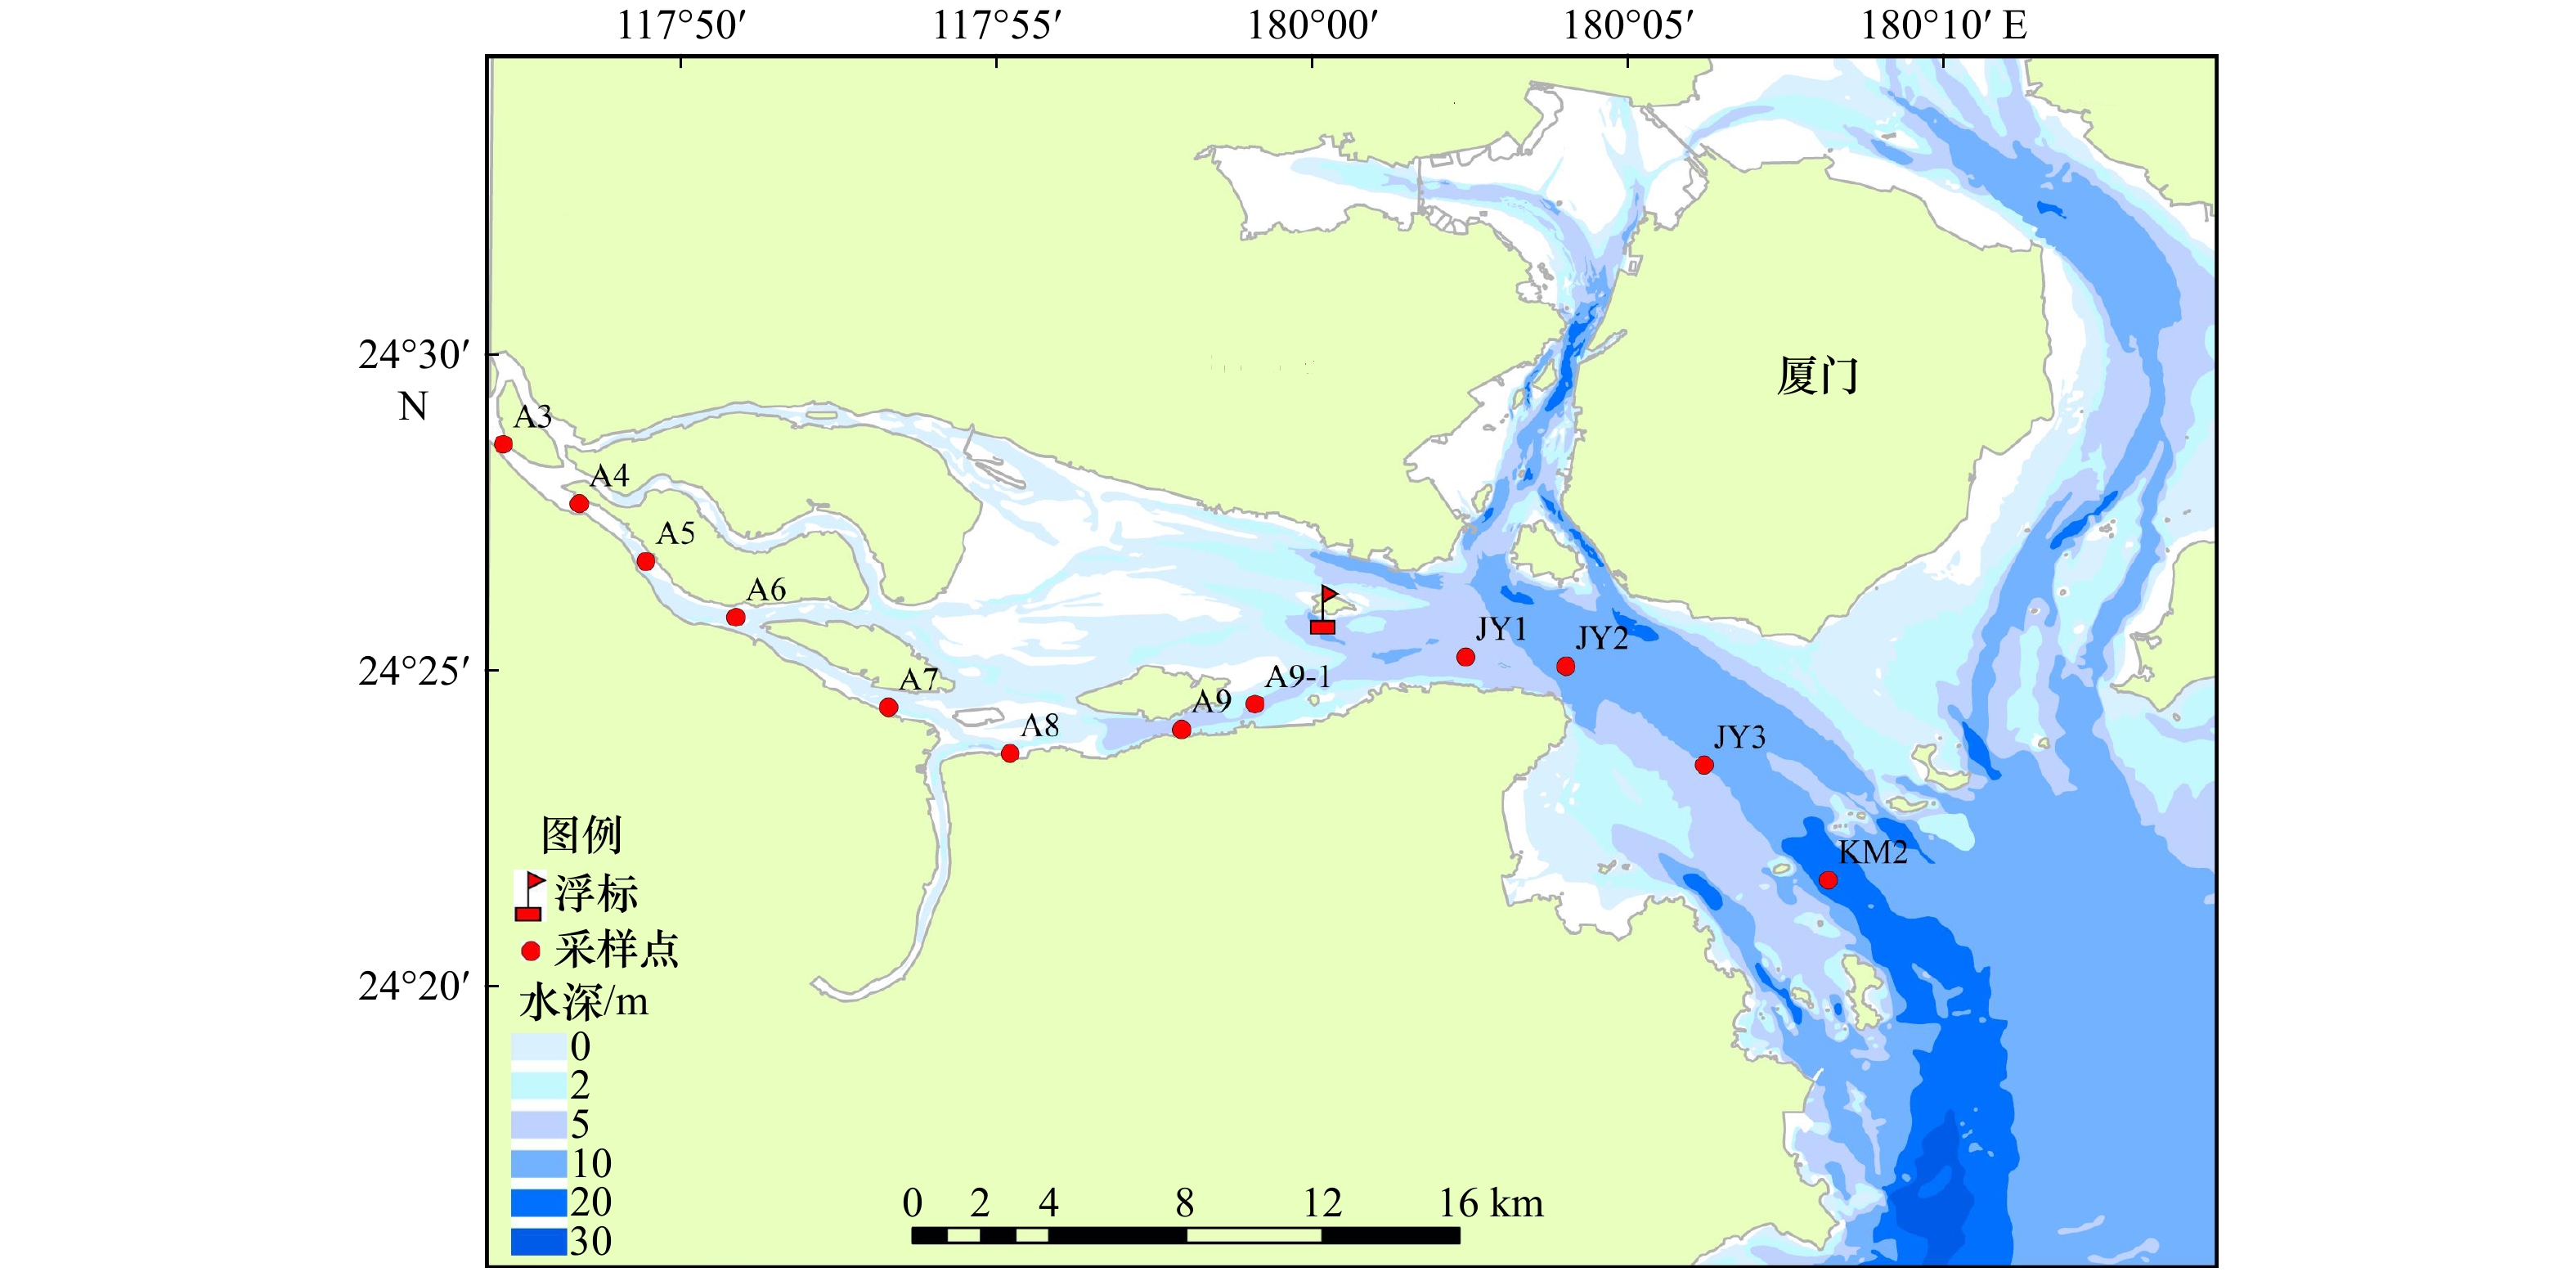
摘要: 入海污染物在线监测是实现海洋污染总量控制和测管协同的关键手段之一。本文基于布设在福建省九龙江口的多参数浮标,获取2014−2018年浮标盐度和荧光溶解有机质(FDOM)数据,结合人工采样测定化学需氧量(COD)浓度,建立了河口区COD浓度的快速反演模型。使用有效浓度法外推得到河端COD浓度,结合流量数据估算了高频率的COD入海通量,利用通量分解模型定量分析了COD入海通量的调控因素。结果表明:(1) COD河端有效浓度的拟合值与实测值的偏差为(10.4±8.8)%,模型能够较好地反演九龙江口河端的COD浓度;(2)在季节尺度上,受2015−2016年超强El Niño事件影响,2016年旱季的异常降雨降低了河流COD浓度,但是径流量的增加仍然显著提高了该季节COD的入海通量;(3)在年际尺度上,2015−2016年El Niño事件所引起的异常降雨事件导致2016年九龙江COD入海通量为(4.4 ± 0.9)×104 t/a,显著高于2014年、2015年及2017年的3.0×104~3.2×104 t/a。上述研究结果表明,FDOM水质浮标在线监测系统,有助于实现对陆源COD入海通量及其调控因素的长期连续高频监测,可为海洋生态环境保护和管理提供重要技术支撑。Abstract: Online monitoring of pollutants exporting into coastal waters is one of the key technique to realize marine pollution control and coordination of monitoring and management. In this study, based on salinity and fluorescence dissolved organic matter (FDOM) sensor data between 2014−2018 from a multi-parameter buoy deployed in Jiulong River Estuary, a rapid inversion model of chemical oxygen demand (COD) was established. Daily river end member COD concentrations were then extrapolated by effective concentration method. Combined with daily runoff data, daily estuarine export fluxes of COD between 2014 and 2017 were estimated. The factors controlling the flux variations were quantified by flux decomposition model. The results indicated: (1) The average concentration deviation of the inversion was (10.4±8.8)%, indicating the good reliability and stability of inversion model. (2) On seasonal scale, COD concentration in dry season of 2016 was lower than the other dry seasons, which was regulated by 2015−2016 super El Niño events. However, the sharp increase of runoff still significantly increased the COD export flux. (3) On annual scale, the COD export flux in 2016 from the Jiulong River 4.4 ×10⁴ t/a was significantly higher than the other three years (3.0−3.2)×104 t/a. The abnormal precipitation in 2016 caused by 2015−2016 El Niño event was the major reason for such yearly variation. This study highlighted the application of online FDOM sensor system for high frequency monitoring of COD export. This would help to achieve long-term continuous high-frequency monitoring of land-based pollutants and their fluxes into the sea and their regulatory factors. This would provide important technical support for marine ecological environmental protection and management.
-

图 2 不同季节浮标FDOM与实测COD数据的分布及二者的相关性分析
Fig. 2 Distribution of measured COD and sensor FDOM data in different seasons and their correlation analysis
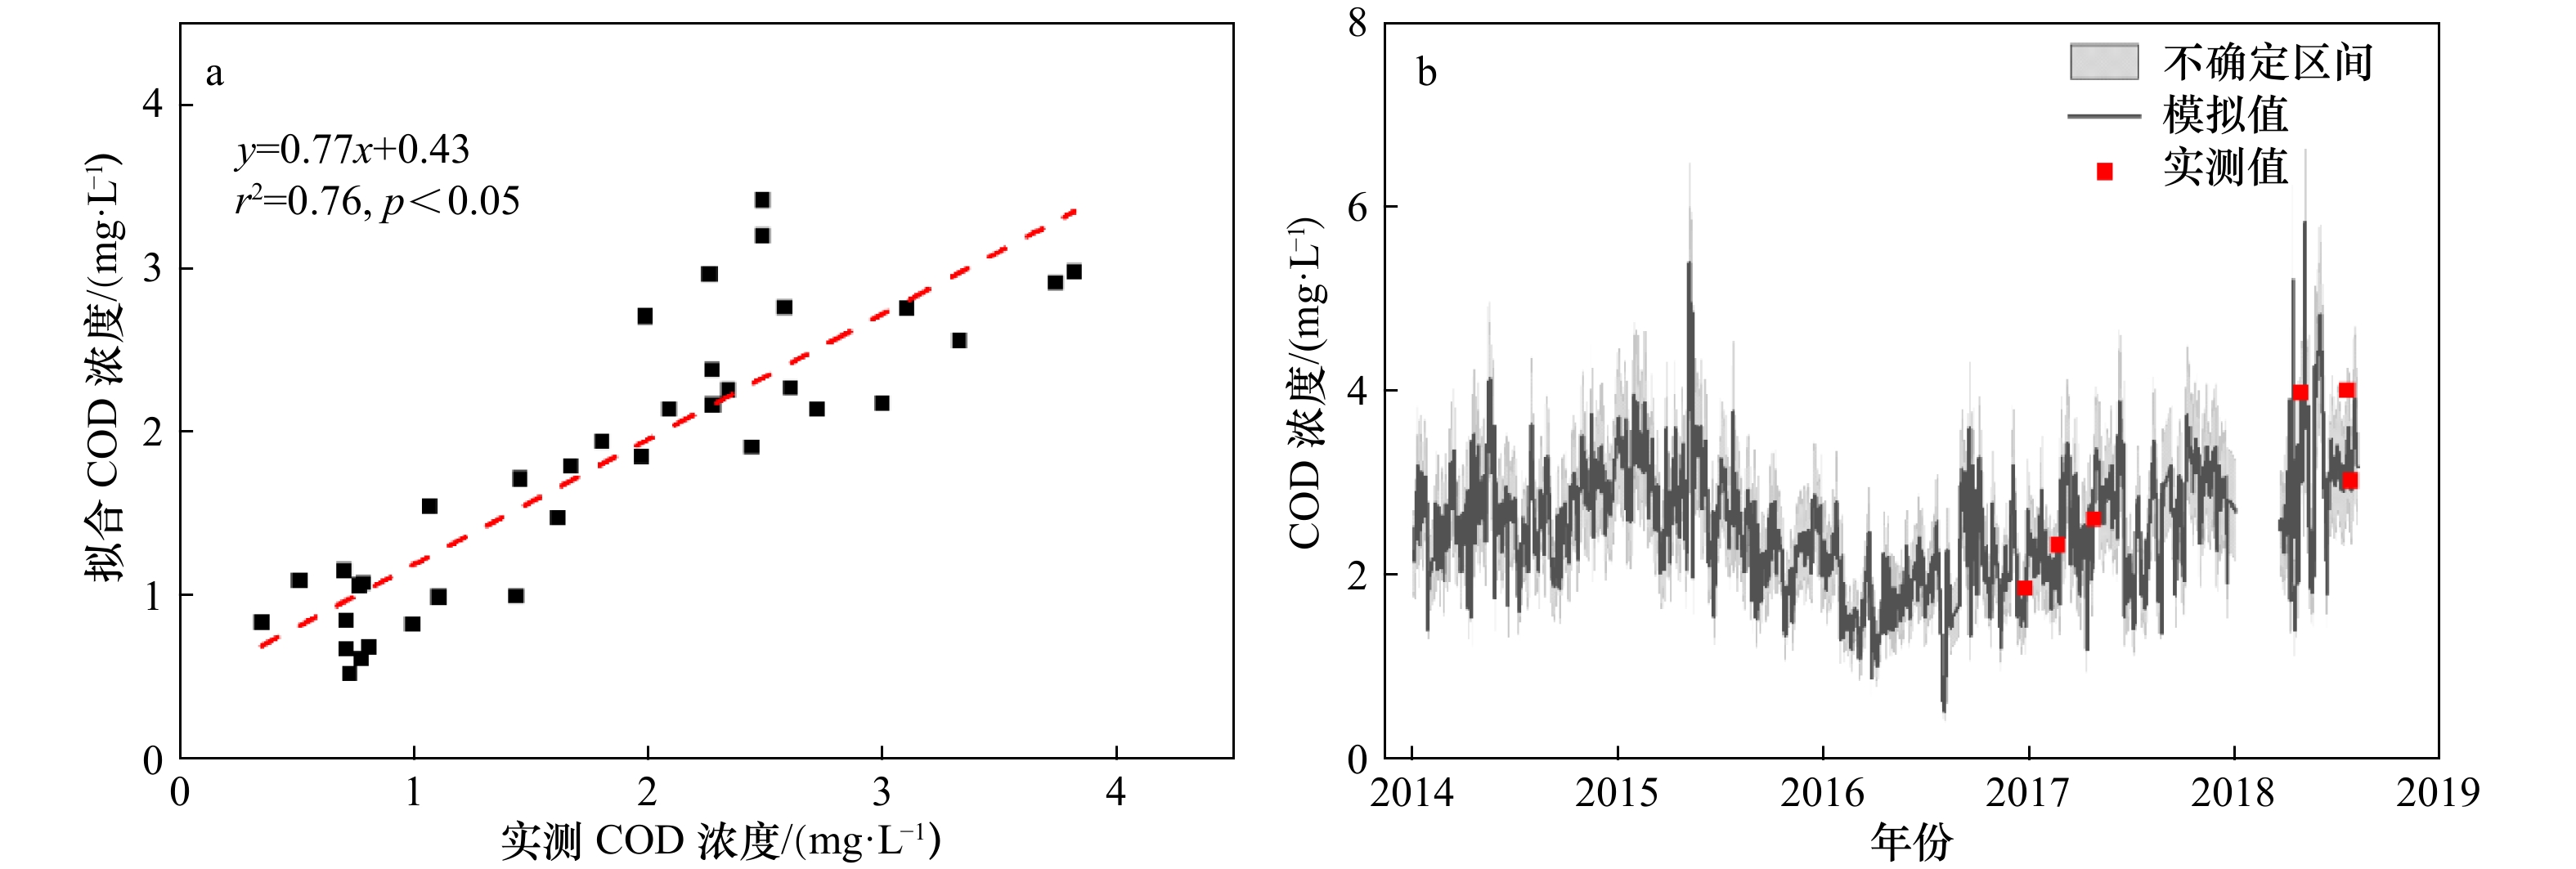
图 3 COD实测值与拟合值的相关性(a)以及根据拟合曲线反演的2014−2018年河端COD浓度(灰线)与根据实测值外推的河端COD浓度(红点)的比较(b)
Fig. 3 Correlation between measured COD and fitted COD (a) and comparison of river COD concentrations (red point) extrapolated from fitting curve and those extrapolated from measured COD (grey line) from 2014 to 2018 (b)
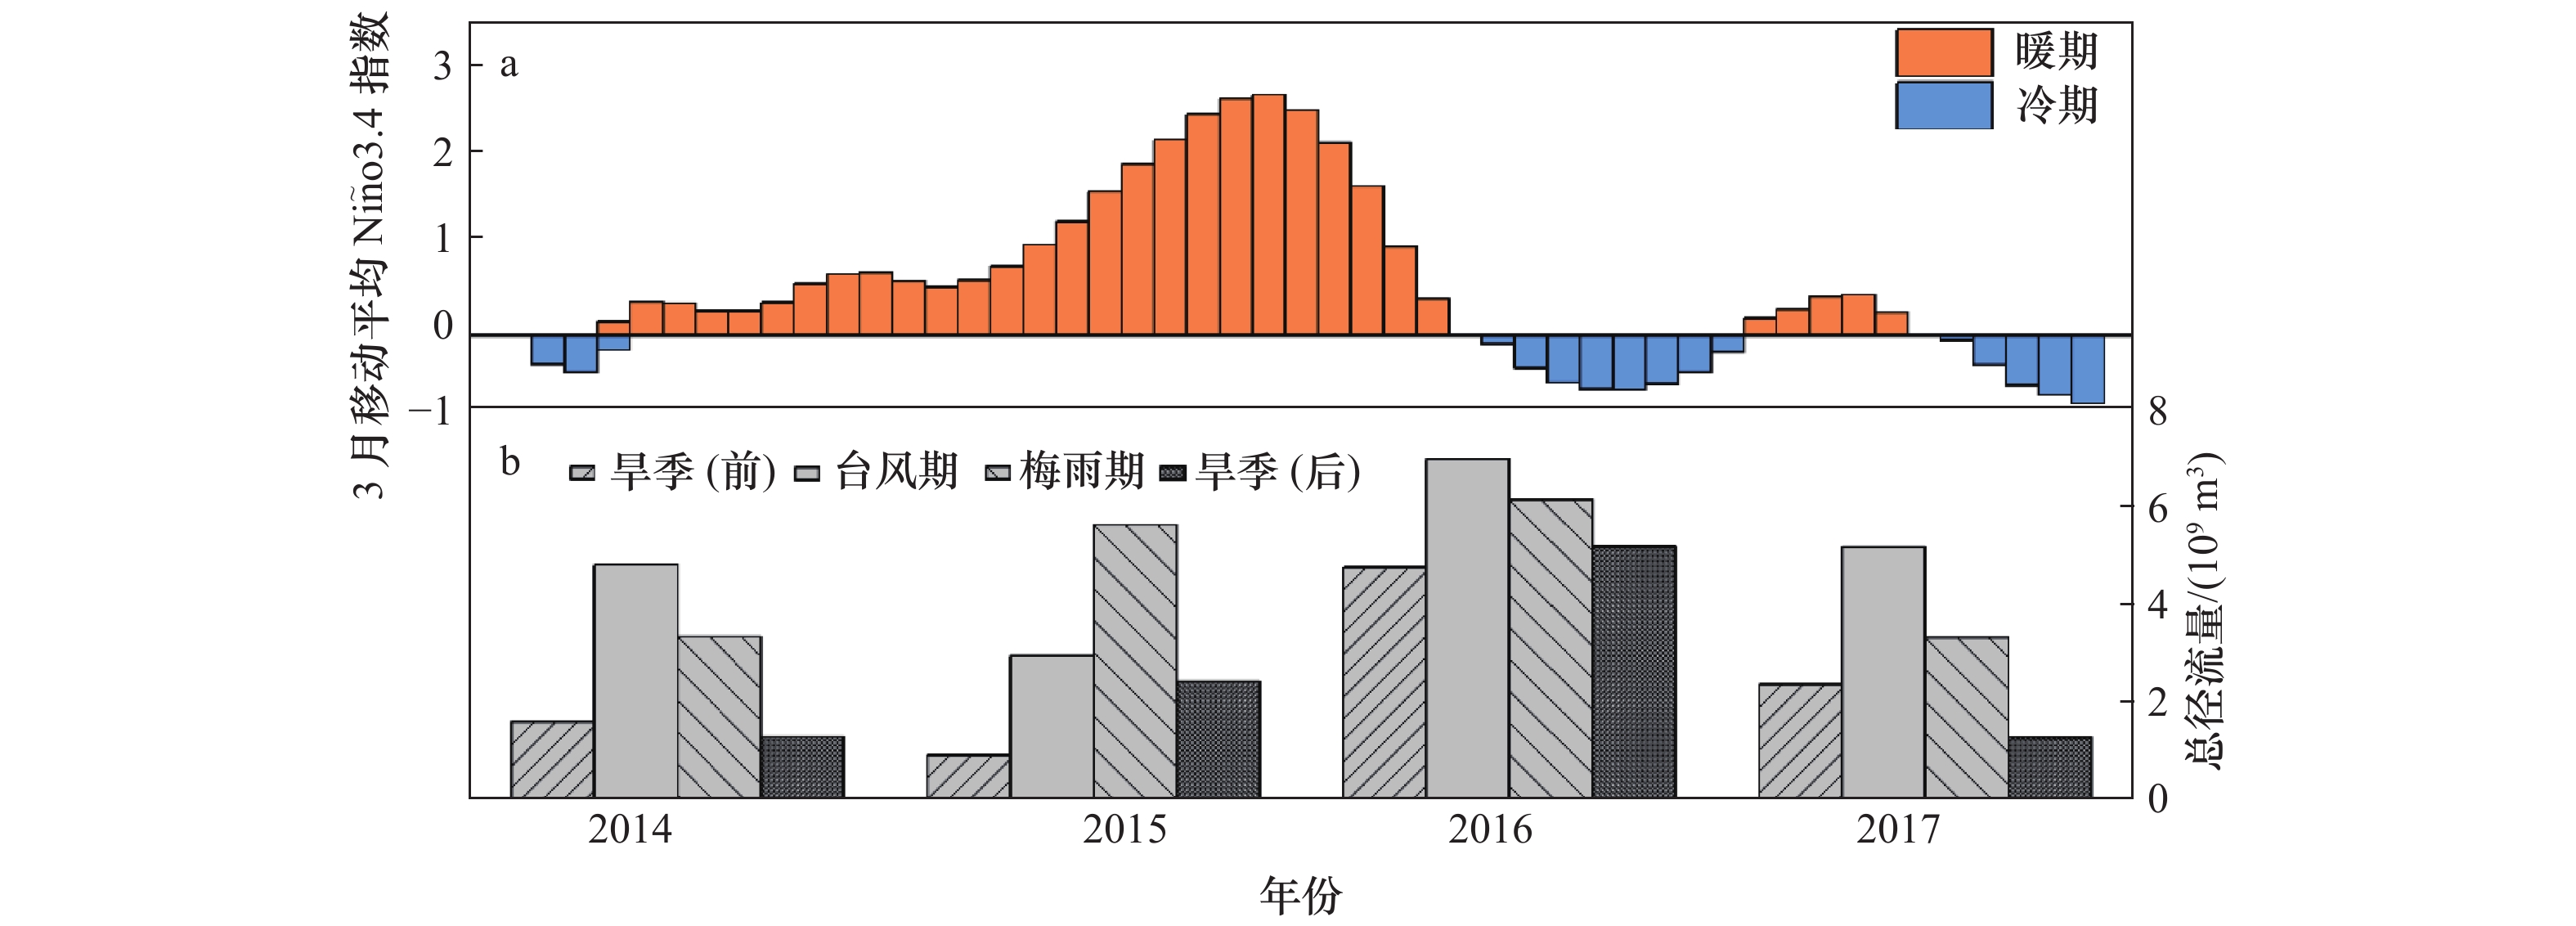
图 4 2014−2017年Niño 3.4指数与九龙江径流量变化趋势
Fig. 4 Variation of Niño 3.4 index and seasonal runoff of the Jiulong River watershed from 2014 to 2017


图 6 2014−2017年COD入海通量的通量分解模型结果
Fig. 6 Flux decomposition model of COD export flux from 2014 to 2017
表 1 各季节浮标FDOM及实测COD的混合曲线及相关性方程
Tab. 1 Mixed curves of sensor FDOM and measured COD and their correlation equations in different seasons
时间 盐度−FDOM 盐度−COD FDOM−COD 混合曲线 r2 混合曲线 r2 相关性方程 r2 2016年12月 y=−0.5x+14.1 0.98 y=−0.07x+1.9 0.91 y=5.7x+0.7 0.91 2017年2月 y=−0.5x+15.3 0.90 y=−0.06x+2.4 0.98 y=8.8x−6.15 0.94 2017年4月 y=−1.1x+28.2 0.91 y=−0.07x+2.6 0.96 y=14x−8 0.96 2018年4月 y=−0.8x+24.3 0.81 y=−0.1x+3.9 0.96 y=6.4x−2 0.96 2018年7月17日 y=−0.9x+27.9 0.98 y=−0.08x+3.3 0.96 y=8.2x−5.3 0.98 2018年7月23日 y=−0.7x+24.1 0.98 y=−0.08x+2.7 0.93 y=8.2x+1.1 0.91 2018年10月 − − y=−0.1x+3.9 0.97 − −  下载: 导出CSV
表 2 2014−2017年不同季节COD河端表观浓度、径流量及COD入海通量
Tab. 2 Seasonal effective COD concentrations, total runoff and total export fluxes between 2014−2017
时间 COD浓度/
(mg·L−1)径流量/
(109 m3)COD入海通量/
(104 t)2014年 旱季(前) 2.51±0.37 1.64 0.41 梅雨期 2.81±0.48 4.87 1.37 台风期 2.49±0.42 3.38 0.84 旱季(后) 2.94±0.33 1.35 0.39 2015年 旱季(前) 3.08±0.51 0.96 0.30 梅雨期 2.96±0.69 3.00 0.93 台风期 2.51±0.42 5.68 1.39 旱季(后) 2.25±0.33 2.47 0.56 2016年 旱季(前) 1.78±0.42 4.81 0.81 梅雨期 1.80±0.32 7.02 1.25 台风期 2.04±0.65 6.20 1.24 旱季(后) 2.10±0.45 5.24 1.14 2017年 旱季(前) 2.35±0.43 2.42 0.57 梅雨期 2.68±0.43 5.21 1.27 台风期 2.49±0.52 3.37 0.84 旱季(后) 3.00±0.35 1.33 0.40
下载: 导出CSV
表 3 通量分解模型解析的各组分相对贡献
Tab. 3 Quantification for each component of flux decomposition model
年度 时期 CmQm CmQ′ C′Qm C′Q′ CQ 2014 旱季(前) 180.2% −73.3% −12.35 5.4% 100% 梅雨期 55.0% 40.6% 2.5% 1.9% 100% 台风期 90.6% 17.6% −6.8% −1.4% 100% 旱季(后) 194.9% −102.3% 19.0% −11.6% 100% 2015 旱季(前) 250.6% −163.7% 36.1% −23.0% 100% 梅雨期 80.9% 5.8% 8.1% 5.2% 100% 台风期 54.8% 55.1% −3.7% −6.2% 100% 旱季(后) 135.5% −17.3% −22.1% 3.9% 100% 2016 旱季(前) 93.0% 66.6% −31.6% −28.1% 100% 梅雨期 60.3% 90.9% −20.1% −31.1% 100% 台风期 61.3% 72.8% −14.8% −19.2% 100% 旱季(后) 66.7% 56.7% −14.6% −8.8% 100% 2017 旱季(前) 130.0% −16.4% −16.3% 2.7% 100% 梅雨期 59.5% 51.2% −0.4% −10.3% 100% 台风期 91.1% 17.2% −6.9% −1.4% 100% 旱季(后) 189.4% −100.6% 22.1% −10.9% 100%
下载: 导出CSV
-
[1] 劳齐斌, 卜德志, 张可欣, 等. 秋冬季台湾海峡西部海域大气颗粒物中有机氯农药的污染特征及入海通量[J]. 海洋环境科学, 2019, 38(4): 602−607, 614. doi: 10.12111/j.mes20190418Lao Qibin, Bu Dezhi, Zhang Kexin, et al. Characteristics and dry deposition fluxes of organochlorine pesticides (OCPs) in atmospheric particulate matters in Western Taiwan Strait during autumn and winter[J]. Marine Environmental Science, 2019, 38(4): 602−607, 614. doi: 10.12111/j.mes20190418 [2] 刘汉霖, 聂红涛, 王雅丽, 等. 基于统计数据的滨海地区污染物入海通量计算方法研究与应用—以天津市为例[J]. 海洋环境科学, 2019, 38(6): 968−976. doi: 10.12111/j.mes20190622Liu Hanlin, Nie Hongtao, Wang Yali, et al. Estimation method of pollutant load into sea using statistical data—Tianjin City[J]. Marine Environmental Science, 2019, 38(6): 968−976. doi: 10.12111/j.mes20190622 [3] 魏珈, 郭卫东, 王志恒, 等. 降雨事件对不同流域背景河流DOM组成及入海通量的影响[J]. 农业环境科学学报, 2016, 35(4): 737−744. doi: 10.11654/jaes.2016.04.018Wei Jia, Guo Weidong, Wang Zhiheng, et al. Impacts of storm event on DOM composition and flux in two Jiulong Tributaries with different watershed features[J]. Journal of Agro-Environment Science, 2016, 35(4): 737−744. doi: 10.11654/jaes.2016.04.018 [4] Nellemann C, Hain S, Alder J. In Dead Water: Merging of Climate Change with Pollution, Over-Harvest, and Infestations in the World’s Fishing Grounds[M]. Norway: United Nations Environment Programme (UNEP), 2008. [5] Ebi K L, Bowen K. Extreme events as sources of health vulnerability: Drought as an example[J]. Weather and Climate Extremes, 2016, 11: 95−102. doi: 10.1016/j.wace.2015.10.001 [6] Chen Nengwang, Wu Jiezhong, Hong Huasheng. Effect of storm events on riverine nitrogen dynamics in a subtropical watershed, southeastern China[J]. Science of the Total Environment, 2012, 431: 357−365. doi: 10.1016/j.scitotenv.2012.05.072 [7] Yang Liyang, Hur J, Lee S, et al. Dynamics of dissolved organic matter during four storm events in two forest streams: source, export, and implications for harmful disinfection byproduct formation[J]. Environmental Science and Pollution Research, 2015, 22(12): 9173−9183. doi: 10.1007/s11356-015-4078-6 [8] 陈拥, 魏珈, 林彩, 等. 基于CDOM光学特性的近海环境富营养化监测[J]. 光谱学与光谱分析, 2017, 37(12): 3803−3808.Chen Yong, Wei Jia, Lin Cai, et al. Based on optical properties of chromophoric dissolved organic matter in the monitoring of coastal eutrophication[J]. Spectroscopy and Spectral Analysis, 2017, 37(12): 3803−3808. [9] Coble P G, Gagosian R B, Codispoti L A, et al. Vertical distribution of dissolved and particulate fluorescence in the Black Sea[J]. Deep-Sea Research Part A. Oceanographic Research Papers, 1991, 38(S2): S985−S1001. [10] 崔扬, 朱广伟, 张运林, 等. 湖库富营养化指标的高频监测方法研究[J]. 环境科学学报, 2014, 34(5): 1178−1185.Cui Yang, Zhu Guangwei, Zhang Yunlin, et al. Estimation of lake trophic level index with high-frequency sensor parameters[J]. Acta Scientiae Circumstantiae, 2014, 34(5): 1178−1185. [11] 郭卫东, 黄建平, 洪华生, 等. 河口区溶解有机物三维荧光光谱的平行因子分析及其示踪特性[J]. 环境科学, 2010, 31(6): 1419−1427.Guo Weidong, Huang Jianping, Hong Huasheng, et al. Resolving excitation emission matrix spectroscopy of estuarine CDOM with parallel factor analysis and its application in organic pollution monitoring[J]. Environmental Science, 2010, 31(6): 1419−1427. [12] 黄妙芬, 宋庆君, 毛志华, 等. 应用CDOM光学特性估算水体COD——以辽宁省盘锦市双台子河和辽东湾为例[J]. 海洋学报, 2011, 33(3): 47−54.Huang Miaofen, Song Qingjun, Mao Zhihua, et al. The retrieval model for COD in waters using optical absorption properties of CDOM—a case study at the Shuangtaizi River and the Liaodong Gulf[J]. Haiyang Xuebao, 2011, 33(3): 47−54. [13] 袁媛, 高辉, 贾小龙, 等. 2014−2016年超强厄尔尼诺事件的气候影响[J]. 气象, 2016, 42(5): 532−539. doi: 10.7519/j.issn.1000-0526.2016.05.002Yuan Yuan, Gao Hui, Jia Xiaolong, et al. Influences of the 2014−2016 Super El Niño event on climate[J]. Meteorological Monthly, 2016, 42(5): 532−539. doi: 10.7519/j.issn.1000-0526.2016.05.002 [14] 陈洁鹏, 温之平, 王鑫. 2015/2016超强El Niño对中国南方冬春季降水的影响分析[J]. 大气科学学报, 2016, 39(6): 813−826.Chen Jiepeng, Wen Zhiping, Wang Xin. Analysis of winter and spring precipitation over Southern China during 2015/2016 extreme El Niño[J]. Transactions of Atmospheric Sciences, 2016, 39(6): 813−826. [15] Ma Feng, Ye Aizhong, You Jinjun, et al. 2015−16 floods and droughts in China, and its response to the strong El Niño[J]. Science of the Total Environment, 2018, 627: 1473−1484. doi: 10.1016/j.scitotenv.2018.01.280 [16] 黄秀琴. 九龙江流域水文特性[J]. 水利科技, 2008(1): 16−20.Huang Xiuqin. Hydrological characteristics of Jiulong River basin[J]. Hydraulic Science and Technology, 2008(1): 16−20. [17] 陈能汪. 全球变化下九龙江河流−河口系统营养盐循环过程、通量与效应[J]. 海洋地质与第四纪地质, 2018, 38(1): 23−31.Chen Nengwang. Nutrient cycling processes, fluxes and effects in the Jiulong river-estuary system under global change[J]. Marine Geology & Quaternary Geology, 2018, 38(1): 23−31. [18] 颜秀丽, 翟惟东, 洪华生, 等. 九龙江口营养盐的分布、通量及其年代际变化[J]. 科学通报, 2012, 57(17): 1578−1587.Yan Xiuli, Zhai Weidong, Hong Huasheng, et al. Distribution, fluxes and decadal changes of nutrients in the Jiulong River Estuary, Southwest Taiwan Strait[J]. Chinese Science Bulletin, 2012, 57(17): 1578−1587. [19] Gao Xinjuan, Chen Nengwang, Yu Dan, et al. Hydrological controls on nitrogen (ammonium versus nitrate) fluxes from river to coast in a subtropical region: Observation and modeling[J]. Journal of Environmental Management, 2018, 213: 382−391. [20] Cai Weijun. Riverine inorganic carbon flux and rate of biological uptake in the Mississippi River plume[J]. Geophysical Research Letters, 2003, 30(2): 1032. [21] Hur J, Cho J. Prediction of BOD, COD, and total nitrogen concentrations in a typical urban river using a fluorescence excitation-emission matrix with PARAFAC and UV absorption indices[J]. Sensors, 2012, 12(1): 972−986. doi: 10.3390/s120100972 [22] Guo Weidong, Yang Liyang, Hong Huasheng, et al. Assessing the dynamics of chromophoric dissolved organic matter in a subtropical estuary using parallel factor analysis[J]. Marine Chemistry, 2011, 124(1/4): 125−133. [23] Hong Huasheng, Yang Liyang, Guo Weidong, et al. Characterization of dissolved organic matter under contrasting hydrologic regimes in a subtropical watershed using PARAFAC model[J]. Biogeochemistry, 2012, 109(1/3): 163−174. [24] 厦门市气象局. 2016年厦门市气候公报[R]. 厦门: 厦门市气象局, 2016: 2−4.Xiamen Meteorological Bureau. 2016 Xiamen Climate Bulletin[R]. Xiamen: Xiamen Meteorological Bureau, 2016: 2−4. [25] Chen Jiepeng, Wang Xin, Zhou Wen, et al. Unusual rainfall in Southern China in decaying August during extreme El Niño 2015−2016: Role of the western Indian Ocean and North Tropical Atlantic SST[J]. Journal of Climate, 2018, 31(17): 7019−7034. doi: 10.1175/JCLI-D-17-0827.1 [26] Ribarova I, Ninov P, Cooper D. Modeling nutrient pollution during a first flood event using HSPF software: Iskar River case study, Bulgaria[J]. Ecological Modelling, 2008, 211(1/2): 241−246. [27] Chen Nengwang, Wu Yinqi, Chen Zhuhong, et al. Phosphorus export during storm events from a human perturbed watershed, southeast China: Implications for coastal ecology[J]. Estuarine, Coastal and Shelf Science, 2015, 166: 178−188. doi: 10.1016/j.ecss.2015.03.023 [28] 郭卫东, 王超, 徐静, 等. 海洋有机质的光谱分析方法评述[J]. 海洋通报, 2018, 37(4): 601−614.Guo Weidong, Wang Chao, Xu Jing, et al. A review on the spectral analysis of marine organic matter[J]. Marine Science Bulletin, 2018, 37(4): 601−614. -

计量
- 文章访问数: 520
- HTML全文浏览量: 210
- PDF下载量: 24
- 被引次数: 0
